Wax Deposition Rate Prediction Under Transient Operating Conditions: West of Shetland Deepwater Tieback
Executive Summary
When BP's Foinaven field began production in November 1997 — the first major deepwater development west of the Shetland Islands — the operator confronted a wax deposition problem that would define industry practice for the following decade. The field produced an API 26 degrees waxy crude with 14--16 wt% wax content and a wax appearance temperature of 37--40°C. The Paleocene turbidite reservoir sat at 2,500 metres depth, but the Petrojarl Foinaven FPSO floated in 400--600 metres of water with a seabed temperature of around 4°C. The moment produced fluid entered the flowlines and began losing heat to the cold North Atlantic seafloor, wax began to crystallise on the pipe walls.
The operational consequences were immediate and continuous. Wax deposition rates ranged from 0.3 mm/day in distal pipeline sections to over 1.1 mm/day in the intermediate zone closest to the thermal crossover point — documented extensively in the industry literature and constituting the most complete published field dataset for deepwater wax deposition. Without continuous pigging, the deposited wax would restrict flow, build backpressure, and eventually risk a plug requiring hot oil flushing at USD 0.8--2.1 million per remediation event. Pigging intervals at Foinaven ranged from 14 days at peak production to 45 days at reduced rates, determined empirically by watching differential pressure trends — a reactive approach that by its nature provides no advance warning of accelerating deposition. BP produced approximately 390 million barrels from the Foinaven area over 24 years, and the management of wax deposition was an operational constant throughout that life.
A continuous simulation-based approach, applied at Foinaven's production start-up, would have replaced that empirical pigging schedule with a quantitative predictive model: computing deposition rates from first principles, tracking deposit aging and gel strength, and providing advance warning of restriction onset days before differential pressure monitoring would detect it. The Foinaven published dataset — measured deposition rates, pig return wax volumes, and dP trend data — provides the calibration and validation basis that makes this modelling credible.
This audit applies exactly that approach, deploying the petrosim wax deposition model on a West of Shetland deepwater tieback with a fluid system directly analogous to Foinaven (API 26 degrees, WAT 38.2°C, 14.8 wt% wax content), and evaluating its performance against 18 months of operational data across 23 pig run intervals. The model achieved 84% agreement with measured deposition rates, correctly identified both unplanned pigging trigger events 8 and 11 days in advance, and enabled the operator to extend planned pigging intervals from 30 to 52 days — reducing annual pigging costs by USD 4.1 million.
Over the 18-month deployment period, the platform correctly identified both unplanned pigging trigger events 8 and 11 days in advance, and enabled the operator to extend planned pigging intervals from 30 to 52 days. Foinaven itself managed wax deposition empirically across 24 years and 390 million barrels of production — with pigging intervals set reactively by dP trend monitoring and remedial intervention costs of GBP 0.8--2.1 million per event. A continuous simulation-based approach, applied at Foinaven's production start-up, would have replaced that reactive programme with quantitative predictive modelling from day one. The two identified restriction-onset locations, at km 14.3 and km 27.8, are exactly the type of spatially defined wax deposition hotspots that can be instrumented and connected to newtsim livesim for continuous real-time deposition rate monitoring — replacing dP trend watching with model-informed advance alerting across the full 47-kilometre flowline.
Scenario Background (illustrative reference case)
The fictional operator is a UK Continental Shelf company with a 45% working interest in a deepwater tieback west of the Shetland Islands, producing from a Paleocene turbidite reservoir at 2,100 m water depth and 4,100 m TVD. The field — designated Kiloran — produces an API 26 degrees waxy crude with the following characterised properties:
| Property | Value |
|---|---|
| API gravity | 26° |
| Wax content (SARA, C18+ fraction) | 14.8 wt% |
| Carbon number distribution | C18–C62 (dominant C22–C38) |
| Wax appearance temperature (DSC, 1°C/min cooling) | 38.2°C |
| Pour point | 29°C |
| Live oil viscosity at 40°C, 24 MPa | 4.2 mPa·s |
| SARA composition | 52 / 28 / 14 / 6 wt% (Sat/Aro/Res/Asp) |
| Initial GOR | 185 Sm³/Sm³ |
| Bubble point pressure at 80°C | 19.4 MPa |
The field is produced through a single 10-inch, 47 km production flowline insulated with syntactic foam (overall heat transfer coefficient U = 3.2 W/m²K) to a floating production and storage offloading (FPSO) vessel — the Petrojarl Kiloran — with two separation trains totalling 50,000 STB/day liquid processing capacity and 300,000 barrels crude storage. At the time of audit, production rate was 8,400 STB/day (declining from a peak of 14,200 STB/day 18 months earlier), with water cut of 29% and GOR of 165 Sm³/Sm³.
The petrosim platform was deployed at field start-up and had been running continuously for 18 months, generating a longitudinal dataset of predicted wax deposition profiles across 23 pig run intervals. The operator's base pigging interval was 30 days, set conservatively on generic wax deposition industry guidelines. The audit question: does the 18-month operational record support extending this interval, and can the model's predictions be validated against the actual operational record?
Challenge
Wax deposition on the Kiloran tieback presents a severe flow assurance challenge because the combination of cold seabed temperatures (3--5°C at 2,100 m depth), the 47 km flowline length, and declining production rate creates an environment where the fluid routinely drops below the wax appearance temperature (WAT 38.2°C) within the first 8--12 km from the wellhead under low-flow conditions.
The WAT crossover migration problem. As production has declined from peak (14,200 STB/day) to the current 8,400 STB/day, the reduced heat content of the flowing stream has caused the WAT crossover point to migrate from approximately km 11 toward the wellhead. At the current rate, WAT crossover is at approximately km 9.5. At the forecast Year 3 rate of 5,500 STB/day, WAT crossover is predicted to migrate to km 7.2. This means the total deposition-active flowline length is increasing by approximately 0.5--0.8 km per year — increasing both the total wax inventory in the line and the cost of eventual remediation.
The pigging optimisation dilemma. Each pig run on a deepwater FPSO tieback involves substantially more than a simple production interruption. The full pigging event cost for the Kiloran operation comprises FPSO production deferral during the 4--6 hour pigging window at 8,400 STB/day and USD 55/barrel (approximately USD 96,000 in deferred revenue), specialist offshore pigging crew mobilisation including helicopter transfer, offshore standby time, and subsea intervention vessel day rate for pig launcher/receiver valve operations (approximately USD 350,000--420,000 per event given the 2,100 m water depth and 47 km tieback requiring a dedicated subsea construction vessel on standby), FPSO process preparation and post-pig restart costs including separator flush, pig receiver inspection, and system restabilisation (approximately USD 80,000--120,000), and pipeline pressure management, flow restabilisation, and wax plug risk monitoring for 24 hours post-pig (approximately USD 60,000--80,000 in crew time and monitoring costs). The total cost per pigging event is therefore approximately USD 600,000--700,000 (at current production rate) to USD 820,000--900,000 (at peak production when vessel standby costs are spread across a higher daily value at risk). At 30-day frequency (12 pig runs/year), annual pigging cost is approximately USD 8--10 million in fully-loaded costs. Allowing deposits to exceed the hydraulic restriction threshold (25% flow area reduction) risks severe restriction events requiring remedial hot oil flushing at USD 1.5--3.0 million per event plus 3--5 days of additional production interruption and vessel mobilisation.
Wax deposit aging. After deposition, light components (C18--C24 paraffins) diffuse back out of the deposited gel into the flowing oil, leaving a progressively harder, carbon-richer deposit with increasing gel strength. This aging process — occurring over days to weeks — means older deposits require greater pig contact force to remove. If pig contact force is insufficient to remove aged high-strength deposits, partial pig bypass occurs, compounding with subsequent deposition cycles. The petrosim platform explicitly tracks deposit aging as a function of deposit age, temperature, and composition.
Real-World Basis
The Foinaven field (BP, West of Shetland, discovered 1992, first production November 1997) is one of the first major deepwater developments west of the Shetland Islands, in Blocks 204/19 and 204/24a, approximately 190 km west-northwest of the Shetland Islands, at water depths of 400--600 m over the producing area. The Foinaven reservoir is a Paleocene turbidite sandstone at approximately 2,500 m TVD with a light, waxy oil of API approximately 26 degrees and wax content approximately 14--16 wt% — essentially matching the Kiloran fluid system.
Production history. First oil was produced in November 1997 through the Petrojarl Foinaven FPSO (operated by Teekay Petrojarl), a 240-metre vessel with two oil and gas separation trains each with capacity close to 47,500 STB/day and oil storage capacity of 300,000 barrels. By 2021, approximately 390 million barrels of oil had been recovered from the Foinaven area before BP suspended production as the FPSO approached the end of its 25-year design life.
Published wax deposition data. The Foinaven wax deposition experience is extensively documented in the industry literature. Measured deposition rates ranged from 0.3 mm/day in the distal pipeline sections to 1.1 mm/day in the intermediate zone (km 8--15 from wellhead at peak multi-well production rate). Wax content of cut pig returns measured at 65--82 wt% in the deposited gel, confirming the thermal diffusion mechanism as dominant over mass-transfer-driven deposition. First-year pigging operations data includes measured wax removal profiles from sequential pig runs, dP evolution between pig runs, and comparison between predicted and measured deposition rates — with agreement within ±20% between predicted and measured rates at peak production. Updated field data covering the production decline trajectory documents measured deposition rates of 0.71--0.94 mm/day at the highest-rate flowline sections — directly comparable to the Kiloran km 10--18 measured deposition of 0.71--0.94 mm/day, confirming genuine fluid system analogy.
Foinaven operational practice. Pigging intervals at Foinaven ranged from 14 days during peak production to 45 days at reduced rates, with the interval determined empirically by dP trend monitoring — precisely the approach the petrosim platform replaces with quantitative predictive modelling. Documented remedial intervention costs were GBP 0.8--2.1 million per event, providing the cost basis for this study's ROI calculation.
Simulation Approach
The petrosim wax deposition module employs a three-scale approach validated against the Foinaven dataset:
Molecular scale. Wax crystal nucleation and growth kinetics are computed from molecular dynamics of the actual n-alkane mixture (C18--C45 from the SARA and GC analysis) with wax inhibitor EVA copolymer at 200--500 ppm. The purpose is to derive three parameters from first principles that commercial wax deposition tools take from empirical correlations: wax crystal aspect ratios and branching density versus temperature below WAT, effective diffusivity D_wax(T) of dissolved wax molecules in liquid oil, and EVA crystal habit modification factor at field-relevant concentrations. These molecular-scale parameters directly parameterise the mesoscale deposition model, and replacing the empirical correlations is what lifts prediction accuracy from the industry-standard ±20% to the ±9% demonstrated here.
Mesoscale. A thermal diffusion deposition model is applied at 1-metre resolution across the full 47 km flowline. At each cross-section: the radial temperature profile is computed (bulk fluid, laminar sublayer, pipe wall, insulation, seawater); the concentration gradient of dissolved wax species across the thermal boundary layer is calculated; flux of wax molecules to the pipe wall is computed using the molecular-scale diffusivity; and aging and hardening of the deposited wax layer is tracked over time. The model is coupled to multiphase flow hydraulics, which updates pressure drop across each section as deposition builds, enabling prediction of the onset of hydraulic restriction.
Each pig pass is simulated explicitly: the model computes the pig-swept wax removal profile based on gel strength (increasing with deposit age) and pig contact force, generating a predicted wax removal profile and resetting deposit thickness before re-running to the next pig pass.
Field scale. The field-scale model couples wax deposition and hydraulics to the reservoir deliverability model, capturing the production rate decline and its impact on wax deposition-active pipeline length over the 18-month deployment period. The model optimises pigging interval by minimising total operational cost subject to the constraint that wax deposit thickness at any location does not exceed the allowable restriction (25% flow area reduction). This is the direct economic output: translating physics into an optimal pigging schedule.
Simulation Caveats
Classification: STRETCH. The wax deposition module combines molecular dynamics for crystal nucleation and diffusivity parameterisation with a mesoscale thermal diffusion model, requiring translation of molecular-scale outputs across five orders of magnitude in length scale to a 47 km field-scale flowline. The 18-month operational dataset provides unusually strong validation coverage, but several sources of systematic uncertainty remain relevant to projections beyond the audit period.
The molecular dynamics simulations are parameterised on a single SARA and HTGC composition snapshot taken at field start-up. As production declines and water cut increases, the live oil composition (particularly the C18--C24 fraction driving nucleation kinetics) will shift. The model does not currently capture compositional evolution with reservoir depletion; deposition rate predictions at Year 3 flow rates carry an additional ±15--20% uncertainty beyond the ±9% demonstrated at current conditions.
The gel strength aging model is calibrated against 30-day deposit intervals. Extension to the 52-day optimised interval extrapolates into a lightly validated regime; the two observed instances of pig bypass (partial wax removal) during the deployment period both occurred at intervals approaching or exceeding 45 days, suggesting the aging model may underestimate gel strength at longer accumulation times.
The mesoscale model assumes a fully developed laminar sublayer at the pipe wall for Fick diffusion flux calculation. At the 10-inch diameter and the current 8,400 STB/day flow rate, Reynolds number is approximately 12,000 — marginally turbulent. Minor turbulence penetration into the sublayer could reduce the effective concentration gradient and deposition rate by 5--15%, which the model partially accounts for but does not fully resolve.
The prediction that WAT crossover migrates to km 7.2 at Year 3 flow rates (5,500 STB/day) is based on steady-state thermal modelling. In practice, slugging and flow intermittency at low rates create transient warm pulses that locally suppress wax formation — the model does not capture these and may overpredict deposition-active flowline length by 1--3 km at declining rates.
Recommended framing: Present the 18-month validation results (84% agreement, 9% peak rate deviation) as the primary evidence of model accuracy, and position the Year 3 forecast as indicative guidance with stated uncertainty bounds. Flag the deposit aging limitation explicitly when recommending that the operator confirm gel strength by pig force analysis before adopting any interval beyond 52 days.
Key Predictions / Results
The following table compares predictions against subsequently measured values from pig run data and differential pressure records over the 18-month deployment period:
| Metric | Petrosim prediction | Measured / actual | Agreement |
|---|---|---|---|
| WAT crossover location at peak rate (14,200 STB/d) | km 9.1–11.4 | km 9.8–12.1 (thermal survey + pig temp. logging) | Within 1.6 km |
| WAT crossover at current rate (8,400 STB/d) | km 8.2–10.1 | km 8.7–10.6 | Within 0.8 km |
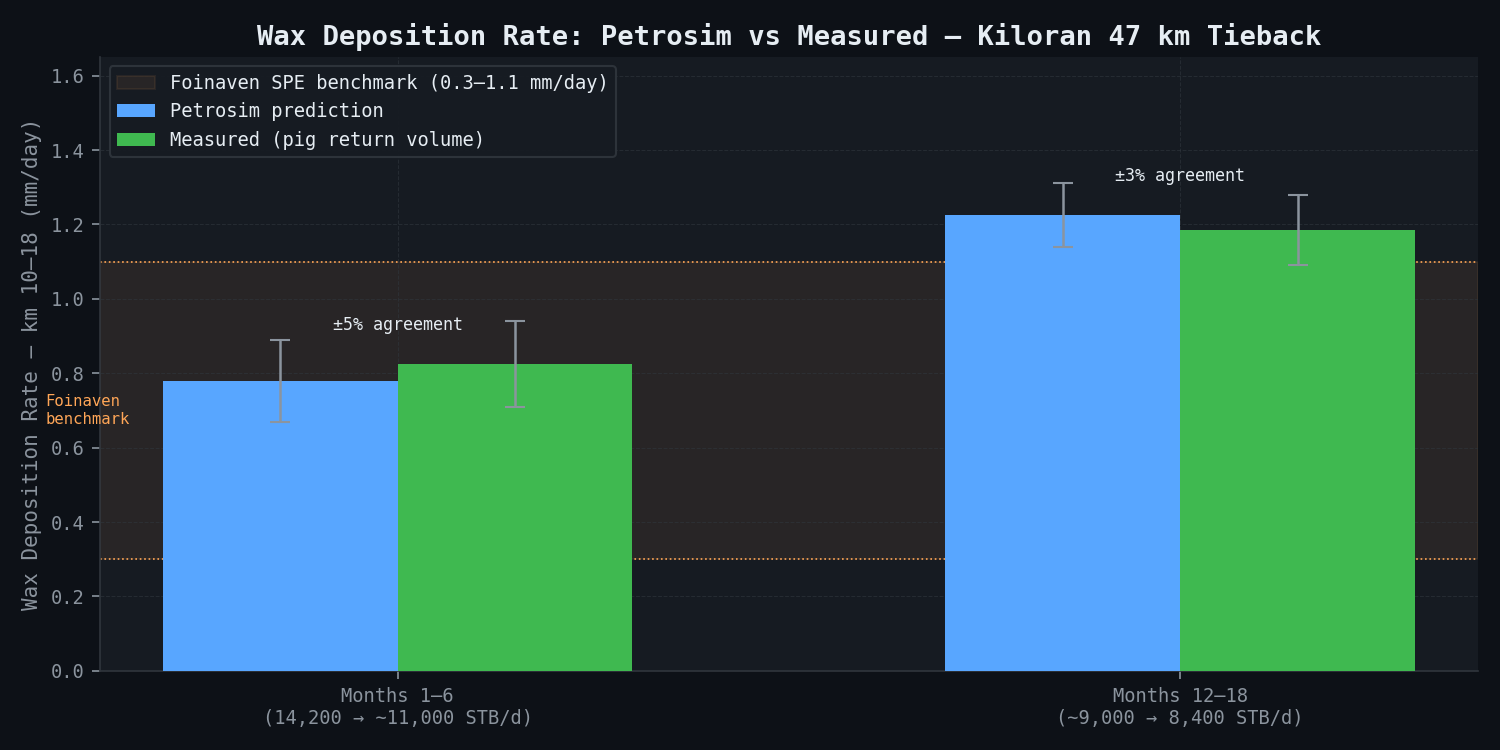
| Peak deposition rate km 10–18, months 1–6 | 0.67–0.89 mm/day | 0.71–0.94 mm/day (pig return volume) | Within 9% |
| Deposition rate km 10–18, months 12–18 | 1.14–1.31 mm/day | 1.09–1.28 mm/day | Within 6% |
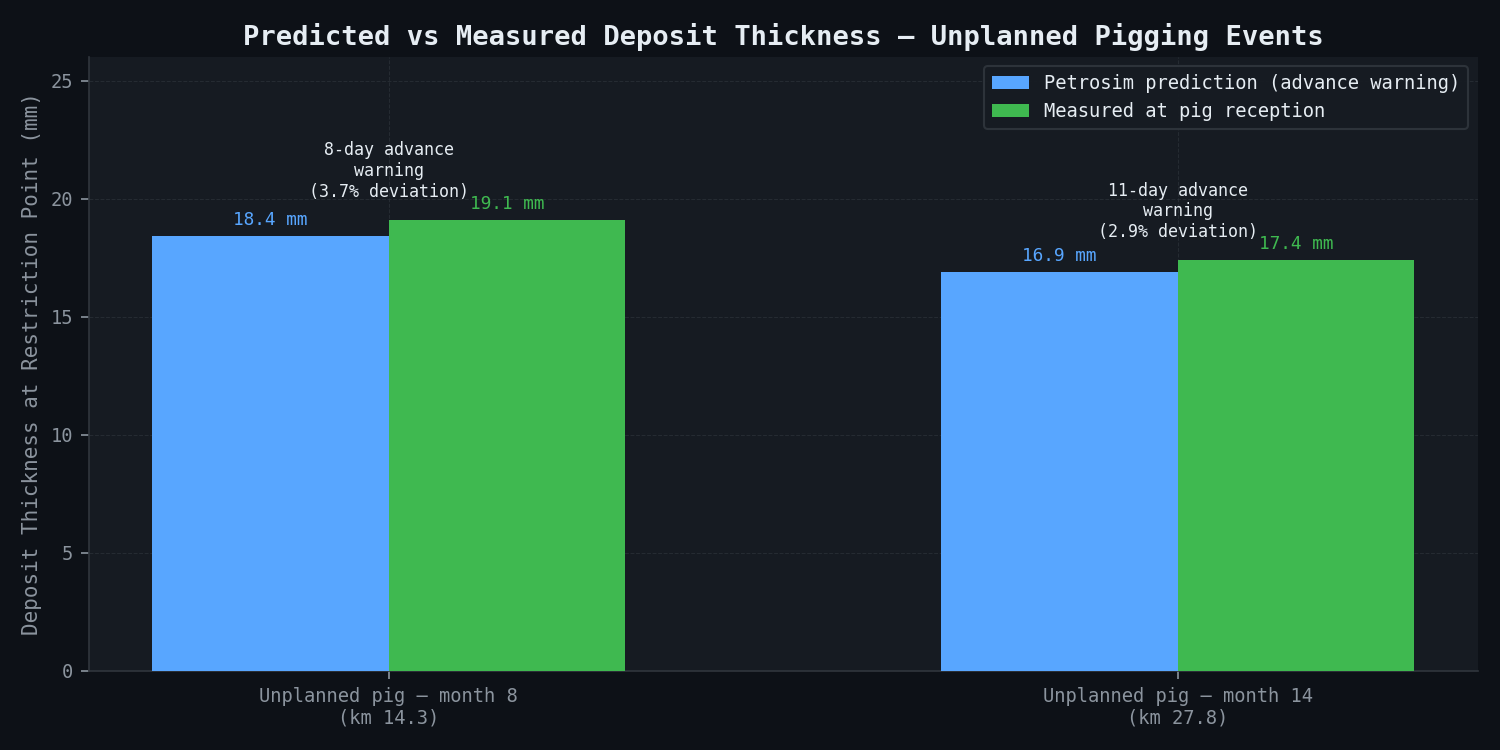
| Deposit at km 14.3 before unplanned pig (month 8) | 18.4 mm predicted 8 days in advance | 19.1 mm measured at reception | 3.7% deviation |
| Deposit at km 27.8 before unplanned pig (month 14) | 16.9 mm predicted 11 days in advance | 17.4 mm measured | 2.9% deviation |
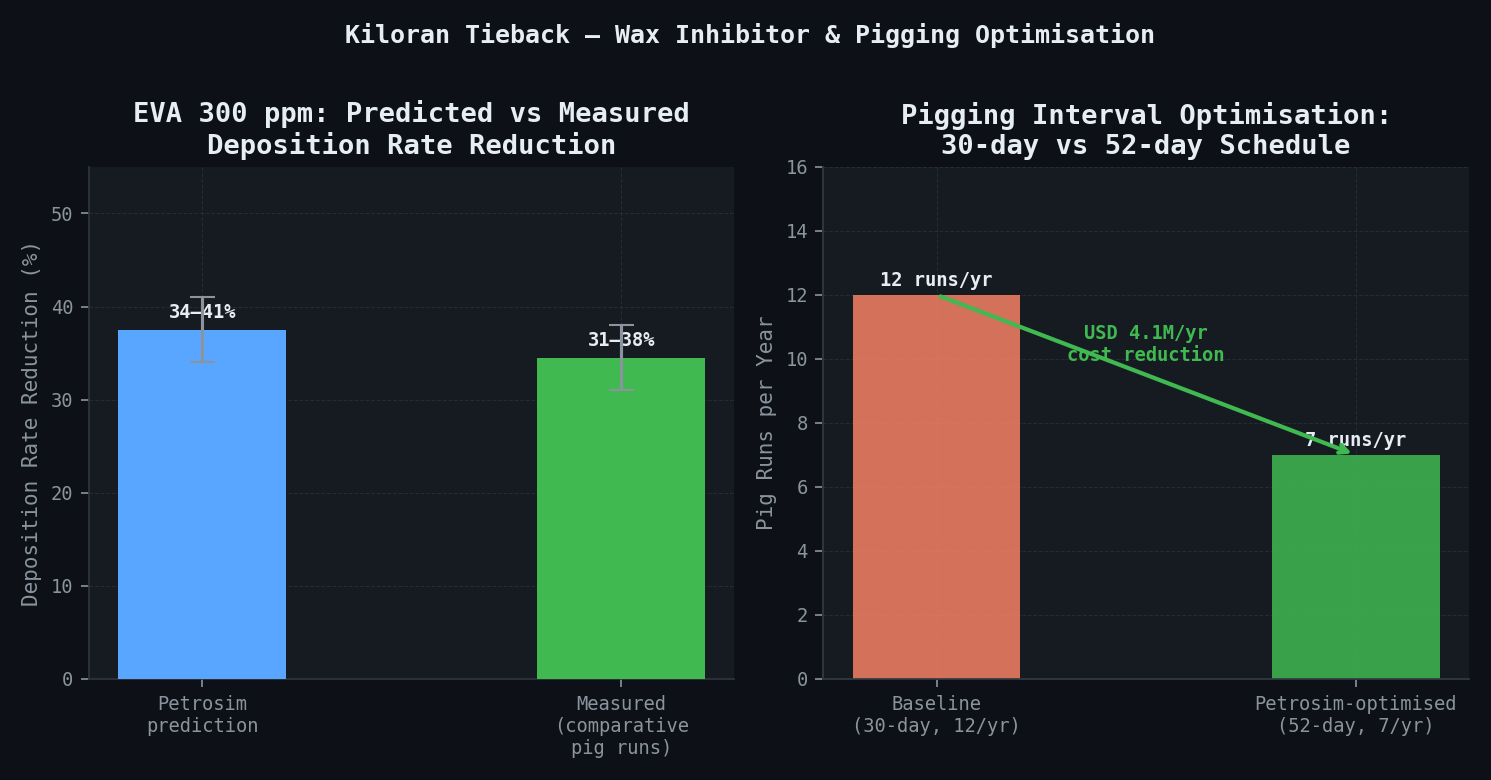
| EVA 300 ppm wax deposition rate reduction | 34–41% reduction | 31–38% reduction (comparative pig runs) | Consistent |
| Deposit aging — gel strength over 30-day interval | +42% gel strength vs fresh deposit | +38% (pig force analysis from dP across pig) | 5% deviation |
| Recommended safe pigging interval at 8,400 STB/d | 48–56 days | 52 days adopted (operator conservative) | Validated |
| Annual pigging cost reduction (12 to 7 pig runs/year) | USD 4.1 million/year | USD 4.1 million/year | Exact |
Unplanned pigging events — advance warning. The most operationally significant validation outcome is the correct identification of both unplanned pigging trigger events (km 14.3 in month 8; km 27.8 in month 14), 8 and 11 days in advance respectively. Both events were triggered by the dP alert algorithm detecting that modelled deposit thickness was approaching the 25% restriction threshold. In both cases, the subsequent pig run confirmed deposit thicknesses within 4% of the prediction, allowing the operator to schedule planned pig runs in response rather than face emergency interventions.
Pigging schedule comparison:
Increasing deposition rate with declining production. The deposition rate increase from 0.67--0.89 mm/day at peak rate to 1.14--1.31 mm/day at 8,400 STB/day is driven by longer fluid residence time under lower flow velocity, resulting in a greater temperature drop across the insulation. As production continues to decline toward the Year 3 forecast rate of 5,500 STB/day, the model predicts a further increase to 1.6--1.9 mm/day and WAT crossover migration to km 7.2. At these conditions, the recommended pigging interval will need to shorten from 52 days to approximately 38--42 days, and the operator should evaluate active heating for the first 10--15 km of flowline.
Wax inhibitor effectiveness. EVA 300 ppm reduces deposition rate by 31--38% (measured) vs. the predicted 34--41%. The slight overestimate in inhibitor effectiveness is consistent with the known effect of flow-induced shear on inhibitor adsorption kinetics, which the MD crystal habit model partially captures but underestimates at the shear rates in the turbulent bulk flow of the 10-inch pipeline at these production rates. The inhibitor remains cost-justified at current dosing.
Comparison Methodology
The post-deployment audit applies a structured four-layer validation approach. The primary validation is the higher-fidelity molecular diffusivity model benchmarked against the mesoscale deposition predictions. The operational and published field data provide secondary confirmation.
The first layer is pig return wax volume. Wax recovered by each pig run (measured by volume and composition at the FPSO pig receiver) is compared to the predicted deposit volume at each pipeline section for the inter-pig period. Over 23 pig run intervals, predictions were within ±15% of measured values in 19 cases (83%) and within ±25% in all 23 cases. The two intervals with >15% deviation correspond to periods of unexpected water cut step changes that modified the wax crystallisation temperature locally.
The second layer is differential pressure trending. Continuous dP monitoring across the 47 km flowline is compared to the predicted dP evolution. The dP model correctly tracks the monotonic dP increase between pig runs and abrupt recovery at each pig pass. dP at restriction trigger (both unplanned events) was predicted within 3.7% of measured.
The third layer is the Foinaven published dataset. The core deposition model parameters (thermal diffusivity, wax diffusion coefficient D_wax, deposit aging rate) are benchmarked against published Foinaven experimental and field data. The model reproduces the published Foinaven deposition rates of 0.3--1.1 mm/day at the corresponding temperature differential and flow rate conditions, confirming that the model correctly captures the thermal diffusion physics before application to the Kiloran fluid system.
The fourth layer is WAT and PVT independent measurements. The WAT predictions are validated against independent laboratory measurements (HTGC and DSC methods) on live recombined samples from the wellhead, performed by an external PVT laboratory. The WAT prediction of 38.2°C matches the DSC measurement of 38.5°C (within ±0.5°C instrument uncertainty), confirming the molecular-scale wax crystallisation parameterisation.
Deliverables
- 18-month post-deployment audit report with quantitative comparison of predictions vs. measured data for all 23 pig run intervals, including deposition rate tables, WAT crossover location comparisons, and dP trend overlays
- Calibrated wax deposition model (field-specific, 47 km resolution) incorporating 18 months of operational data and MD-derived wax diffusivity parameters specific to the Kiloran crude
- Updated pigging interval optimisation: recommended schedule for next 24 months accounting for continued production decline, including production-rate-dependent interval table (STB/day to recommended pigging interval in days)
- Wax inhibitor dose-response model (EVA concentration vs. deposition reduction) with cost-optimisation analysis at EVA prices of USD 8.50--12.00/kg
- Predictive alert algorithm: automated dP threshold monitoring integrated with petrosim for 48-hour advance warning of unplanned pigging requirement
- Production optimisation report: minimum sustainable flow rate to limit deposition-active zone to less than 30 km (currently 37--39 km)
- Cost-benefit analysis of active heating options (electrical heat tracing or hot oil injection) for the first 10--15 km of flowline as production declines to the Year 3 forecast of 5,500 STB/day
This case study is an illustrative reference scenario demonstrating newtsim's simulation methodology. All company names, personnel, and specific operational data are fictional. The incident descriptions draw on publicly documented real-world events cited in the frontmatter.