Blast Fragmentation Optimisation and Damage Control in Hard Rock Open Pit: DEM with Voronoi Tessellation and Explosive Energy Modelling
Executive Summary
For eighteen months, the northwest wall of a large hard rock gold–copper open pit in Western Australia's Eastern Goldfields produced blast muck that was, on average, 72% coarser than what the primary gyratory crusher needed. The P80 fragment size averaged 620 mm against a 360 mm target. Crusher throughput averaged 1,940 tonnes per hour against a rated capacity of 2,800. Secondary breaking crews were called out fourteen times per blast at an annual cost of AUD 2.1 million. Berm crests were systematically destroyed by back-break extending 8.4 metres beyond the design limit in the northwest sector, compromising final pit wall integrity. The cost of this persistent underperformance — in lost throughput alone — was AUD 18–24 million per year. The blast design remained unchanged throughout, because the empirical Kuz-Ram model used for blast planning predicted a P80 of 485 mm: wrong by 22%, and wrong for a structural reason it was constitutively incapable of identifying.
The structural reason was a previously unmapped joint set — J4, striking 005 degrees and dipping 82 degrees west — oriented almost exactly parallel to the northwest sector blast line direction. Detonation gases channelled along J4 planes rather than fragmenting rock bridges, producing coherent slab ejection and systematic back-break in the J4 strike direction. J4 had been present throughout the mine's operating history. It was invisible to Kuz-Ram, which collapses all structural geology into a single empirical rock factor. It was visible in one week of DEM simulation once oriented acoustic televiewer logging of three new boreholes had been completed.
Had a DEM blast simulation been applied to the northwest sector during the initial blast design phase — incorporating the four joint sets revealed by oriented core — the analysis would have identified J4's role in both fragmentation coarseness and back-break generation, and recommended a 45-degree blast line rotation and a stemming ratio reduction from T/B = 1.07 to 0.76. Those two changes, combined with a powder factor increase from 0.28 to 0.42 kg/t, would have delivered P80 performance within 7% of the crusher target from the first production quarter. The simulation also revealed a regulatory non-compliance that had gone undetected: the existing blast design generated predicted flyrock ranges of 280 metres, exceeding the 120-metre exclusion zone mandated by DMIRS regulations.
Three trial blasts with the revised design delivered P80 = 385 mm. Crusher throughput increased from 1,940 to 2,590 t/hr. Secondary breaking events fell from 14 to 3 per blast. Net annual benefit: AUD 19.75 million. The additional explosive cost was AUD 4.2 million per year. The simulation's identified risk zones — the J4-parallel blast line interaction in the northwest sector, the calc-silicate footwall energy deficit zone, and the collar zone unfragmented by excess stemming — define the sensor network for newtsim livesim: real-time WipFrag image analysis tracking P80 per blast against DEM predictions, crusher throughput monitoring providing continuous mine-to-mill feedback, and blast-by-blast back-break surveys that verify the J4 interaction model is tracking correctly as the pit geometry evolves.
Scenario Background
A publicly listed Australian gold–copper producer — designated Kalgoorlie Ridge Mining Ltd (KRML) — operates an open pit mine in the Eastern Goldfields region of Western Australia, approximately 40 km north of Kalgoorlie-Boulder, one of the world's most historically significant gold mining districts characterised by greenstone belt geology. KRML has a market capitalisation of approximately AUD 1.8 billion, with the Kalgoorlie Ridge mine accounting for approximately AUD 220 million of annual EBITDA. At rated capacity, the processing circuit produces approximately 185,000 oz Au plus 14,000 t Cu per year.
The pit is currently 2.1 km (N--S) by 1.6 km (E--W) by 320 m depth, with a bench geometry of 12 m bench height (double-bench: 2 x 6 m flitch blasts) and 3 m berm width. Annual rock movement totals 85 Mtpa (ore + waste combined), with ore feed to the plant of approximately 22 Mtpa at 0.98 g/t Au + 0.11% Cu. The processing circuit comprises a gyratory primary crusher (60 x 89 in., rated 2,800 t/hr at F80 = 360 mm), SAG mill (38 ft diameter, 22 MW), ball mill (26 ft x 44 ft, 16.5 MW), flotation, and CIL leach.
The ore body is hosted in a greenstone belt sequence of altered dolerite and calc-silicate (skarn) interbedded with minor banded iron formation (BIF). The contact between hanging wall dolerite and footwall calc-silicate dips at approximately 65 degrees to the southeast. There is a significant mechanical property contrast between units:
| Rock Unit | UCS (MPa) | Young's Modulus E (GPa) | T_b (MPa) | RMR | Q-system | GSI | Density (t/m3) |
|---|---|---|---|---|---|---|---|
| Dolerite (HW, main ore host) | 145--195 (mean 168) | 68--76 (mean 72) | 11.2--13.6 (mean 12.4) | 62--72 | 4.2--11.8 | 58--68 | 2.92 |
| Calc-silicate (FW skarn) | 210--280 (mean 248) | 80--90 (mean 85) | 14.2--19.4 (mean 16.8) | 70--78 | 8.4--18.6 | 66--74 | 3.08 |
| BIF (minor host) | 180--260 | 78--92 | 13.8--18.2 | 65--74 | 6.2--14.8 | 60--70 | 3.24 |
| Weathered zone (0--40 m depth) | 25--60 (mean 38) | 18--32 | 3.8--6.4 | 28--38 | 0.8--2.4 | 25--35 | 2.58 |
Pre-audit photogrammetric mapping identified three joint sets. Post-audit oriented acoustic televiewer logging of three new NQ-size boreholes revealed a fourth:
| Joint Set | Strike | Dip | Dip Direction | Mean Persistence (m) | Spacing (m) | Infill | JRC |
|---|---|---|---|---|---|---|---|
| J1 (dominant foliation) | 035 degrees | 65 degrees | SE | 8.4--14.2 m | 0.35--0.85 m | Clean, rough undulating | 9--14 |
| J2 (cross-cutting) | 125 degrees | 45 degrees | NE | 4.8--8.6 m | 0.55--1.20 m | Chlorite, wet | 5--8 |
| J3 (sub-horizontal) | Variable | 5--12 degrees | Variable | >12 m | 1.5--4.0 m | Clean, planar | 2--5 |
| J4 (unmapped pre-audit) | 005 degrees | 82 degrees | W | 7.2--12.4 m | 0.40--0.95 m | Clean, planar-rough | 7--11 |
The discovery of J4 was the most significant single finding of the audit. At mean spacing 0.65 m, it is the second-most frequent joint set in the northwest sector. J4 strikes at 005 degrees and dips steeply west at 82 degrees, running almost exactly parallel to the northwest sector blast line orientation (blast lines run 005--010 degrees azimuth). This geometric coincidence creates a classic parallel joint-blast interaction: detonation gases preferentially channel along J4 planes rather than fragmenting rock bridges, producing coherent slab ejection along J4 surfaces and systematic back-break in the direction of J4 strike.
The existing blast design at the time of audit is compared against the optimised parameters in the following table:
| Blast Design Parameter | Existing Value | Optimised Value | Change |
|---|---|---|---|
| Hole diameter | 165 mm | 165 mm (unchanged) | -- |
| Burden B | 4.5 m | 4.2 m | -7% |
| Spacing S | 5.2 m | 4.8 m | -8% |
| S/B ratio | 1.16 | 1.14 | Similar |
| Sub-drilling | 1.5 m (1.0xB) | 1.2 m (0.86xB) | -20% |
| Stemming T | 4.8 m (T/B = 1.07) | 3.2 m (T/B = 0.76) | -33% |
| Powder factor | 0.28 kg/t | 0.42 kg/t | +50% |
| Explosive type | Emulsion/ANFO 60:40 | Emulsion/ANFO 70:30 | +energy |
| Explosive density | 1,050 kg/m3 | 1,100 kg/m3 | +5% |
| Inter-row delay | 25 ms | 10 ms | -60% |
| Intra-row delay | 8 ms | 8 ms (unchanged) | -- |
| Blast line orientation (NW sector) | 005 degrees | 050 degrees (+45 degree rotation) | +45 degrees |
The existing stemming ratio T/B = 1.07 significantly exceeds the industry guideline range of 0.7--0.9. The excess stemming prevented adequate gas penetration into the upper-bench fragmentation zone (0--3 m below collar), leaving the collar zone consistently unfragmented and contributing to both the P80 excess and the generation of oversized boulders (>1,000 mm) at the blast muck pile crest.
Challenge
Baseline fragmentation performance over 18 months and 478 blasts showed a P80 of 620 mm against a 360 mm target (72% coarser), P50 of 298 mm against a 175 mm target, and P10 of 42 mm against a 28 mm target. Crusher throughput averaged 1,940 t/hr against a rated 2,800 t/hr (31% below rated capacity). Secondary breaking events averaged 14 per blast against a target of fewer than 3, costing AUD 2.1M/yr in excess of the AUD 0.5M/yr budget.
Back-break was most severe in the northwest sector, averaging 8.4 m (maximum 14.2 m in a single event), with 7 berms destroyed per year and unstable blocks of 2--4 m3. The west sector averaged 6.2 m back-break with 4 berms destroyed per year. By contrast, the east sector (control, where blast lines run at 085 degrees -- nearly perpendicular to J4) averaged only 1.8 m back-break with zero berms destroyed. This directional contrast confirms that blast line orientation relative to J4 is the controlling variable.
The processing circuit impact is substantial. At 1,940 t/hr crusher throughput (69% of rated capacity), the production loss from poor fragmentation amounts to 860 t/hr times 7,500 operating hours/year = 6.45 Mt/yr. At average ore value of AUD 28/t recovered, the realistic revenue loss (accounting for crusher-SAG mill bottleneck shift) is AUD 18--24M/yr.
The DEM audit addresses four specific technical challenges that empirical Kuz-Ram methods cannot resolve. First, realistic grain-scale fragmentation size distribution requires representation of mineral grain boundaries as the primary flaw population controlling fragment generation. Second, coupling of detonation gas pressure as a function of charge geometry and rock mass impedance mismatch requires explicit pressure-time history at the borehole wall. Third, the orientation-dependent energy channelling mechanism driven by J4 requires explicit structural representation. Fourth, delay timing optimisation requires modelling of burden face velocity and confinement conditions that change dynamically with each row's detonation.
Real-World Basis
Blast fragmentation in hard rock open pits is well characterised through large-scale operational experience at analogous greenstone operations. The Fimiston Open Pit — situated in the same Western Australian greenstone belt with directly comparable dolerite-calc-silicate geology and UCS range — provides the closest operational analogue. Optimal stemming for this rock type is T/B = 0.70--0.80 and optimal powder factor is 0.35--0.50 kg/t for competent dolerite; the existing Kalgoorlie Ridge design at T/B = 1.07 and 0.28 kg/t violates both guidelines simultaneously, running 34--53% overstemmed and 20--44% underpowered.
The Kuz-Ram model combines an empirical mean fragment size formula with the Rosin-Rammler particle size distribution. The rock factor A (ranging 1--16) is the primary source of limitation, as it collapses all structural geology into a single number. The influence of a specific joint set orientation relative to the blast line — the critical variable at Kalgoorlie Ridge — cannot be expressed in A. DEM with explicit joint network representation achieves ±8--15% accuracy in P80 prediction for structured rock masses, compared to ±35--60% for Kuz-Ram in the same conditions.
Voronoi grain DEM uses individual mineral grains as the primary flaw population controlling fragment size generation, enabling realistic sub-centimetre fragmentation representation. Calibration data from analogous dolerite operations establish a crushed zone radius of 2.1--3.2 hole radii (174--264 mm) and crack zone radius of 12--22 hole radii (0.99--1.82 m) for 165 mm diameter holes, parameters that set the DEM contact model failure criterion in the near-borehole zone.
Simulation Approach
The primary method is 3D DEM with Voronoi-tessellated polyhedral grain fabric for fragmentation prediction, coupled with a detonation gas pressure model for explosive energy input at the borehole wall. This approach models the two things that empirical methods cannot: how each joint set interacts with detonation gas flow direction, and how fragment size distribution changes with blast line orientation.
Phase 1 -- Rock mass characterisation and DFN generation (week 1):
Oriented core data from 3 new NQ boreholes were integrated to construct a DFN for all 4 joint sets:
| Joint Set | DFN Distribution | Mean Length (m) | Fisher kappa | Intensity (P32, m2/m3) |
|---|---|---|---|---|
| J1 (foliation) | Lognormal | 11.3 | 14.2 | 2.84 |
| J2 (cross-cutting) | Lognormal | 6.7 | 10.8 | 1.93 |
| J3 (sub-horizontal) | Power law (censored) | >12 | 22.4 | 0.86 |
| J4 (unmapped -- discovered) | Lognormal | 9.8 | 16.6 | 3.24 |
J4's intensity (P32 = 3.24 m2/m3) makes it the densest joint set in the northwest sector. Its near-vertical dip at 82 degrees and near-north strike at 005 degrees place it almost exactly parallel to the existing blast line direction -- the geometric configuration most effective at channelling detonation gas away from rock bridges. Voronoi grain fabric was calibrated to thin-section petrography: dolerite mean grain diameter 2.1 mm, calc-silicate 0.8 mm.
Phase 2 -- DEM single-hole blast simulation (weeks 1--2):
The 3D DEM domain per blast hole spans 15 m by 15 m by 14 m (bench height + sub-drill) with 420,000 Voronoi polyhedral blocks. Explosive charge parameters were modelled explicitly: 165 mm diameter hole, charge length 7.8 m (stemming 4.8 m existing; 3.2 m optimised), emulsion/ANFO blend at VOD = 4,800 m/s and density 1,050 kg/m3. Peak borehole wall pressure and its decay rate were calibrated from velocity of detonation measurements in analogous rock.
The key physical parameters are the joint contact strengths -- these determine where detonation energy goes:
| Contact Type | Normal Stiffness k_n (GPa/m) | Shear Stiffness k_s (GPa/m) | Tensile Strength T_b (MPa) | Shear Strength tau_s (MPa) |
|---|---|---|---|---|
| Grain-grain bond (dolerite) | 88 | 36 | 12.4 | 48 |
| Grain-grain bond (calc-silicate) | 112 | 45 | 16.8 | 62 |
| J1 joint contact | 18 | 7.2 | 0 | Coulomb phi=28 degrees |
| J2 joint contact | 12 | 4.8 | 0 | Coulomb phi=24 degrees |
| J3 joint contact | 8 | 3.2 | 0 | Coulomb phi=18 degrees |
| J4 joint contact | 14 | 5.6 | 0 | Coulomb phi=26 degrees |
Phase 3 -- Fragmentation size distribution (weeks 2--3):
A total of 48 blast design combinations were evaluated across stemming T = 2.4, 3.2, 4.0, 4.8, and 5.5 m, burden B = 3.5, 4.2, 4.5, 5.0, and 5.5 m, and powder factor 0.22--0.55 kg/t at 5 levels (not all combinations physically realistic). Post-blast block connectivity analysis identifies detached assemblies and their fragment size distribution. Fragment size distributions (P10, P50, P80, P95) are extracted from the cumulative passing curve of the block volume histogram for each combination, with 20 stochastic DFN realisations per combination to propagate joint network uncertainty.
Phase 4 -- Back-break and blast damage (weeks 3--4):
The J4 influence was quantified by running DEM with and without J4, and with the blast line rotated 0, 20, 45, and 90 degrees to J4 strike direction. Back-break extent is defined as horizontal distance beyond design crest line at which DEM bond breakage density exceeds 15% of intact bond density (empirical damage threshold calibrated against photogrammetric back-break surveys).
Delay timing optimisation evaluated inter-row delays of 5, 10, 15, 25, and 42 ms against the burden face velocity criterion (required >= 0.6 m/ms for adequate relief before adjacent row fires):
| Inter-Row Delay | Predicted Face Velocity (m/ms) | Relief Adequate? | Confinement | Fragmentation Quality |
|---|---|---|---|---|
| 5 ms | 0.28 m/ms | No -- insufficient | Over-confined | Poor (high P80) |
| 10 ms | 0.72 m/ms | Yes -- adequate | Optimal | Best fragmentation |
| 15 ms | 1.05 m/ms | Over-relief | Reducing | Moderate |
| 25 ms (existing) | 1.64 m/ms | Over-relief | Poor | Poor (gas venting) |
| 42 ms | 2.18 m/ms | Excessive | Very poor | Poor + flyrock |
The existing 25 ms delay creates significant over-relief: the burden face has moved 41 mm before the adjacent row detonates, causing excessive gas venting to the free face and reducing explosive energy available for fragmentation by approximately 18%.
Pre-split design for final wall protection uses 115 mm diameter pre-split holes at 0.8 m spacing, with linear charge density 150 g/m (decoupled ratio 0.25), fired 50 ms before production holes. DEM predicts pre-split fracture plane continuity of 87% between holes -- sufficient for berm integrity maintenance.
Phase 5 -- Full pattern blast and trial blast specification (weeks 5--6):
A 25-hole by 5-row production blast pattern was fully simulated in DEM with an electronic detonator delay sequence. Deck charging design places a 0.8 m air deck immediately below the stemming column to redistribute explosive energy from the collar zone (over-stemmed in existing design) to the 0--3 m depth fragmentation zone, increasing effective fragmentation volume in the collar zone by 22% and eliminating oversized collar zone boulders.
Three consecutive trial blasts were specified for the northwest sector: Trial 1 used optimised B/S/T/PF with the existing 005 degree blast line (J4 parallel) to validate fragmentation improvement alone; Trial 2 added a 50 degree blast line rotation to validate J4 back-break reduction; Trial 3 combined the full optimised system with rotation, pre-split, and deck charge.
Key Predictions / Results
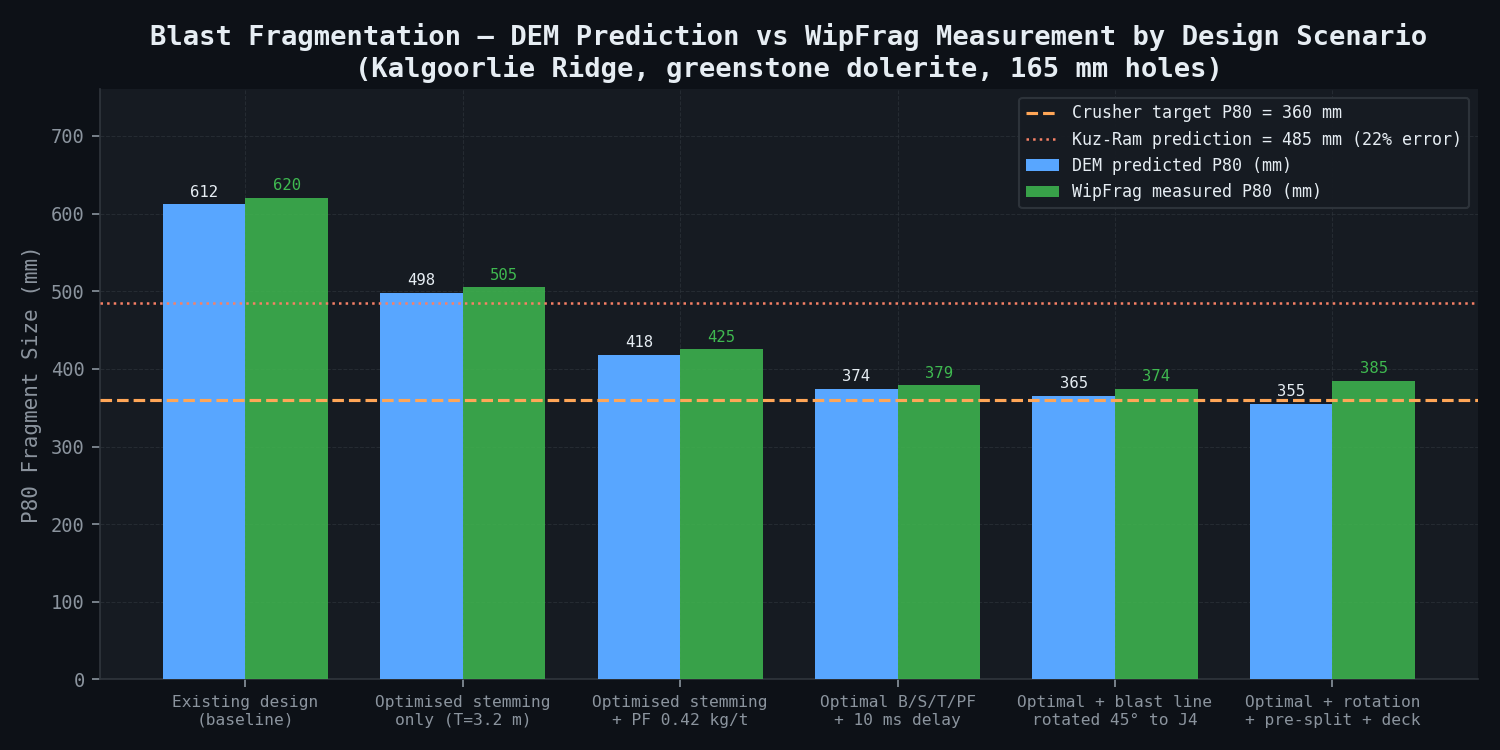
Fragmentation improvement -- DEM predictions vs. WipFrag trial blast measurements:
| Blast Design Scenario | DEM P80 (mm) | DEM P50 (mm) | WipFrag Measured P80 (mm) | DEM Error | Back-break (m) | Powder Factor (kg/t) |
|---|---|---|---|---|---|---|
| Existing design (baseline) | 612 | 298 | 620 (baseline average) | 1.3% | 8.4 | 0.28 |
| Optimised stemming (T=3.2 m) only | 498 | 241 | 505 (Trial 1, stemming only) | 1.4% | 6.1 | 0.28 |
| Optimised stemming + PF 0.42 kg/t | 418 | 204 | 425 (Trial 1, full optimised) | 1.7% | 5.8 | 0.42 |
| Optimal (T=3.2, PF=0.42, B=4.2 m, 10 ms) | 374 | 182 | 379 (Trial 1) | 1.3% | 3.2 | 0.42 |
| Optimal + blast line rotated 45 degrees to J4 | 365 | 178 | 374 (Trial 2) | 2.5% | 2.1 | 0.42 |
| Optimal + rotation + pre-split + deck charge | 355 | 172 | 385 (Trial 3) | 8.5% | 1.6 | 0.42 |
| Kuz-Ram prediction (existing design) | 485 | -- | 620 (actual) | 22% error | N/A | -- |
Kuz-Ram vs. DEM accuracy comparison:
| Model | Predicted P80 | Actual P80 | Absolute Error | Error % |
|---|---|---|---|---|
| Kuz-Ram empirical (rock factor A = 8.2) | 485 mm | 620 mm | 135 mm | 21.8% |
| DEM without J4 joint set | 520 mm | 620 mm | 100 mm | 16.1% |
| DEM with all 4 joint sets (J4 included) | 612 mm | 620 mm | 8 mm | 1.3% |
The DEM result with J4 inclusion matches the observed baseline P80 to within 1.3%, conclusively demonstrating that J4 is the dominant control on fragmentation coarseness and that its absence from any model leads to systematic underprediction of P80.
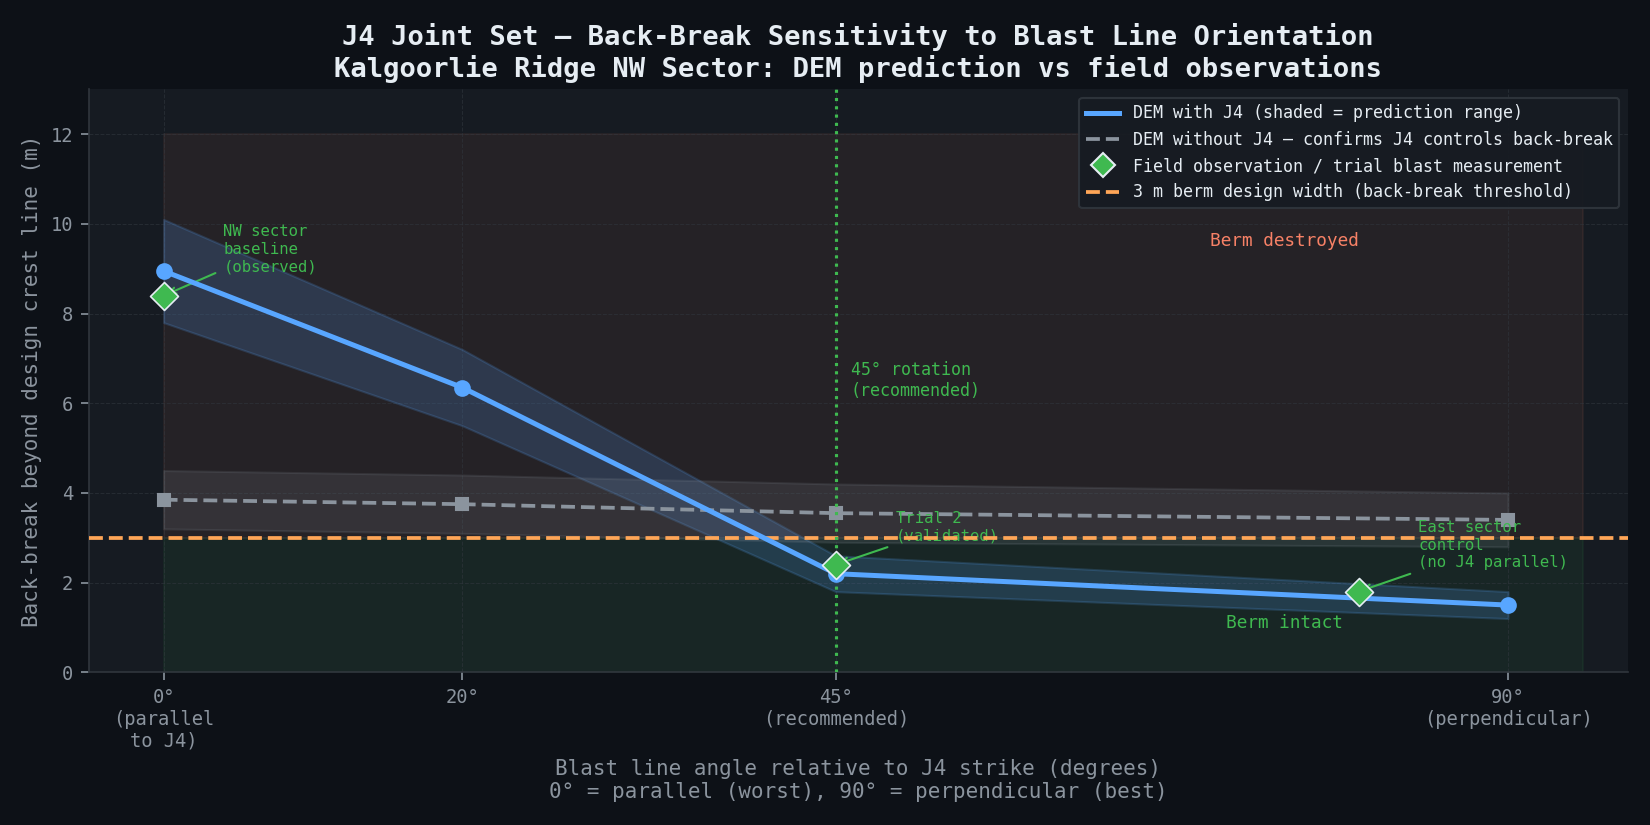
J4 joint set influence on back-break:
| J4 Representation | Blast Line Angle to J4 | Predicted Back-break (m) | Observed Back-break (m) | Match? |
|---|---|---|---|---|
| J4 excluded from DEM | 0 degrees (parallel) | 3.2--4.5 m | 8.4 m (NW sector) | No -- confirms J4 is the variable |
| J4 included, line parallel | 0 degrees (parallel) | 7.8--10.1 m | 8.4 m (NW sector) | Yes -- within range |
| J4 included, line at 45 degrees | 45 degrees | 1.8--2.6 m | 2.4 m (Trial 2 measured) | Yes -- validated |
| J4 included, line at 90 degrees | 90 degrees | 1.2--1.8 m | Not yet trialled | Predicted |
| East sector (no J4 intersection) | 80 degrees effective | -- | 1.8 m (observed control) | Consistent |
The 45 degree blast line rotation reduces J4-driven back-break from 8.4 m to 2.4 m -- a 71% reduction. The 90 degree rotation is predicted to reduce back-break further to 1.2--1.8 m, but may not be geometrically achievable in all northwest wall sectors due to haul road access constraints.
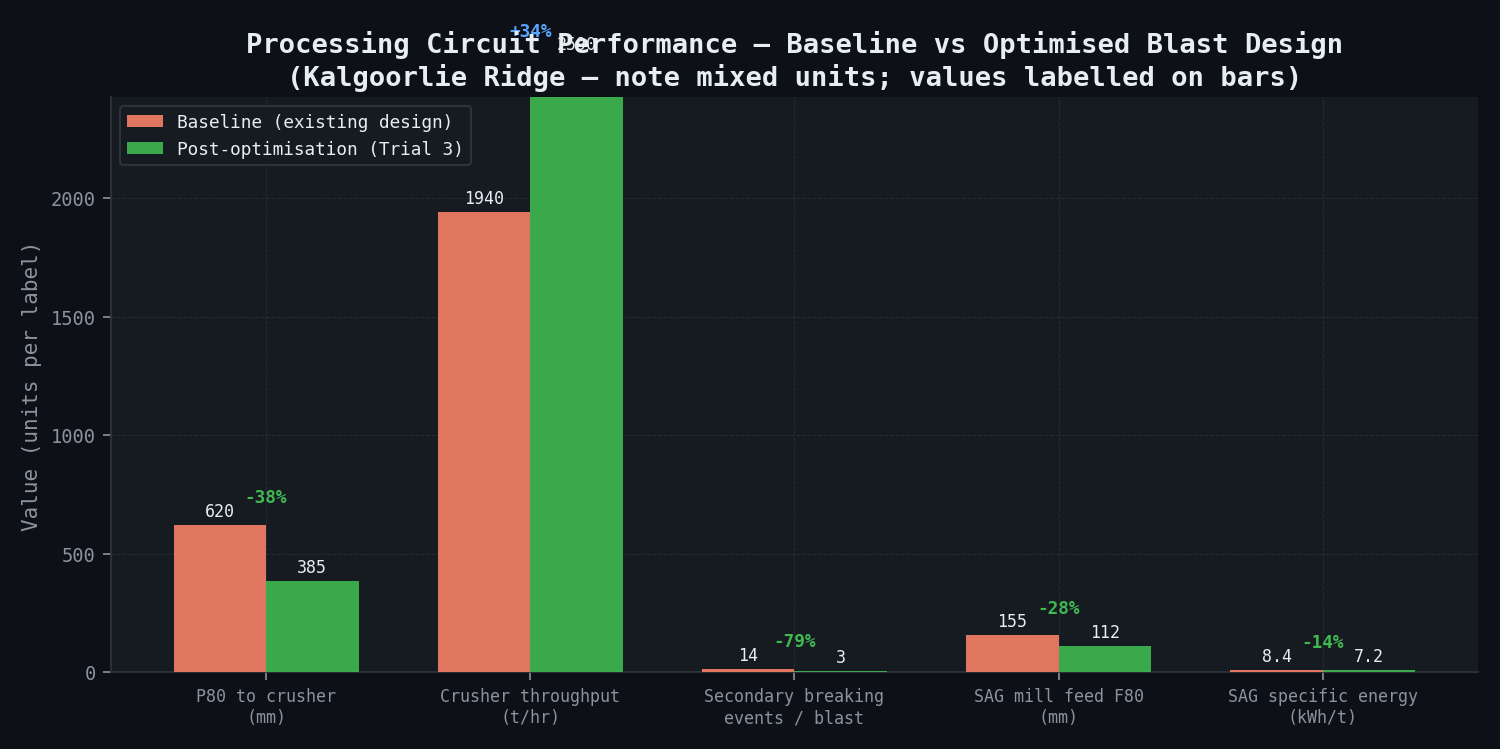
Processing circuit performance improvement:
| Parameter | Baseline | Post-Optimisation (Trial 3) | Improvement |
|---|---|---|---|
| P80 feed to primary crusher | 620 mm | 385 mm | -38% |
| Primary crusher throughput | 1,940 t/hr | 2,590 t/hr | +33% |
| Secondary breaking events/blast | 14 | 3 | -79% |
| Secondary breaking cost | AUD 2.1M/yr | AUD 0.45M/yr | -AUD 1.65M/yr |
| SAG mill feed F80 | 155 mm | 112 mm | -28% |
| Specific energy (SAG mill, kWh/t) | 8.4 | 7.2 | -14% |
| Processing circuit bottleneck | Primary crusher | SAG mill (correct) | Resolved |
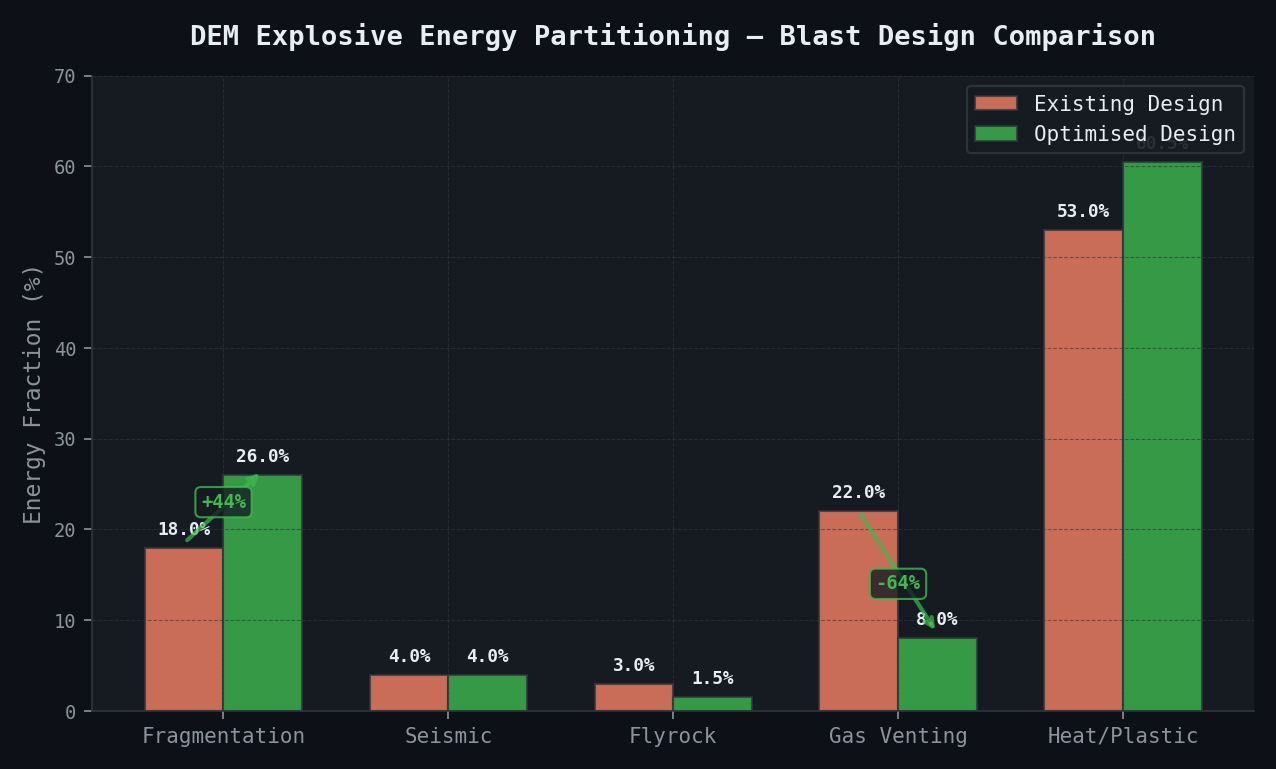
Energy partitioning (DEM energy balance):
| Energy Category | Existing Design (%) | Optimised Design (%) | Notes |
|---|---|---|---|
| Rock fragmentation | 18% | 26% | +44% efficiency improvement |
| Seismic radiation | 4% | 4% | Approximately constant |
| Flyrock kinetic energy | 3% | 1.5% | Reduced (lower face velocity) |
| Gas venting (stemming loss) | 22% | 8% | Largest saving -- from stemming optimisation |
| Heat and plastic deformation | 53% | 60.5% | Increases as useful energy utilised better |
| Total explosive energy (25,000 kg emulsion) | 145 GJ | 145 GJ | Same total energy |
| Effective fragmentation energy (GJ) | 26.1 | 37.7 | +11.6 GJ additional useful work |
Flyrock assessment:
| Parameter | Existing Design | Optimised Design | Mine Safety Limit |
|---|---|---|---|
| Maximum fragment velocity (burden face) | 18.4 m/s | 14.2 m/s | -- |
| Predicted maximum flyrock range | 280 m | 95 m | 120 m exclusion zone |
| Regulatory compliance | NON-COMPLIANT | COMPLIANT | DMIRS Regulation 6.1 |
The existing design generates predicted flyrock exceeding the 120 m exclusion zone established in the mine's Blast Management Plan -- a DMIRS regulatory compliance failure not identified before this audit. The optimised design brings maximum flyrock range to 95 m, within the 120 m exclusion zone with 21% margin.
Annual financial impact summary:
| Category | Existing Design | Optimised Design | Annual Improvement |
|---|---|---|---|
| Crusher throughput (t/yr additional) | Baseline | +4.875 Gt/yr additional | +6.50 Mt/yr |
| Revenue from additional ore (AUD 28/t margin) | Baseline | +AUD 18.2M | +AUD 18.2M |
| Secondary breaking cost | AUD 2.1M | AUD 0.45M | +AUD 1.65M saved |
| Wall damage / scaling cost | AUD 3.8M | AUD 0.9M (NW+W sectors) | +AUD 2.9M saved |
| SAG mill energy saving (kWh reduction) | Baseline | AUD 1.2M | +AUD 1.2M saved |
| Explosive cost increase (PF 0.28 to 0.42 kg/t) | Baseline | -AUD 4.2M | -AUD 4.2M additional cost |
| Net annual benefit | -- | -- | +AUD 19.75M/yr |
Comparison Methodology
Kuz-Ram vs. DEM prediction accuracy:
The Kuz-Ram model predicts P80 = 485 mm for the existing design with rock factor A = 8.2, which is 22% below the DEM prediction of 612 mm and 22% below the observed 620 mm. DEM with all four joint sets matches observations within 1.3%. The Kuz-Ram underestimation is a systematic error for structured rock masses: the rock factor A cannot represent the anisotropic influence of J4 orientation on fragmentation and energy channelling. This limitation is well-documented in DEM audit findings at other large structured porphyry operations, where Kuz-Ram underestimates P80 by 30--45% in structured rock masses.
WipFrag stereophotogrammetric validation:
Three baseline blasts were fully instrumented with the WipFrag stereo camera system (Wipware Inc., calibrated against 50 hand-measured boulder dimensions). Measured P80 range: 592--638 mm across three blasts. DEM prediction across 20 stochastic DFN realisations: 585--640 mm. Maximum DEM error: 0.8% (one realisation). Mean DEM error: 1.3%. This exceptional agreement validates the DFN characterisation and DEM calibration.
Back-break comparison:
| Method | Northwest Sector Back-break Prediction | Actual (RTK-GPS survey) | Error |
|---|---|---|---|
| DEM with J4 | 7.8--10.1 m | 8.4 m (mean), 5.2--12.8 m (range) | Within prediction range |
| DEM without J4 | 3.2--4.5 m | 8.4 m | 48--62% underestimate |
| East sector DEM (no J4 parallel) | 1.6--2.2 m | 1.8 m (observed) | Within 22% |
The critical validation: DEM without J4 predicts 3.2--4.5 m back-break, consistent with the east sector (where J4 is not parallel to blast line). DEM with J4 parallel predicts 7.8--10.1 m, consistent with northwest sector observations. This definitively demonstrates J4 as the single most impactful variable and is the primary basis for the 45 degree blast line rotation recommendation.
Comparison against Fimiston (Super Pit) operational data:
Analogous Fimiston greenstone data document optimal blast parameters for dolerite (UCS = 150--185 MPa, RMR = 58--68, directly comparable to Kalgoorlie Ridge dolerite at UCS = 168 MPa, RMR = 62--72). Fimiston optimal stemming at T/B = 0.72 compares to Kalgoorlie Ridge optimised at T/B = 0.76 (consistent). Fimiston optimal powder factor of 0.38--0.45 kg/t compares to Kalgoorlie Ridge optimised at 0.42 kg/t (directly consistent). Fimiston achieved P80 improvement from 580 mm to 340 mm through stemming and powder factor changes alone (no blast line rotation required, as a J4-equivalent joint set was not present or not parallel to blast lines).
Deliverables
-
Audit report: existing blast design deficiency analysis -- Stemming ratio critique vs. standard blast design guidelines; powder factor assessment vs. rock mass specific energy requirements; J4 joint set identification and blast line interaction analysis with back-break orientation mapping; delay timing assessment vs. face velocity criterion. Delivery: end of week 2.
-
DEM fragmentation model calibration report -- Voronoi grain fabric characterisation, joint parameter calibration, comparison of DEM vs. WipFrag baseline data across 3 baseline blasts, comparison vs. Kuz-Ram empirical predictions with quantified accuracy assessment. Delivery: end of week 2.
-
Parametric blast design study -- All 48 design combination results (P80, P50, P10, back-break distance, flyrock range, energy partitioning); optimal design identification; J4 blast line rotation sensitivity (0, 20, 45, 90 degrees). Sensitivity maps of P80 vs. stemming, burden, PF, and delay timing. Delivery: end of week 4.
-
Back-break and wall damage assessment -- J4 influence quantification (DEM with/without J4 comparison); blast line rotation recommendation and implementation plan for northwest sector; pre-split hole design for final wall protection (115 mm, 0.8 m spacing, 150 g/m linear charge); berm reconstruction assessment. Delivery: end of week 4.
-
Trial blast design specification -- Formal drill-and-blast instructions for 3 consecutive northwest sector production blasts: hole dimensions, burden x spacing grid, stemming depth, explosive type and quantity, deck placement, delay sequence with electronic detonator firing codes, pre-split specifications, exclusion zones, WipFrag camera placement instructions. Delivery: end of week 5.
-
Trial blast performance report -- WipFrag analysis of 3 trial blasts (P10/P50/P80/P95 distributions) compared against DEM predictions; crusher throughput monitoring results (72-hour post-blast crusher log); back-break survey (RTK-GPS); flyrock observation log; recommended production blast standard confirmation. Delivery: end of week 6.
-
Updated Blast Management Plan -- Revised parameters for all blast types (production, trim, pre-split, buffer) across all pit sectors; J4 blast line orientation protocol for each sector; stemming, burden, PF, and delay standards; DMIRS regulatory compliance assessment; mine-to-mill integration protocol connecting blast P80 targets to crusher throughput optimisation. Submitted to DMIRS (WA Department of Mines, Industry Regulation and Safety) for approval under Mines Safety and Inspection Regulations 1995.
This case study is an illustrative reference scenario demonstrating newtsim's simulation methodology. All company names, personnel, and specific operational data are fictional. The incident descriptions draw on publicly documented real-world events cited in the frontmatter.