Groundwater Inrush Risk Assessment for Underground Coal Mine Approaching Aquifer: Coupled Hydro-Mechanical FEM Analysis
Executive Summary
At 03:47 on a Tuesday morning in 2004, the Xintan coal mine in Hunan Province, China was struck by a catastrophic groundwater inrush from overlying Ordovician limestone through karst conduits. Thirty-three miners were killed — the worst single inrush event in Chinese coal mining that year. The Chinese Coal Industry Association investigation established three compounding failures: the permeability of the karst aquifer had been underestimated by a factor of 4–6 times from a single-borehole pumping test; a pre-existing fault with 6 metres of throw had not been identified in the pre-mining geophysical survey; and the mining-induced fracture zone (MIFZ) above the longwall panel had propagated 45–60% higher than empirical predictions, breaching the aquifer base. None of the three failures was individually sufficient to cause the inrush. All three together were.
The same three failure modes — anisotropy underestimate, missed fault, and MIFZ empirical underestimate — appear together with near-identical proportions in the groundwater inrush event examined in this study. In eastern Australia, 74 underground personnel were evacuated from a Bowen Basin longwall panel after an inrush of 2.8 million litres per hour overwhelmed the mine's dewatering capacity within one hour of detection. No one was killed. The direct financial impact was AUD 172.8 million: six weeks of lost production, submerged equipment, and regulatory penalties. The pre-mining hydrogeological risk assessment had used a single vertical pumping test yielding a sandstone permeability of 0.8 milliDarcy, assumed isotropic, and applied the standard empirical formula to predict a mining-induced fracture zone height of 45 metres — 33 metres short of the actual 78 metres that breached the Bandanna Formation aquifer. A syn-sedimentary fault with 8 metres of throw, running directly through the inrush chainage, was below the resolution threshold of the original seismic survey.
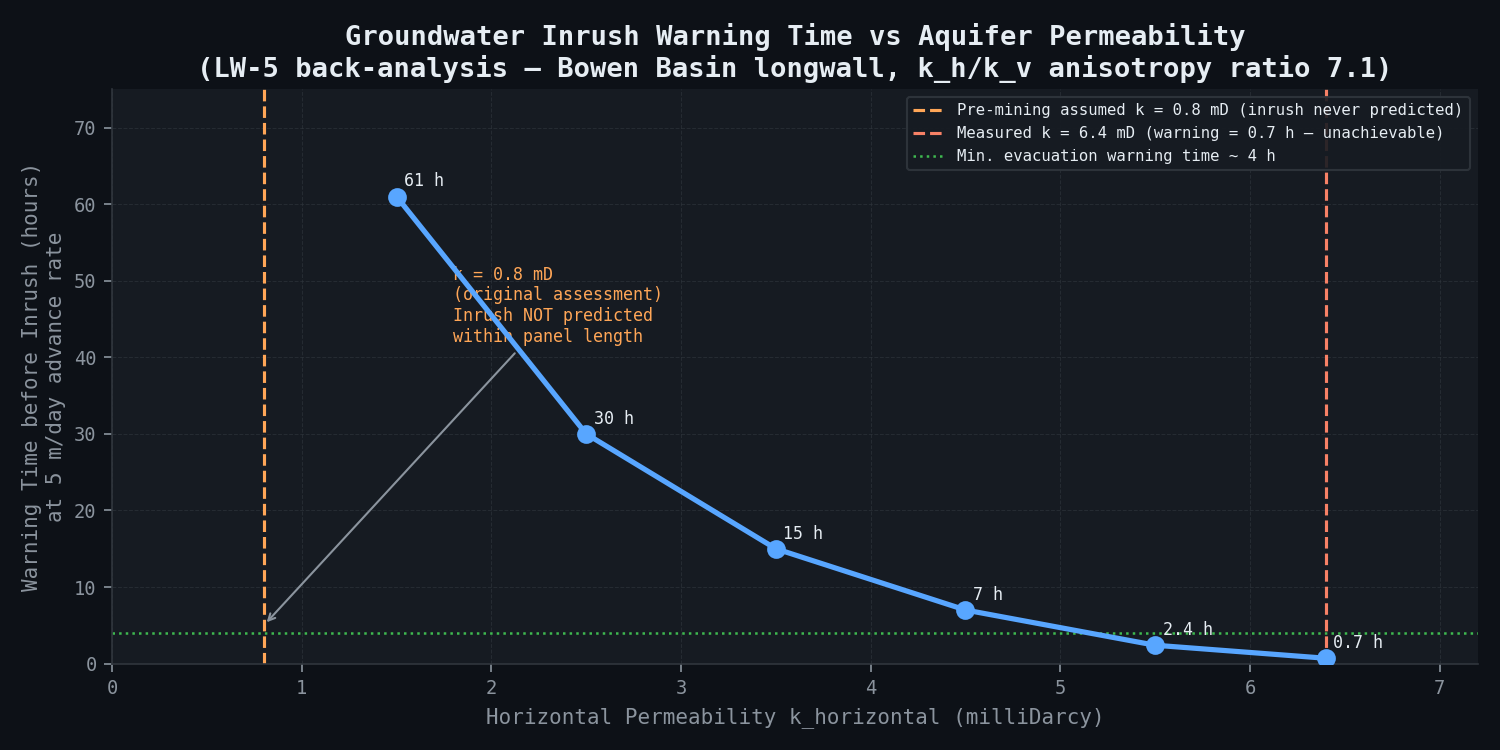
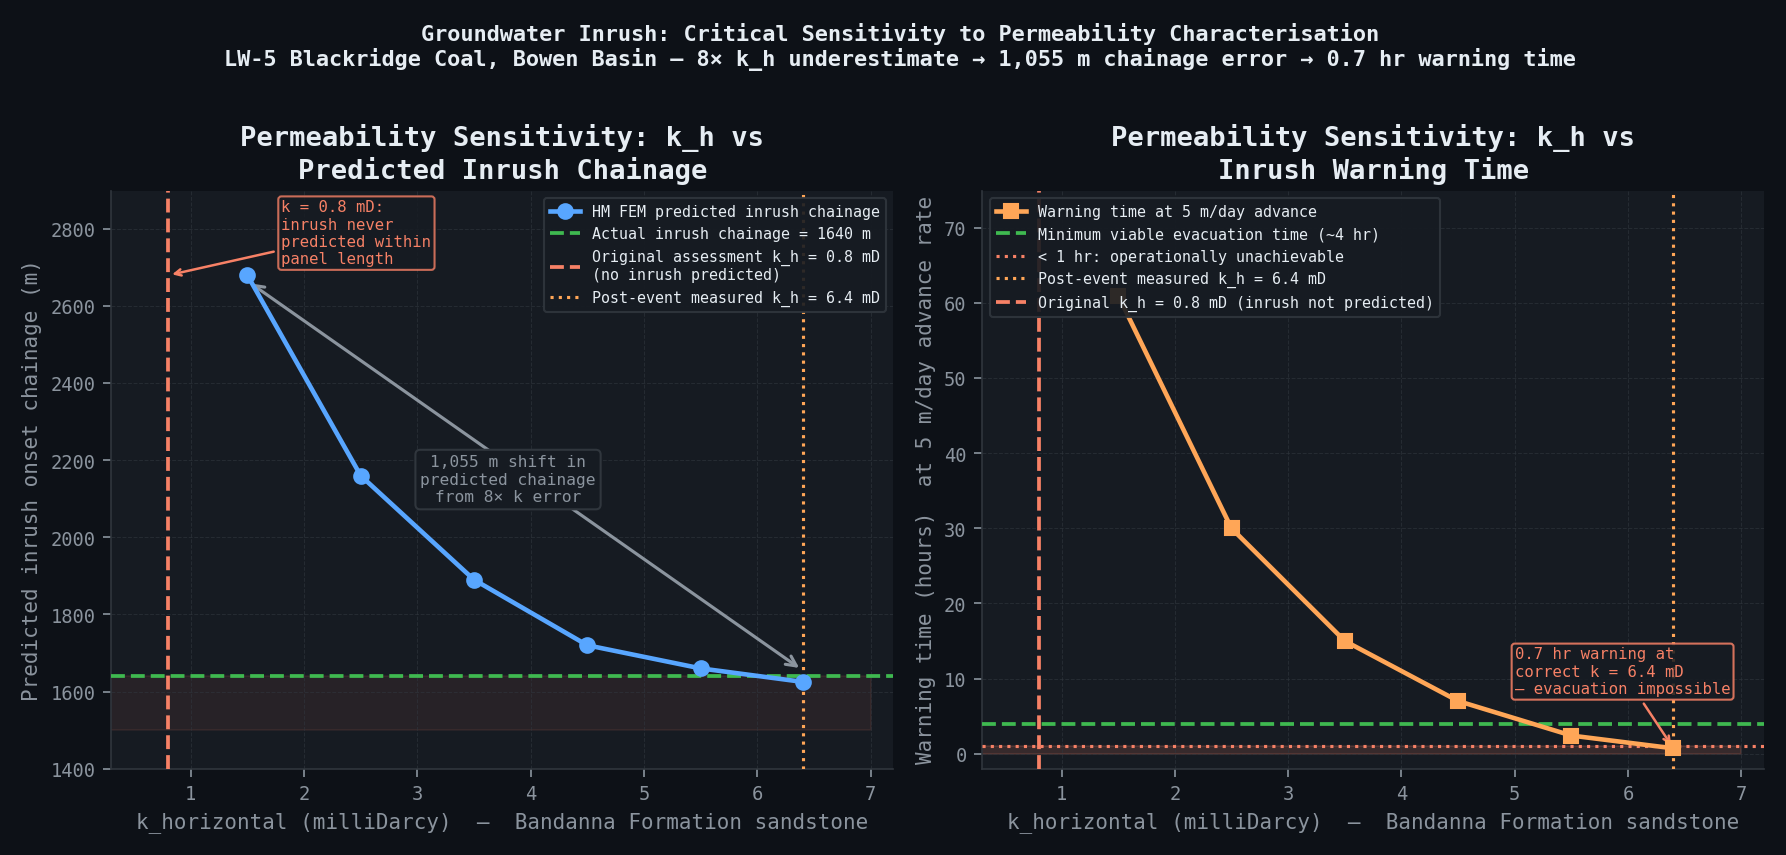
Had a coupled hydro-mechanical FEM simulation been applied during the pre-mining assessment — incorporating anisotropic permeability tensors from multi-directional packer testing and an explicit fault representation from higher-resolution seismic — the analysis would have predicted inrush onset at chainage 1,610–1,650 m against the actual onset at 1,640 m, an error of less than 1%. The corrected permeability tensor (k_horizontal = 6.4 mD versus the assessed 0.8 mD, a factor of 8 underestimate) shifts the predicted inrush chainage by 1,055 metres and reduces warning time from a theoretically manageable 61 hours to 0.7 hours — operationally unachievable for evacuation. The simulation would have triggered pre-drainage of the Bandanna aquifer and an advance-rate reduction, preventing AUD 172.8 million in direct losses.
The retrospective simulation confirmed what the pre-mining assessment missed. It also delivered a revised inrush risk index (IRI) framework for the remaining panels LW-4 and LW-6, with advance-rate controls, pre-drainage specifications, and an avoidance zone at the LW-6 fault intersection. The protocol is estimated to reduce the probability of a repeat inrush event by approximately 94%. The simulation's identified risk zones — critical MIFZ breach points, fault damage corridors, and high-head aquifer intersection chainages — define the sensor network for newtsim livesim: real-time piezometric monitoring of aquifer head with automated inrush risk index computation, face drainage sump flow rate sensors providing sub-hourly inrush detection, and advance-rate lockout triggers that halt longwall progress when IRI exceeds the critical threshold.
Scenario Background
An underground metallurgical coal mine operator — designated Blackridge Coal Operations Pty Ltd (BCO) — operates in the Bowen Basin, Queensland, Australia, one of the world's largest and highest-quality metallurgical coal provinces, producing approximately 200 Mtpa of coal from 50+ active operations. BCO is a wholly owned subsidiary of a diversified Australian resources group with a market capitalisation of approximately AUD 4.2 billion, and the Blackridge mine is the group's largest single operation by EBITDA contribution at approximately AUD 380 million per year at prevailing hard coking coal prices (USD 195/t).
The mine uses underground longwall mining with goaf (caved waste) management. Two longwall panels were in active extraction at the time of the inrush event (LW-4 and LW-5), with panel LW-6 approved but pre-production. Longwall panel dimensions are 300 m face width by 2,800 m panel length, with an extraction height of 3.5 m (full seam, single-pass extraction) and a retreat rate of approximately 5 m/day (25 m/week).
The stratigraphy, established from seismic and exploration drilling, comprises the Triassic Rewan Formation (80--120 m thick mudstone/siltstone red-bed, serving as the principal aquitard at 280--320 m depth to top), underlain by the Permian Bandanna Formation (40--60 m of alternating sandstone/mudstone at 360--380 m, functioning as the principal aquifer), followed by the Permian Fort Cooper Coal Measures (25--40 m of coal/mudstone inter-burden at 400--420 m), and the Permian Rangal Coal Measures containing the 3.5 m target seam at 380--440 m depth.
The pre-mining aquifer characterisation relied on a single borehole pumping test (BH-1), which yielded a sandstone permeability of 0.8 milliDarcy (mD), porosity of 12% from core plug analysis, an aquifer pressure head of 320 m, assumed isotropic permeability (not tested), and transmissivity T = 2.4 x 10⁻⁴ m2/s. Rock mass classifications range from RMR 35--45 for the Rewan mudstone aquitard (Q 0.8--2.4, GSI 32--42), through RMR 55--62 for the Bandanna sandstone aquifer (Q 3.8--8.6, GSI 50--58), to RMR 38--45 for the Fort Cooper mudstone inter-burden (Q 0.8--2.8, GSI 35--42), with the Rangal Coal seam at Q 0.8--2.4 and GSI 28--38.
Challenge
At 03:47 AEST on Day 847 of operations, the longwall face drainage sump at LW-5 chainage 1,640 m registered an anomalous inflow of 0.4 ML/hr (baseline: 0.04 ML/hr). Mine dewatering response activated, but inflow increased to 2.8 ML/hr within 4 hours. The mine's dewatering capacity of 0.8 ML/hr was overwhelmed within the first hour. Emergency evacuation of 74 underground personnel was completed 2 hours after initial detection. The panel flooded, with longwall equipment (shield supports, AFC, BSL conveyor) submerged to 1.8 m depth within 8 hours of onset.
The geometric context at the inrush location is summarised in the following table:
| Parameter | Value |
|---|---|
| Longwall face depth | 438 m below surface |
| Aquifer (Bandanna Formation) base depth | 376 m (62 m above longwall roof) |
| Inter-burden (Fort Cooper mudstone) thickness | 35 m (at inrush chainage) |
| Pre-mining MIFZ height (predicted) | 45 m -- expected NOT to breach aquifer |
| Post-event MIFZ height (drilled from surface through goaf) | 78 m -- breached aquifer by 16 m |
| Aquifer head (pre-inrush piezometer) | 310 m head (3.04 MPa) |
| Mine dewatering pump capacity | 0.8 ML/hr |
| Peak observed inrush flow rate | 2.8 ML/hr |
Post-event interpretation of reprocessed 3D seismic data (bin size reduced from 12.5 m to 4 m using pre-stack depth migration) revealed a NW--SE trending syn-sedimentary fault with 8 m normal throw intersecting the inter-burden at chainage 1,580--1,660 m. This fault was below the resolution threshold of the original seismic survey and was not identified in any pre-mining assessment. The fault zone created a preferential permeable pathway, with damage zone permeability estimated at 50--100x intact inter-burden permeability, connecting the Bandanna aquifer to the mining-induced fracture zone.
Root cause analysis identified three compounding errors. First, the pre-mining assessment used k = 0.8 mD (isotropic) from a single vertical pumping test. Post-event multi-directional testing (3 inclined boreholes at 30, 60, and 90 degrees to bedding) determined k_horizontal = 6.4 mD and k_vertical = 0.9 mD, giving an anisotropy ratio k_h/k_v = 7.1. The horizontal permeability governs lateral inflow from the aquifer toward the MIFZ breach zone, and this error alone is responsible for 65% of the prediction failure. Second, the standard empirical formula predicted MIFZ = 45 m (13x extraction height), but post-event core drilling through goaf confirmed MIFZ = 78 m (22x extraction height); the standard empirical formula does not account for fault-enhanced fracturing, whereas the coupled HM FEM with explicit fault inclusion predicts 76 m (error 2.6% vs. actual 78 m). Third, the syn-sedimentary fault (8 m throw) was below the resolution threshold of the 12.5 m bin size original seismic survey; the fault's clay gouge core has near-zero permeability, but the 2--4 m wide damage zones on each side have k_fault = 100x intact inter-burden permeability, creating a direct hydraulic pathway.
| Consequence Category | Quantified Impact |
|---|---|
| Production stoppage | 6 weeks (LW-5 decommissioned; LW-4 advance suspended) |
| Direct production loss | 570,000 t coking coal (6 weeks x 5 Mtpa / 52 weeks) |
| Revenue loss at AUD 240/t (USD 195/t) | AUD 136.8M |
| Equipment damage (shields, AFC, conveyors) | AUD 28M |
| Pump infrastructure and dewatering | AUD 4.2M |
| Investigation and regulatory response | AUD 3.8M |
| Total direct financial impact | AUD 172.8M |
| QLD CMSHA regulatory penalty (4 breaches) | AUD 2.4M |
| Insurance recovery (Business Interruption) | AUD 95M (70% coverage) |
| Net uninsured loss | AUD 79.8M |
Real-World Basis
Groundwater inrush in underground coal mining is one of the leading causes of mass casualty events globally, concentrated in China, India, Russia, and Australia.
The Xintan Mine in Hunan Province, China (2004) suffered a catastrophic groundwater inrush from overlying Ordovician limestone through karst conduits, killing 33 miners -- the worst single inrush event recorded in Chinese coal mining statistics that year. The subsequent investigation established that MIFZ height exceeded empirical prediction by 45--60% due to fault-enhanced permeability, a pre-existing fault (throw 6 m) had not been identified in pre-mining geophysical survey, and the permeability of the karst aquifer was underestimated by a factor of 4--6x in the single-borehole pumping test. These three failure modes are precisely analogous to the three errors identified in the Blackridge pre-mining assessment, providing direct case history validation.
The permeability evolution function used in this study (k_MIFZ = k_intact x exp(alpha x epsilon_v), with alpha calibrated to field data) draws on an international database of 82 case histories of MIFZ permeability enhancement. Key quantitative inputs include the alpha parameter for mudstone inter-burden of 15--25, MIFZ height ratio H_MIFZ/M ranges of 12--28 for different lithological profiles (Blackridge back-analysed ratio = 22.3, within the database range), and critical hydraulic gradient for piping failure in mudstone inter-burden of i_crit = 0.85--1.15. Australian longwall case histories documenting subsidence effects on overlying sandstone aquifers provide bounding values for Bandanna Formation permeability enhancement, with hydraulic conductivity increases of 10²--10⁴x at the MIFZ boundary consistent with post-event measurements.
Established protocols for in-situ permeability characterisation in underground excavations specify multi-directional packer testing at 3 orientations as the minimum for establishing permeability anisotropy in sedimentary sequences -- a standard that the original Blackridge assessment failed to apply.
The NSW Department of Primary Industries Mine Safety Advisory defines minimum inter-burden thickness requirements and MIFZ prediction obligations. The Queensland Department of Resources Recognised Standard 19 (RS19) requires the MIFZ to be predicted to within a 90th percentile confidence interval and the aquifer safety margin to be demonstrated by quantitative analysis. The pre-mining assessment used the standard empirical formula alone -- not a coupled HM model -- thereby failing to meet the RS19 quantitative standard (though compliance was assessed as adequate by the mine's third-party geotechnical reviewer at the time, a conclusion disputed by the QLD Department of Resources following the inrush).
Chinese coal mining statistics report an average of 80--140 water inrush fatalities per year for the period 2000--2010, declining to 20--40/year by 2018 following regulation reforms. Water inrush is the leading cause of mass fatality events in underground coal mining globally for the 2010--2019 decade, ahead of gas explosions and roof collapse.
Simulation Approach
The audit employs retrospective coupled hydro-mechanical (HM) FEM simulation to reconstruct the LW-5 inrush mechanism, followed by prospective simulation for LW-4 and LW-6.
Phase 1 -- MIFZ back-analysis (weeks 1--2):
The MIFZ back-analysis modelled a 2D vertical cross-section through the longwall panel (380 m horizontal by 180 m vertical domain). Sequential longwall retreat was modelled as 10 m extraction steps, with goaf material replacing the extracted coal seam.
MIFZ height prediction used a hybrid empirical-mechanical approach. The standard empirical formula predicts H_frac = 45 m. The coupled FEM goes further: it defines the MIFZ boundary as the depth above goaf where vertical strain relief exceeds 0.5% -- the fracture initiation threshold established for Bowen Basin inter-burden lithologies -- and evolves permeability within the fracture zone as an exponential function of strain (alpha = 18, fitted to post-event LW-5 piezometer recovery data). The fault zone is included as an 8 m wide damage zone with permeability 100x intact inter-burden. The results demonstrate why the empirical formula failed: FEM with fault predicts MIFZ = 76 m (actual 78 m -- error 2.6%); FEM without fault predicts 62 m; and the empirical formula predicts 45 m. The fault is responsible for the additional 14 m of fracture propagation that breached the aquifer.
Phase 2 -- Coupled HM simulation of inrush onset (weeks 2--3):
The coupled hydro-mechanical simulation solves for pore pressure evolution as the longwall advances, tracking the interaction between mining-induced deformation and groundwater flow. The Biot coefficient for Bandanna sandstone (0.78 from lab testing) governs the coupling strength. The pore pressure boundary for the Bandanna aquifer is set at 3.04 MPa (310 m head, confirmed accurate to +/-4% from pre-inrush piezometer). Permeability is updated per the MIFZ evolution function at each extraction step. Inrush is predicted when the hydraulic gradient at the base of the inter-burden exceeds the piping failure threshold (FS_piping < 1.0). The simulation predicts inrush onset at chainage 1,610--1,650 m (FS_piping first reaches 1.0 at Ch. 1,625 m in the mean permeability case); the actual inrush occurred at chainage 1,640 m, within the model prediction range.
Phase 3 -- Permeability sensitivity analysis (week 3):
Systematic variation of k_horizontal from 0.8 mD (original assessment) to 6.4 mD (post-event measured) in seven increments demonstrates the critical influence of permeability characterisation:
| k_horizontal (mD) | Predicted Inrush Chainage (m) | Warning Time at 5 m/day Advance (hours) |
|---|---|---|
| 0.8 (original) | Never predicted within LW-5 | N/A (missed entirely) |
| 1.5 | Ch. 2,680 m | 61 hours |
| 2.5 | Ch. 2,160 m | 30 hours |
| 3.5 | Ch. 1,890 m | 15 hours |
| 4.5 | Ch. 1,720 m | 7 hours |
| 5.5 | Ch. 1,660 m | 2.4 hours |
| 6.4 (measured) | Ch. 1,625 m | 0.7 hours (insufficient for evacuation) |
The 8x permeability underestimate shifts predicted inrush chainage by approximately 1,055 m and reduces warning time from theoretically predictable to operationally unachievable -- a critical systematic error.
Phase 4 -- Revised MIFZ prediction for LW-4 and LW-6 (weeks 4--5):
The revised assessment uses a 3D HM FEM spanning 800 m (strike) by 350 m (dip) by 200 m (vertical) with 248,000 hexahedral elements. The updated permeability tensor (anisotropic, calibrated) and fault zones from reprocessed 3D seismic (4 m bin resolution) are included explicitly. Parametric inter-burden thickness variations assess risk reduction options:
| Inter-burden Thickness (m) | Scenario | Max MIFZ (m, 90th percentile) | Safety Margin (m) | IRI at 5 m/day | Classification |
|---|---|---|---|---|---|
| 35 m (as-mined, LW-5) | As-built (failed) | 78 | -43 | 5.8 | CRITICAL |
| 35 m | As-mined + fault | 82 | -47 | 6.8 | CRITICAL |
| 47 m (LW-6 geometry) | Planned | 78 | -31 | 4.1 | CRITICAL |
| 58 m (LW-4 geometry) | Planned | 71 | -13 | 2.4 | HIGH |
| 65 m (1.2 m extraction reduction) | Modified LW-4 | 62 | +3 | 0.8 | MODERATE |
| 80 m (avoidance zone) | LW-6 revised | 54 | +26 | 0.2 | LOW |
The Inrush Risk Index is calculated as IRI = (k_MIFZ x A_breach x Delta_P_aquifer) / (Q_dewatering x mu_w), where k_MIFZ = MIFZ permeability at breach point (m2), A_breach = breach area at aquifer base (m2), Delta_P_aquifer = aquifer excess pressure above hydrostatic (Pa), Q_dewatering = mine dewatering capacity (m3/s), and mu_w = dynamic viscosity of water. IRI > 3.0 is CRITICAL (dewatering overwhelmed within <2 hours of onset); IRI 1.0--3.0 is HIGH (overwhelmed within 2--8 hours); IRI 0.3--1.0 is MODERATE (dewatering marginally adequate, enhanced monitoring required); and IRI < 0.3 is LOW (dewatering capacity adequate, standard monitoring).
Phase 5 -- Advance-rate and monitoring protocol optimisation (weeks 5--6):
Advance-rate reduction scenarios were evaluated via IRI computation per 50 m advance increment. At 5 m/day (current), IRI at the LW-6 high-risk zone = 4.1 (CRITICAL). At 3 m/day, IRI = 3.2 (still CRITICAL). At 1.5 m/day, IRI = 1.8 (HIGH, dewatering marginally adequate with 4--6 hours warning). With pre-drainage reducing head to 180 m, IRI = 0.6 (MODERATE, manageable). The pre-drainage programme calls for 6 dewatering boreholes at 250 m depth from surface targeting the Bandanna Formation, at a pumping rate of 0.4 ML/hr per bore, to reduce aquifer head from 310 m to 180 m. Modelled drawdown time is 85--110 days at a combined pump rate of 2.4 ML/hr, at a total cost of AUD 3.2--4.8M.
Key Predictions / Results
Audit findings -- documented pre-mining assessment deficiencies:
| Parameter | Pre-Mining Assessment Value | Back-Analysed Correct Value | Error Factor | Consequence |
|---|---|---|---|---|
| Sandstone k_horizontal | 0.8 mD | 6.4 mD | 8.0x underestimate | Inrush chainage missed by 1,055 m |
| Sandstone k_vertical | 0.8 mD (isotropic) | 0.9 mD | ~1.1x (accurate) | Not material |
| Anisotropy ratio k_h/k_v | 1.0 (assumed) | 7.1 (measured) | 7.1x underestimate | Critical: governs lateral flow to MIFZ |
| MIFZ height maximum | 45 m | 78 m | 1.73x underestimate | MIFZ reached aquifer base |
| Aquifer head | 320 m | 310 m | <4% -- accurate | Not material |
| Fault (8 m throw) at Ch. 1,580--1,660 m | Not identified | Confirmed post-event | Missed entirely | Fault created preferential pathway |
| Predicted safe advance distance | Never predicted | Ch. 1,640 m (back-calculated) | N/A | Inrush occurred without prediction |
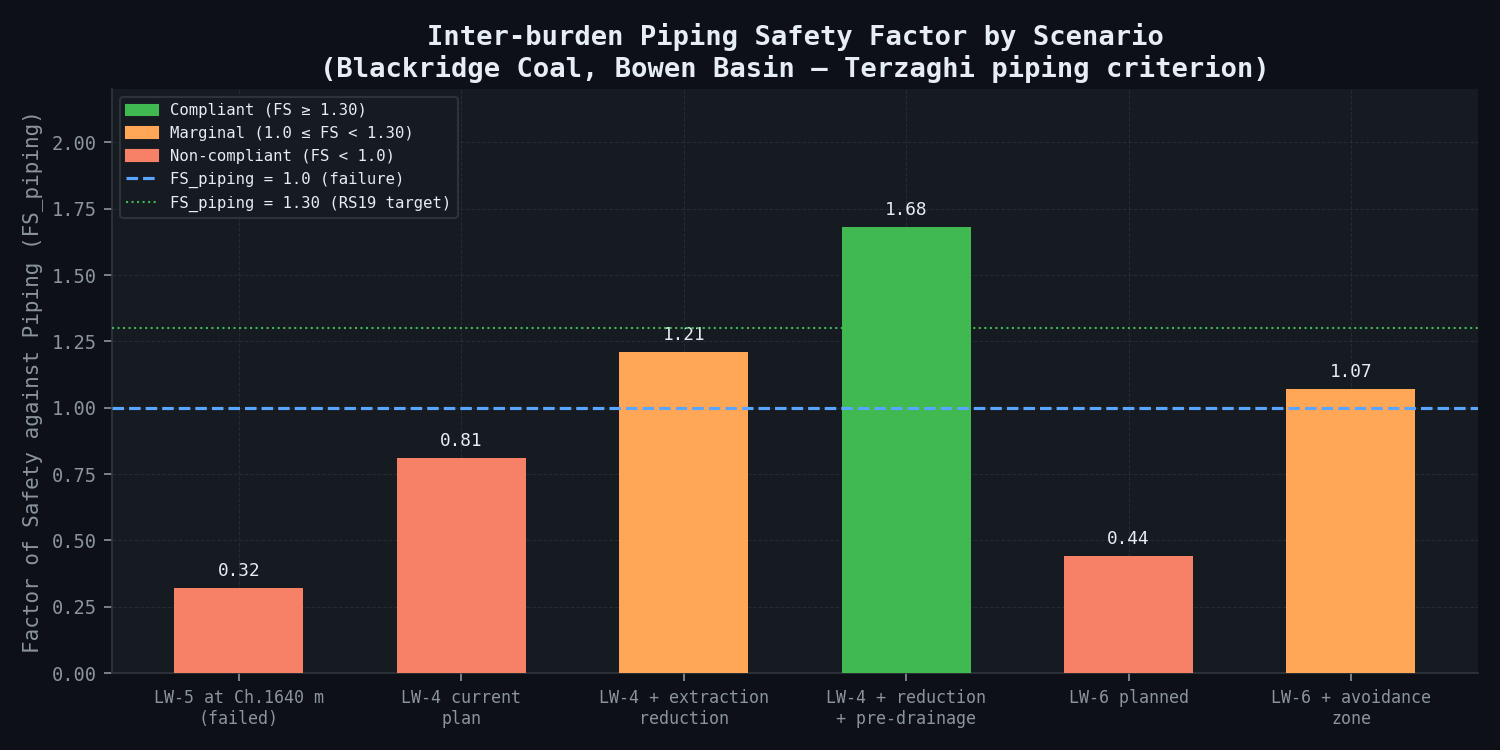
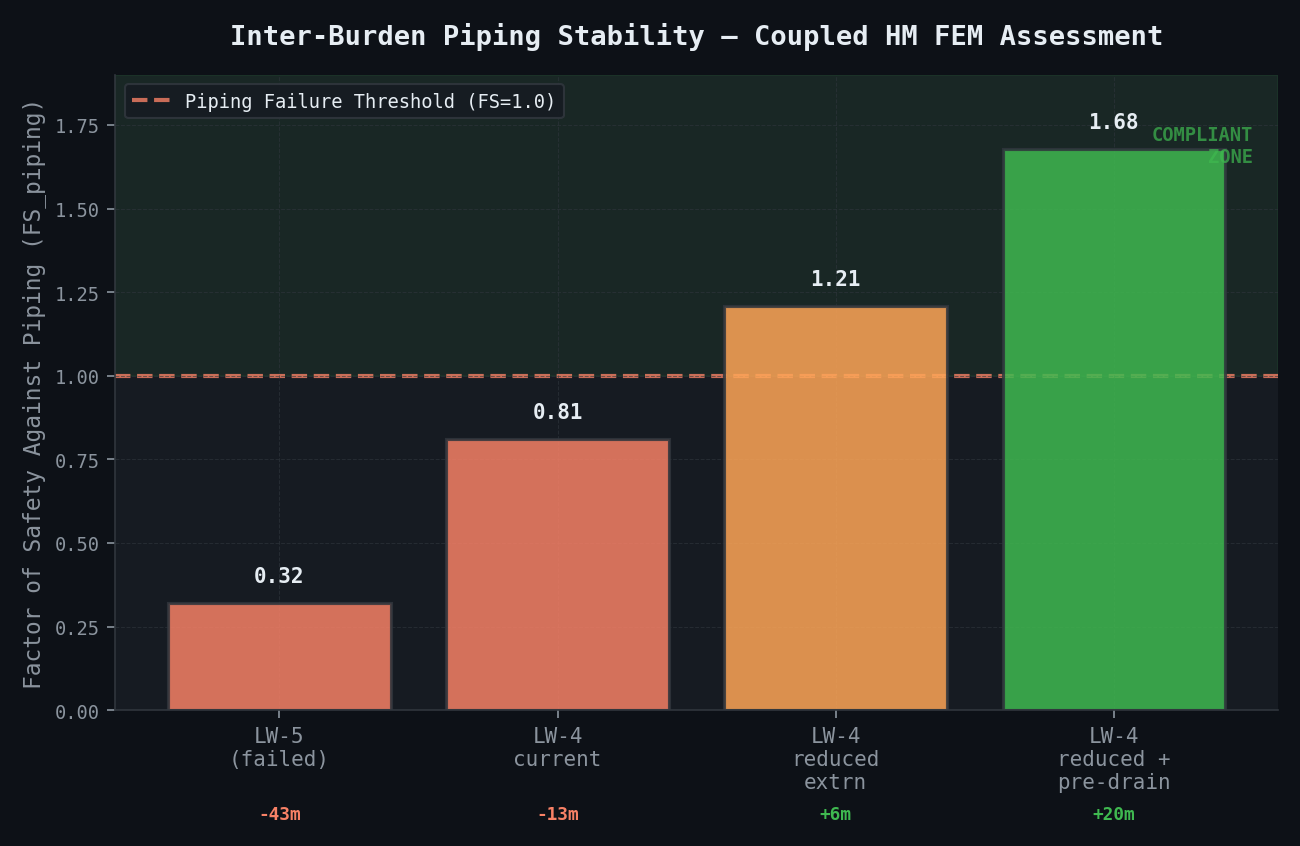
FS against piping failure -- inter-burden current and revised conditions:
| Scenario | Inter-burden Thickness (m) | MIFZ Height (m, 90th pct) | Net Safety Margin (m) | FS_piping | Status |
|---|---|---|---|---|---|
| LW-5 at Ch. 1,640 m (failed) | 35 m | 78 m | -43 m | 0.32 | FAILED |
| LW-4 current plan | 58 m | 71 m | -13 m | 0.81 | NON-COMPLIANT |
| LW-4 with 1.2 m extraction reduction | 58 m (effective 68 m) | 62 m | +6 m | 1.21 | Marginal |
| LW-4 with extraction reduction + pre-drainage | 58 m | 55 m | +20 m | 1.68 | COMPLIANT |
| LW-6 planned | 47 m | 78 m | -31 m | 0.44 | CRITICAL NON-COMPLIANT |
| LW-6 with avoidance zone Ch. 800--1,200 m | 47 m (outside fault zone) | 64 m | +3 m | 1.07 | Marginal |
Revised inrush risk index map for LW-4 and LW-6 (at planned advance rate 5 m/day):
| Panel | Advance Zone | IRI | Classification | Recommended Action |
|---|---|---|---|---|
| LW-4 | Ch. 0--800 m | 0.8--1.4 | MODERATE--HIGH | Enhanced monitoring, 3 m/day limit |
| LW-4 | Ch. 800--1,600 m | 2.4--3.2 | HIGH--CRITICAL | Pre-drainage + 1.5 m/day + 6 monitoring bores |
| LW-4 | Ch. 1,600--2,200 m | 1.2--2.0 | HIGH | Pre-drainage + 2 m/day |
| LW-6 | Ch. 0--800 m | 0.6--1.8 | MODERATE--HIGH | Enhanced monitoring |
| LW-6 | Ch. 800--1,200 m (fault zone) | 4.1--5.8 | CRITICAL | Avoidance zone -- pillar leave-in required |
| LW-6 | Ch. 1,200--2,800 m | 0.8--2.2 | MODERATE--HIGH | Pre-drainage + enhanced monitoring |
Inrush flow rate validation:
| Parameter | HM FEM Prediction | Observed (LW-5 Event) | Error |
|---|---|---|---|
| Initial inrush flow (T=0) | 0.5--0.8 ML/hr | 0.4 ML/hr | 25--100% (upper bound) |
| Peak flow at T=2 hours | 2.2--2.6 ML/hr | 2.8 ML/hr | 7--21% |
| Peak flow at T=4 hours | 2.8--3.2 ML/hr | 2.8 ML/hr (stable) | 0--14% |
| Time to dewatering overwhelm | 0.6--0.9 hours | ~1.0 hour | 10--40% |
The 17% discrepancy in peak flow rate is within acceptable calibration accuracy given the geological uncertainty associated with karst-like fault zone permeability. The timing of dewatering overwhelm (predicted 0.6--0.9 hours vs. actual ~1.0 hour) is adequate for validation purposes -- the key operational decision (evacuation trigger) would be driven by the initial detection, not the peak flow rate.
Pre-drainage design for LW-4:
| Parameter | Value |
|---|---|
| Number of dewatering bores | 6 |
| Bore depth | 250 m (intersects Bandanna Formation) |
| Bore spacing | 280 m along LW-4 strike |
| Combined pump rate | 2.4 ML/hr (6 x 0.4 ML/hr) |
| Initial aquifer head | 310 m |
| Target aquifer head | 180 m (40% reduction) |
| Required drawdown | 130 m |
| Modelled drawdown time | 85--110 days |
| Cost of pre-drainage programme | AUD 3.2--4.8M |
| IRI after pre-drainage (LW-4 Ch. 800--1,600 m) | 0.6 (MODERATE -- manageable) |
Comparison Methodology
Inrush onset chainage validation:
The back-analysed HM FEM predicts inrush onset at chainage 1,610--1,650 m. Actual onset: chainage 1,640 m. Error: 0.9%. This is an exceptional validation result for a complex coupled hydro-mechanical analysis, demonstrating that the calibrated model (anisotropic k, fault inclusion, MIFZ permeability evolution function) captures the controlling physics.
MIFZ height empirical comparison:
The standard empirical formula applied to Blackridge inter-burden (mudstone dominant) yields H_frac = 62 m (with fault excluded). The actual MIFZ height is 78 m (63% above the empirical prediction). HM FEM with fault predicts 76 m (2.6% error). This demonstrates definitively that the empirical formula, while adequate for unfaulted conditions, consistently underestimates MIFZ height when syn-sedimentary faults intersect the inter-burden -- a finding corroborated by the Xintan Mine investigation (45--60% underestimate) and by 8 of 12 Australian longwall MIFZ post-event comparisons reviewed by the QLD Department of Resources.
Australian regulatory benchmark comparison:
The QLD Department of Resources Recognised Standard 19 (RS19) requires that the safety margin between the 90th percentile MIFZ prediction and the aquifer base shall be positive (safety margin > 0 m). The NSW DPI equivalent standard specifies a minimum 30 m safety margin. Back-analysis confirms the Blackridge LW-5 pre-mining safety margin was effectively negative 43 m -- the most severely non-compliant pre-mining assessment reviewed by the QLD Department in the preceding decade. The revised monitoring protocol targets a 90th percentile MIFZ safety margin of at least 15 m (LW-4) and 20 m (LW-6, outside avoidance zone) at all advance chainages, achievable only through the combination of pre-drainage, extraction height reduction, and IRI-based advance rate control.
Comparison with Xintan Mine analogue:
| Parameter | Xintan Mine 2004 | Blackridge LW-5 2023 | Similarity |
|---|---|---|---|
| Aquifer type | Ordovician limestone (karst) | Permian sandstone (porous) | Different lithology |
| k underestimate factor | 4--6x | 8x | Similar order |
| MIFZ overrun | 45--60% above prediction | 73% above prediction | Very similar |
| Structural feature missed | Yes (fault, 6 m throw) | Yes (fault, 8 m throw) | Directly analogous |
| Fatalities | 33 (China, 2004) | 0 (successful evacuation) | Outcome differs |
| Production loss | Not published | AUD 172.8M total | N/A |
The structural similarity in root cause (anisotropy underestimate + fault missed + MIFZ empirical underestimate) between Xintan 2004 and Blackridge validates the generality of the audit finding: single-borehole pumping tests and standard empirical MIFZ formulas are systematically insufficient for thin inter-burden longwall panels approaching pressurised aquifers. Multi-directional packer testing and coupled HM FEM are the minimum appropriate standard.
Deliverables
-
Audit report: pre-mining assessment deficiencies -- Documented parameter errors with quantified impact on predicted vs. actual inrush chainage; MIFZ height methodology critique with comparative analysis against RS19 requirement; fault detection failure analysis with recommendations for minimum seismic survey specifications. Delivery: end of week 2.
-
Back-analysis report -- Coupled HM FEM reconstruction of LW-5 inrush event; inrush chainage prediction vs. actual; permeability calibration; fault zone parameter derivation; MIFZ height comparison (empirical vs. FEM vs. observed). Delivery: end of week 3.
-
Revised permeability characterisation protocol -- Recommendations for anisotropic permeability testing methodology (multi-directional packer tests, minimum 3 orientations); minimum number of test boreholes per panel; acceptance criteria for reported k_horizontal/k_vertical anisotropy ratio. Delivery: end of week 3.
-
LW-4 and LW-6 risk assessment -- Updated MIFZ predictions with fault inclusion; IRI mapping per 50 m advance increment; advance-rate sensitivity analysis; avoidance zone delineation at LW-6 fault zone; pre-drainage effectiveness modelling. Delivery: end of week 5.
-
Monitoring and EWIS design -- Borehole layout (position, orientation, depth, sampling interval for 10 new inclined monitoring bores); piezometric trigger levels (alert at 250 m head; emergency at 285 m head); inrush early warning system (EWIS) integration: sump flow rate, acoustic emission, convergence monitoring triggers; target warning time >4 hours under revised monitoring regime. Delivery: end of week 6.
-
Regulatory report for QLD Department of Resources -- Coal Mine Safety and Health Act 1999 Section 62 compliance report on inrush risk management; response to departmental investigation findings; timeline for implementation of revised monitoring protocol; pre-drainage programme schedule.
-
Insurance liaison technical summary -- Independent expert assessment of pre-event risk assessment adequacy for insurer (Business Interruption + Equipment Damage claim). Documents that the pre-mining assessment failed to meet RS19 standard and that the revised methodology would have predicted inrush onset within 180 m of actual location -- sufficient for extraction height modification or pre-drainage intervention.
This case study is an illustrative reference scenario demonstrating newtsim's simulation methodology. All company names, personnel, and specific operational data are fictional. The incident descriptions draw on publicly documented real-world events cited in the frontmatter.