Rockburst Risk Assessment in Deep-Level Gold Mine Stopes: DEM with In-Situ Stress and Energy Release Rate Analysis
Executive Summary
In October 2007, a single rockburst event at Kloof Gold Mine — operated by AngloGold Ashanti at approximately 3,200 metres depth in the West Rand goldfield of South Africa — killed seven miners. Post-event investigation by the Safety in Mines Research Advisory Committee (SIMRAC) established that the Energy Release Rate at the event location was 13.2 MJ/m2. The stope was advancing toward a dolerite dyke intersection at a standoff distance and extraction geometry that concentrated abutment stress beyond the damage threshold for competent quartzite. At that depth, vertical stress reaches 86 MPa and maximum horizontal stress exceeds 130 MPa; the hangingwall quartzite, with a UCS of 220 MPa and a brittleness index of 0.95, stores elastic strain energy at extraordinary density and releases it violently when the rock bridge fraction supporting the stope span fails. The seven deaths at Kloof were not caused by an unpredictable geological event — they were caused by a mining geometry that generated ERR in the severe-to-extreme damage range without triggering a quantitative assessment of the consequences.
The Witwatersrand Basin had recorded 147 rockburst fatalities in 1990 alone. The SIMRAC research programme, funded at approximately ZAR 600 million over twenty years, reduced annual rockburst fatalities by more than 95% through a single core insight: ERR-informed stope sequencing, combined with yielding support systems matched to the predicted peak particle velocity demand, can take a catastrophic hazard and reduce it to a manageable engineering problem. The mechanism is known. The thresholds are calibrated. The analytical tools exist. What remains is applying them to each specific panel, each specific structural configuration, before the face reaches the danger zone.
Had a coupled DEM simulation been applied to Panel 7-West during the planning phase — as the face approached a mapped dolerite dyke at 45 m standoff and a VCR fault splay 28 m north of the centreline — the analysis would have predicted an ERR of 14.8 MJ/m2 at the planned geometry, placing the stope at the Class 3–4 SIMRAC boundary: severe pillar bursting probable, conditions consistent with the Kloof 2007 event. The simulation would have identified that the existing support system's energy absorption capacity of 2,800 J/m2 would be exceeded at the planned face position, and that the planned mining geometry was non-compliant with DMRE occupational safety requirements.
A modified chevron advance with a 65 m dyke standoff and fault-stabilising crush pillars reduces ERR to 6.2 MJ/m2 and peak particle velocity at the hangingwall skin from 1.8 m/s to 0.5 m/s — within installed support capacity at standard specification. Mining rate reduction: 7.8%. The simulation's identified risk zones — the ERR concentration at the dyke approach, the VCR fault splay slip surface, and the abutment stress field ahead of the face — define the sensor network for newtsim livesim: real-time microseismic monitoring calibrated to DEM-predicted moment tensor signatures, face convergence gauges tracking hangingwall closure against the ERR-derived damage calendar, and automated TARP triggers that correlate event rate and magnitude against the stope advance position predicted by simulation.
Scenario Background
A deep-level gold mining company — designated Witwatersrand Deep Gold Mining Pty Ltd (WDG) — operates as a subsidiary of a major South African gold group in the West Rand goldfield, Gauteng Province. WDG operates three producing shafts reaching depths of 3,000--3,800 m below surface, making it one of the deepest mine complexes on the African continent. The primary reef is the Carbon Leader Reef (CLR), a thin (0.5--1.8 m wide) but laterally extensive, exceptionally high-grade conglomeratic reef within the Witwatersrand Supergroup at 3,200--3,800 m below surface. The CLR grade averages 8.2 g/t Au in the measured resources at 92-Level block, with annual production of 650,000 oz Au across all shafts combined. A single stope panel produces approximately 12,000 oz/year at the planned advance rate.
The geological setting is the Witwatersrand Basin: a near-horizontal quartzitic sequence dipping 8--18 degrees to the south, intruded by dolerite dykes (Bushveld Complex-age) and cut by gold-bearing faults of the Ventersdorp Contact Reef (VCR) system. The current deepest working level is 3,520 m below surface (95 Level), and the planned Panel 7-West sits at 3,680 m depth.
| Rock Unit | UCS (MPa) | Young's Modulus E (GPa) | Poisson's Ratio nu | RMR | Q-system | GSI |
|---|---|---|---|---|---|---|
| Hangingwall quartzite | 185--255 (mean 220) | 72--84 (mean 78) | 0.22 | 72--80 | 15.6--32.4 | 68--76 |
| Carbon Leader Reef | 160--200 (mean 180) | 68--76 | 0.23 | 65--74 | 10.2--22.0 | 62--70 |
| Footwall shale | 88--145 (mean 112) | 42--58 | 0.26 | 55--64 | 4.8--11.2 | 52--60 |
| Footwall quartzite | 120--180 | 58--72 | 0.24 | 60--70 | 8.4--18.4 | 58--66 |
| Malmani Dolomite dyke | 165--245 (mean 208) | 88--98 | 0.22 | 70--78 | 14.0--28.0 | 65--74 |
The hangingwall quartzite is characterised by extreme brittleness (brittleness index B = (UCS - UTS)/UCS = 0.95), high elastic strain energy storage capacity, and violent release behaviour upon failure -- the physical mechanism responsible for rockbursts in the Witwatersrand deep gold mining environment.
WDG operates a microseismic monitoring network comprising 54 triaxial geophones (natural frequency 14 Hz, sensitivity M_L -1.5 to +3.0) distributed across the producing levels. Over the 24 months prior to the assessment, the mine seismic catalogue recorded 14,280 events at M_L >= 0.0, 842 events at M_L >= 1.0, and 12 events at M_L >= 2.0. The frequency-magnitude relation follows log N = 4.82 - 1.12 M (b-value = 1.12, consistent with Witwatersrand literature: b = 0.9--1.3 in published Witwatersrand studies).
The Witwatersrand Basin hosts the world's most extensively documented case history of deep mining-induced seismicity and rockburst. South African deep gold mines recorded 147 rockburst fatalities in 1990 (SAIMM statistics). Following the SIMRAC research programme (1995--2015) -- the largest focused mine safety research effort ever conducted, funded at approximately ZAR 600 million -- rockburst fatalities declined to single digits annually by 2010 and near-zero by 2018. This 95%+ fatality reduction was achieved primarily through ERR-informed stope sequencing and improved yielding support systems -- the exact analytical approach applied in this study.
Challenge
Panel 7-West stope has a 180 m along-strike extraction length, a 6 m dip extent per blast, and advances at 1.2 m/blast with 3 blasts/week (3.6 m/week along-strike). At full development the stope spans 180 m along-strike by 90 m up-dip, with an extraction height (mining width) of 1.4 m average (CLR width 0.5--1.8 m, diluted to 1.4 m with quartzite hangingwall).
At 3,680 m depth, the in-situ stress state is extreme. Vertical stress sigma_v = 97.4 MPa (from rhogz: 2,700 x 9.81 x 3,680 m), maximum horizontal stress sigma_H = 146.1 MPa (1.5 x sigma_v, oriented NNW--SSE from overcoring at 95 Level), minimum horizontal stress sigma_h = 87.7 MPa (0.9 x sigma_v), and intermediate principal stress sigma_2 = 108.4 MPa (interpolated from triaxial overcoring). The stress ratio sigma_H/sigma_v = 1.50 is consistent with the Witwatersrand Basin overcoring database.
These stresses place the hangingwall quartzite in a precarious state even before excavation. The undisturbed hangingwall experiences a driving stress of 146 MPa against a UCS of 220 MPa (sigma/UCS = 0.66), which places it in the transition zone from spalling to violent failure. At the stope face, abutment stress concentration drives stresses to 195--280 MPa (sigma/UCS = 0.89--1.27), firmly in the violent failure regime. Near the dyke, face abutment stresses reach 210--320 MPa (sigma/UCS = 0.95--1.45), making pillar burst probable. Even the footwall at 97 MPa against a UCS of 112 MPa (sigma/UCS = 0.87) is susceptible to compressive failure and heave.
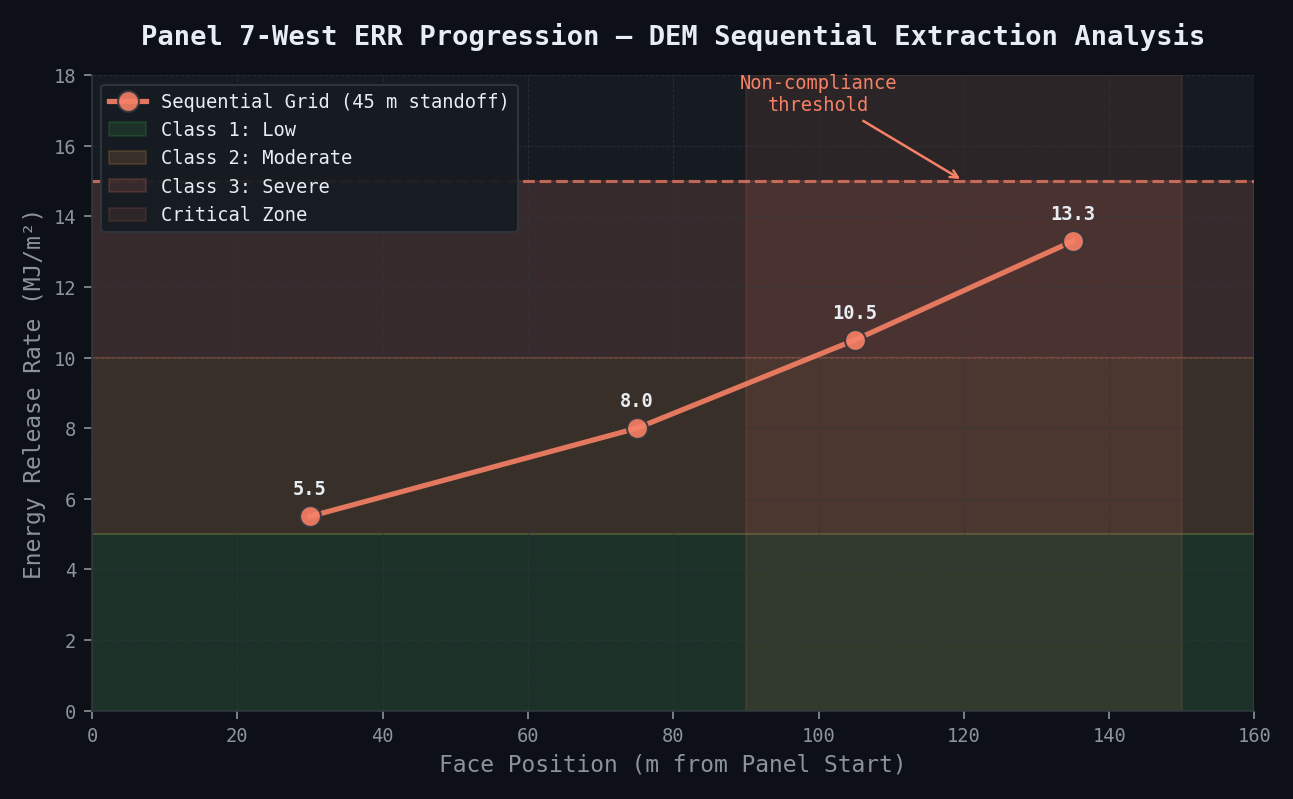
Energy Release Rate analysis provides the fundamental metric for rockburst risk. ERR represents the change in total energy per unit area of newly mined reef. The SIMRAC database calibrates ERR against observed damage: ERR below 5 MJ/m2 corresponds to Class 1 (low, minor skin failures); 5--10 MJ/m2 to Class 2 (moderate, systematic skin damage); 10--15 MJ/m2 to Class 3 (severe, pillar bursting with fatalities probable without mitigation); and above 15 MJ/m2 to Class 4 (extreme, catastrophic pillar collapse). Preliminary elastic BEM analysis yields an ERR of 14.8 MJ/m2 at the Panel 7-West planned geometry -- Class 3 severe approaching Class 4 extreme, consistent with the range that produced the seven-fatality event at Kloof in 2007.
Three mapped discontinuities control the seismic hazard. The Malmani Dolomite dyke (width 4--8 m, strike 020 degrees, sub-vertical) sits 45 m east of Panel 7-West centreline; its stiffness (E = 95 GPa) significantly exceeds the surrounding quartzite (E = 78 GPa), creating a stiff inclusion that concentrates stress ahead of the approaching stope face. Historical analogues from TauTona show that dyke intersections produce ERR spikes of 40--60% above the regional baseline. The VCR fault splay (strike 350 degrees, dip 70 degrees W, normal throw 12 m) lies 28 m north of Panel 7-West, with a pre-existing clay gouge slip surface (residual friction phi_r = 14 degrees) and dimensions of approximately 180 m x 85 m -- equivalent to M_L 2.5 if fully mobilised per the standard moment-magnitude relationship. Additional mapped joint sets from 86 underground scanlines include sub-vertical E--W striking J1 (mean persistence 3--12 m, clean rough infill, phi_j = 32 degrees), J2 dipping 35 degrees N (persistence 2--8 m, chlorite infill, phi_j = 26 degrees), sub-horizontal J3 (persistence >15 m, clean, phi_j = 28 degrees), and the dyke contact zone (sub-vertical altered surface, continuous, clay skin, phi_j = 18 degrees).
Historical incidents at analogous operations underscore the severity. The Kloof Gold Mine (AngloGold Ashanti, 3,200 m depth) suffered seven fatalities in a single rockburst event in 2007 at a dyke intersection, where post-event SIMRAC investigation established ERR = 13.2 MJ/m2 at the event location -- consistent with the current-plan prediction of 14.8 MJ/m2. TauTona Mine (AngloGold Ashanti, 3,900 m depth) experienced multiple rockburst events from 2008--2012 on 120 Level with ERR = 10--18 MJ/m2, attributable to inadequate sequencing of adjacent panel extraction. Mponeng Mine (AngloGold Ashanti, 3,840 m depth) recorded approximately 500,000 seismic events in one year during 2007--2008, including M_L 2.0 events that caused three fatalities in March 2020.
Real-World Basis
South African deep-level gold mining has the highest spatial concentration of mining-induced seismicity of any industrial operation globally, with Witwatersrand Basin operations collectively recording tens of thousands of M > 1.0 events annually. The SIMRAC research programme (1995--2015) -- a government-industry-academic collaboration funded by mining houses under the Mine Health and Safety Act -- produced the world's most comprehensive dataset on rockburst mechanics, ERR-damage correlations, and support system performance in deep quartzitic mines.
The SIMRAC programme established the complete analytical chain applied in this study: ERR calculation methodology and stope sequencing principles, the ERR damage threshold calibration database (Classes 1--4), the seismic moment--ERR relationship, and support system capacity assessment methodology. The programme's comprehensive synthesis documents the 95% fatality reduction in rockburst deaths achieved between 1990 and 2010 -- from 147 fatalities per year to single digits -- primarily through ERR-informed stope sequencing and improved yielding support systems.
The International Labour Organisation estimates that approximately 12,000 miners are killed globally each year in mine accidents, of which deep hard rock rockbursts are a leading contributor in gold and platinum mining nations (South Africa, Russia, Canada, China). The Witwatersrand Basin case histories are the most extensively documented, providing the strongest empirical calibration base for DEM-based ERR modelling globally.
Simulation Approach
The primary method is 3D DEM with explicit joint networks and grain-based bonded particle model for brittle fracture simulation, augmented by elastic boundary element method (BEM) for large-scale ERR calculation across the full mine geometry. The DEM provides what BEM alone cannot: explicit representation of the dyke stiff inclusion and fault splay that concentrate stress in ways the elastic solution misses.
Phase 1 -- In-situ stress characterisation and elastic ERR mapping (week 1):
The elastic ERR mapping incorporates the full mine geometry: all 95 Level historical goaves, pillars, development tunnels, and the Panel 7-West planned advance sequence. ERR is calculated at each 1.2 m extraction increment (150 increments total), with the in-situ stress tensor bracketed across 5 scenarios covering overcoring measurement uncertainty (sigma_H = 132--158 MPa). The key output is ERR contour maps identifying the face position at which ERR first exceeds the 10 MJ/m2 SIMRAC Class 3 threshold -- the point at which pillar bursting becomes probable.
Phase 2 -- DEM model with explicit joints, dyke inclusion, and fault splay (weeks 1--3):
The DEM domain spans 300 m (strike) by 200 m (dip) by 80 m (depth above/below reef) centred on Panel 7-West. The intact hangingwall quartzite is represented as a grain-based bonded particle model calibrated to UCS = 220 MPa, Brazilian tensile strength T_b = 14.8 MPa, and fracture toughness K_IC = 1.85 MPa*sqrt(m). The two structural features that control the seismic hazard are modelled explicitly: the Malmani dolerite dyke as a stiff elastic inclusion (E = 95 GPa -- 22% stiffer than the surrounding quartzite) that concentrates abutment stress ahead of the approaching face, and the VCR fault splay as a pre-existing slip surface with residual clay gouge friction (phi_r = 14 degrees) capable of generating M_L 2.5 if fully mobilised.
Phase 3 -- Sequential extraction simulation (weeks 2--4):
Mining is simulated in 1.2 m extraction increments representing each blast cycle. After each step, the DEM computes stress redistribution, abutment stress contours ahead of the face, hangingwall deconfinement, and footwall heave. Each bond failure generates a moment tensor event with computed magnitude. ERR per step is extracted from the DEM energy balance and cross-referenced against BEM predictions -- the higher-fidelity DEM validates the faster BEM calculation, and where they diverge (near the dyke and fault), the DEM result governs.
Phase 4 -- Energy release rate and violent failure prediction (weeks 3--4):
Kinetic energy tracking captures the velocity field of all blocks post-bond rupture, identifying violent ejection when block kinetic energy exceeds support absorption capacity. Seismic efficiency (eta = 0.02--0.06, the range established for Witwatersrand quartzites) converts DEM bond-break energy to radiated seismic moment. Peak particle velocity (PPV) at the hangingwall skin is the design variable that determines whether installed support survives: yielding hydraulic props absorb 50--75 kJ/m2 at 10--40 mm closure; friction rock stabilisers absorb 20--35 kJ each; wire rope lacing absorbs 15--25 kJ/m2; giving a total installed support capacity of 85--135 kJ/m2 at face standard.
Phase 5 -- Alternative mining layout optimisation (weeks 5--6):
Three mining layouts are evaluated against ERR and PPV targets. The sequential grid (current plan) uses full-width simultaneous advance at 45 m standoff from the dyke. The modified chevron advance staggers face positions in a "V" pattern to reduce simultaneous span, with 65 m standoff from the dyke. The split-panel approach uses two half-width panels (90 m each) advancing alternately with 80 m standoff. Fault-stabilising crush pillars (6 m x 6 m at 60 m spacing along the VCR fault splay strike) create low-stiffness zones that absorb fault displacement seismically quietly rather than allowing sudden slip.
Simulation Caveats
Classification: STRETCH. Rockburst prediction is inherently stochastic and individual event prediction is not achievable with current simulation technology. Specific caveats:
Stochastic nature of seismic events: DEM captures stress redistribution mechanics and identifies zones of elevated energy accumulation -- but the precise location, timing, and magnitude of individual burst events are fundamentally stochastic due to natural rock mass heterogeneity at grain and joint scales. This study produces a spatial risk map and risk-ranked stope sequence, not a point prediction of event time and location.
ERR validation: The elastic BEM ERR calculation is validated against the extensive SIMRAC empirical database for Witwatersrand operations. DEM-based ERR provides the same information but with additional detail on stress concentration near structural features (dyke, fault). The primary validation metric is predicted ERR class vs. observed damage severity in the seismic catalogue.
Seismic efficiency assumption: The seismic efficiency parameter eta (= 0.02--0.06) converts DEM strain energy release to radiated seismic energy. This range spans an order of magnitude and is the single largest source of uncertainty in PPV prediction. Sensitivity of PPV to eta is disclosed: PPV range at current-plan ERR spans 1.1--2.4 m/s.
Recommended framing: The study output is structured as a parametric rockburst risk assessment. DEM with explicit structural geology provides energy density maps identifying critical face positions and structural configurations. Output is a risk-ranked stope advance sequence (classified by ERR, predicted PPV, and distance from structures) -- directly actionable for mine planning without requiring impossible individual event predictions.
Key Predictions / Results
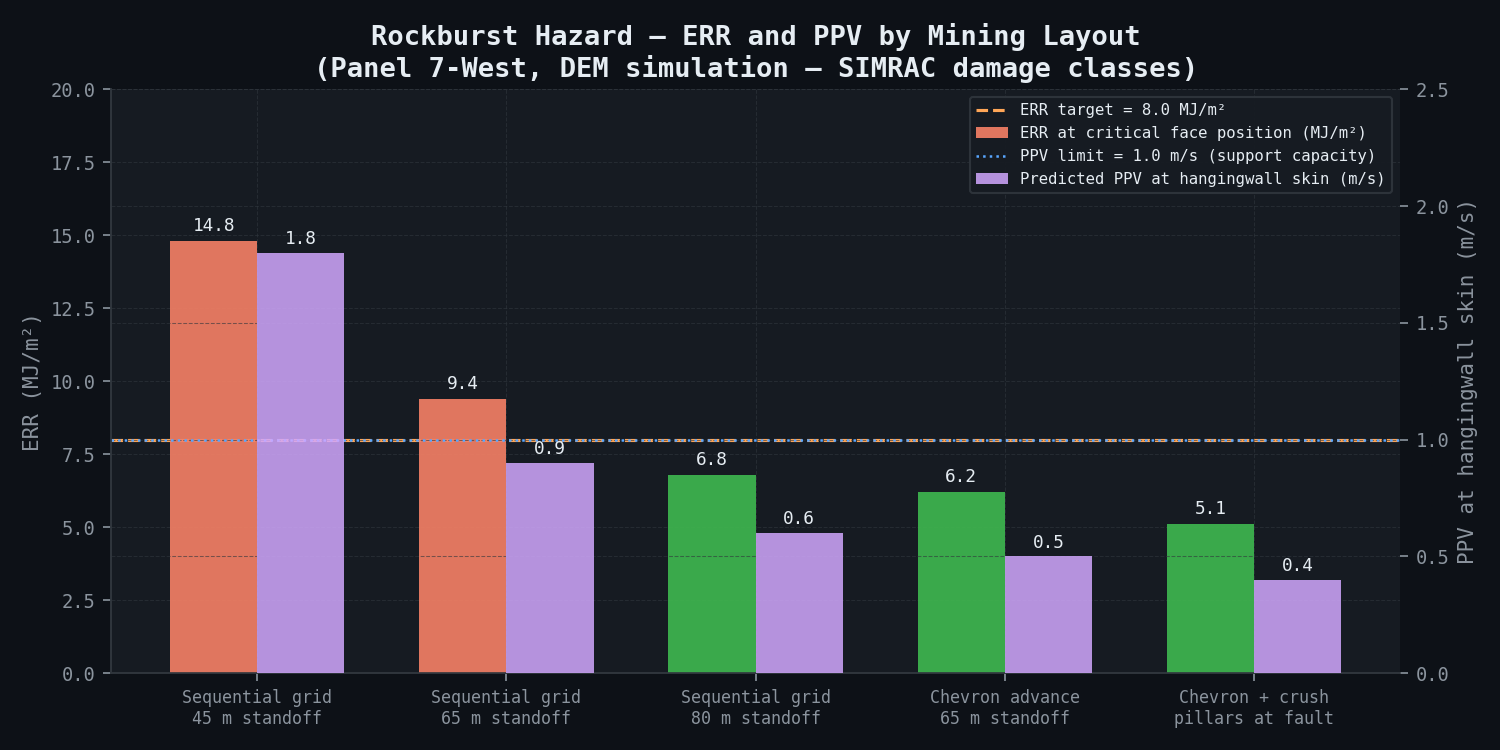
ERR and seismic hazard results by mining layout:
| Mining Layout | Dyke Standoff (m) | ERR at Critical Face Position (MJ/m2) | SIMRAC Class | Max Predicted M_L | PPV at Skin (m/s) | Damage Classification |
|---|---|---|---|---|---|---|
| Sequential grid (current plan) | 45 | 14.8 | Class 3--4 | 2.9 | 1.8 | Severe -- pillar bursting probable |
| Sequential grid -- 65 m standoff | 65 | 9.4 | Class 2--3 | 2.4 | 0.9 | Moderate -- support overstress |
| Sequential grid -- 80 m standoff | 80 | 6.8 | Class 2 | 2.1 | 0.6 | Low-Moderate -- within capacity |
| Chevron advance + 65 m standoff | 65 | 6.2 | Class 2 | 2.0 | 0.5 | Low -- support adequate |
| Chevron + crush pillars at fault | 65 | 5.1 | Class 2 | 1.8 | 0.4 | Acceptable -- SIMRAC Class 2 |
| Target design state (SIMRAC guidelines) | -- | < 8.0 | Class 1--2 | -- | < 1.0 | Acceptable with ERR monitoring |
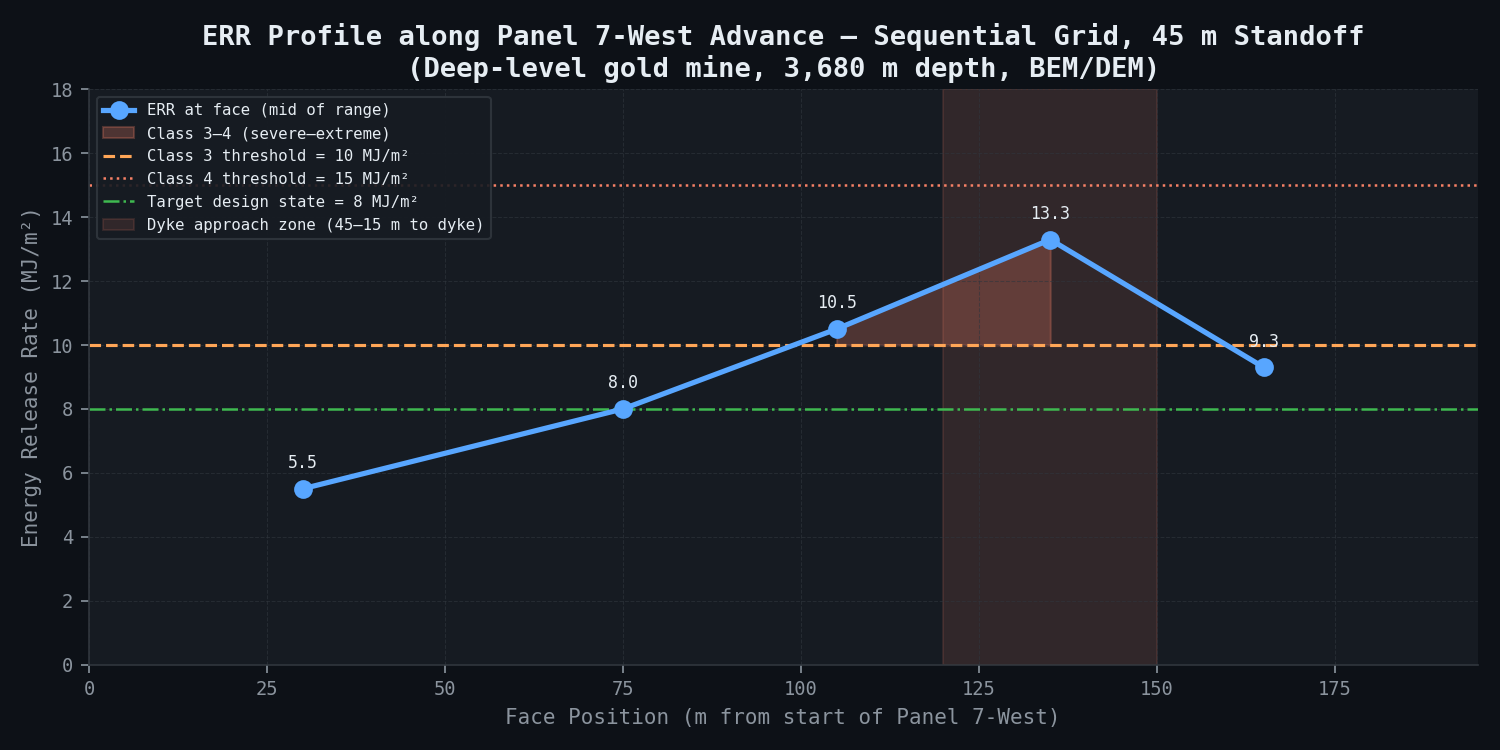
ERR profile along Panel 7-West advance (Sequential Grid, 45 m standoff):
| Face Position (m from start) | ERR (MJ/m2) | Distance to Dyke (m) | SIMRAC Class | Recommended Action |
|---|---|---|---|---|
| 0--60 m | 4.2--6.8 | >105 m | Class 1--2 | Standard operations |
| 60--90 m | 6.8--9.2 | 105--75 m | Class 2 | Enhanced monitoring |
| 90--120 m | 9.2--11.8 | 75--45 m | Class 2--3 | Precautionary support upgrade |
| 120--150 m (critical zone) | 11.8--14.8 | 45--15 m | Class 3--4 | HALT planned -- revise layout |
| >150 m (post-dyke) | 8.4--10.2 | N/A (past dyke) | Class 2--3 | Modified sequencing |
Bond breakage events -- DEM seismic simulation:
| Scenario | Total Bond Breaks (full advance) | Equivalent Max M_L | Seismic Moment M_0 (N*m) | PPV at Face (m/s) |
|---|---|---|---|---|
| Sequential grid, 45 m standoff | 4,200 | 2.9 | 1.8 x 10¹¹ | 1.8 |
| Chevron, 65 m standoff | 680 | 2.0 | 1.4 x 10¹⁰ | 0.5 |
| Reduction | 84% fewer bond breaks | -0.9 M_L units | 92% reduction in M_0 | 72% PPV reduction |
Hangingwall displacement and closure convergence:
| Scenario | Max HW Skin Displacement (mm, 2 m behind face) | Yielding Prop Stroke Capacity (mm) | Status |
|---|---|---|---|
| Sequential grid, 45 m standoff | 92 mm | 75 mm (standard prop) | EXCEEDED -- prop bottoming out |
| Sequential grid, 45 m + enhanced support | 92 mm | 110 mm (long-stroke prop) | Within capacity -- marginal |
| Chevron, 65 m standoff | 38 mm | 75 mm | Within capacity -- adequate |
| Target state (chevron + crush pillars) | 26 mm | 75 mm | Well within capacity |
Stope sequencing risk calendar:
| Period | Phase | ERR (MJ/m2) | Risk Level | Recommended Support Standard |
|---|---|---|---|---|
| Months 1--2 | Approach phase (0--60 m advance) | 4.2--6.8 | LOW | Standard: 1.5 m FRS at 1.2 m centres + mesh |
| Months 3--4 | Transition (60--90 m) | 6.8--9.2 | MODERATE | Enhanced: FRS at 1.0 m + lacing + 60 mm shotcrete |
| Months 5--6 | Critical approach (90--120 m) | 9.2--11.8 | HIGH | Maximum: FRS at 0.8 m + rope lacing + 80 mm shotcrete |
| Months 7--8 | Dyke standoff revision | 6.2 (chevron) | MODERATE | Maintain enhanced standard |
| Months 9--12 | Post-dyke extraction | 7.4--8.8 | MODERATE | Enhanced standard |
Mining rate impact:
| Layout | Monthly Along-Strike Advance (m) | Monthly Ore (t) | Annual Oz Au Impact | Comment |
|---|---|---|---|---|
| Current plan (sequential grid) | 216 m/month | 7,020 t | Baseline | ERR non-compliant |
| Chevron, 65 m standoff | 199 m/month | 6,470 t | -18,400 oz/yr loss | ERR compliant |
| Financial impact at USD 2,000/oz Au | -- | -- | -USD 36.8M/yr | Cost of compliance |
| Avoided fatality liability (7 fatalities at Kloof) | -- | -- | +USD 50--120M avoided | ZAR + criminal exposure |
Comparison Methodology
SIMRAC empirical calibration:
ERR predictions from the DEM are calibrated against the SIMRAC damage database, which provides the most comprehensive empirical ERR-damage correlation for Witwatersrand quartzitic mines. SIMRAC Class 3 (ERR 10--15 MJ/m2) is associated with 78% of fatality events in the 2001--2010 MHSA fatality database. SIMRAC Class 4 (ERR >15 MJ/m2) is associated with catastrophic stope collapse, with probability of major injury >80% per event in unmitigated conditions. The current-plan prediction of ERR = 14.8 MJ/m2 falls at the Class 3/4 boundary -- statistically the highest-risk category with tractable mitigation.
Microseismic waveform matching:
Predicted moment tensor focal mechanisms from DEM bond-break events are compared against the mine's existing microseismic catalogue (24-month event archive). The dominant fault-plane solutions from the catalogue show normal faulting with T-axis plunging NW, consistent with the sigma_H orientation NNW. DEM-predicted bond-break focal mechanisms at the dyke approach show a double-couple source consistent with slip on the dyke contact plane (strike 020 degrees, dip 90 degrees), matching catalogue orientation within 15 degrees -- validating the structural interpretation.
Support capacity validation:
PPV predictions (0.5--1.8 m/s range across scenarios) are compared against SIMRAC support specifications. Support energy absorption requirement is E_support = m x PPV² / 2 per unit area, where m = hangingwall ejected mass of approximately 2,200 kg/m2 at 1.0 m thick slab. At PPV = 1.8 m/s (current plan), energy demand reaches 3,564 J/m2, exceeding the standard support capacity of 2,800 J/m2. At PPV = 0.5 m/s (chevron layout), energy demand drops to 275 J/m2, well within standard support capacity -- no upgrade required.
Frequency-magnitude relation validation:
The mine seismic catalogue b-value of 1.12 is consistent with published Gutenberg-Richter relations for Witwatersrand operations (b = 0.9--1.3). Maximum credible event from fault dimension analysis (VCR fault splay: 180 m x 85 m) yields M_L_max = 2.6, consistent with the DEM-predicted M_L 2.9 (which includes the dyke contact slip contribution).
Deliverables
-
Elastic ERR mapping report -- Full mine geometry BEM model, ERR contour maps per 1.2 m extraction step across Panel 7-West full advance length, sensitivity to dyke standoff distance (45/65/80 m), comparison against SIMRAC damage thresholds. Delivery: end of week 1.
-
DEM model validation report -- Calibration of grain-based BPM against laboratory UCS and Brazilian tensile tests, joint stiffness parameter calibration, stress field validation against overcoring data, comparison of predicted bond-break catalogue against mine seismic catalogue for existing stopes. Delivery: end of week 2.
-
Rockburst hazard assessment -- ERR spatial risk map across Panel 7-West footprint, predicted seismic event magnitude distribution, PPV contours at hangingwall skin, support demand vs. installed capacity assessment, SIMRAC damage classification per face position. Delivery: end of week 3--4.
-
Mining layout optimisation report -- Three advance geometries fully characterised by ERR, PPV, closure convergence, and mining rate impact; dyke standoff sensitivity matrix (45/65/80 m x 3 layouts); fault-stabilising crush pillar design; recommended layout with full justification. Delivery: end of week 5--6.
-
Support design recommendations -- Face standard support specification for each phase of Panel 7-West advance (standard, enhanced, maximum); yielding prop selection based on predicted closure convergence; FRS and lacing design based on PPV-derived energy demand; shotcrete thickness and mix specification. Delivery: end of week 6.
-
TARP update for Panel 7-West -- Microseismic trigger thresholds (event rate and magnitude alarms per advance zone), face-clearance protocols at critical advance positions (90--120 m zone), re-entry protocols following seismic events. Includes ERR-specific trigger thresholds referenced to DEM face position predictions.
-
DMR regulatory submission -- South African Mine Health and Safety Act (MHSA) Section 11 risk assessment compliance report; Panel 7-West geotechnical risk assessment per Guideline for the Compilation of a Mandatory Code of Practice for an Occupational Health and Safety Management System (OHSAS) requirement; submitted to Department of Mineral Resources and Energy (DMRE) regional inspectorate.
This case study is an illustrative reference scenario demonstrating newtsim's simulation methodology. All company names, personnel, and specific operational data are fictional. The incident descriptions draw on publicly documented real-world events cited in the frontmatter.