Progressive Pit Wall Failure Analysis for a Large Open Pit Copper Mine: DEM with Explicit Joint Networks
Executive Summary
On the evening of 10 April 2013, the northeast wall of Bingham Canyon Mine in Utah — operated by Kennecott Utah Copper, a Rio Tinto subsidiary — failed in two successive episodes separated by ninety minutes. The combined displacement was approximately 65 million cubic metres, or 165 million tonnes of porphyry copper waste rock: the largest non-volcanic landslide in recorded North American history. Equipment losses reached USD 100 million. Production halted for seven months, costing an estimated USD 450–700 million in foregone revenue. The slide had been building for eleven months. Kennecott's extensive prism network, InSAR radar, and geophone array recorded accelerating displacement from May 2012 onward, peaking at 0.6 mm/day in early April 2013. On 9 April the northeast wall sector was evacuated; the main failure occurred the following evening with no fatalities. What the monitoring did not do — what monitoring alone cannot do — was convert those displacement records into a mechanistic prediction of failure sequence, timing, and the safe ore recovery margin available before kinematic lock-up. That question required a different class of analysis.
The geotechnical warning sign was the progressive step-path fracturing through clay-infilled weak zones and QMP rock bridges over those eleven months. The rock bridge fraction — the proportion of the total failure surface area holding the slope together through intact rock cohesion — was decaying at a measurable rate. Slope monitoring showed this through accelerating displacement; it could not show what fraction of bridge cohesion remained or how much of the proposed northeast wall pushback could safely proceed. Without that understanding, the USD 280 million Zona Alta ore body sat in a slope that mine planners could not safely access.
Had a Discrete Element Method simulation with explicit joint networks been applied to the northwest wall — the analogue sector in this assessment — the analysis would have predicted compound J1/J3 failure surfaces at the planned 60 m pushback geometry, a factor of safety of 0.96, and kinematic lock-up within 45–65 days of pushback commencement. Critically, the DEM time-to-failure prediction would have shown that the current Trigger Action Response Plan provided less than 6 hours of warning before global failure — well below the 24-hour MSHA-mandated evacuation window for multi-bench events. The simulation identifies the mechanism that converts monitoring velocity data into a failure timeline.
A revised 35 m pushback geometry with sub-horizontal drain bundles at two levels restores FS to 1.22 and extends warning time to more than 36 hours, recovering 8.2 Mt of ore at 0.68% Cu — USD 467 million in revenue — while meeting CSIRO slope design guidelines. The simulation's identified risk zones — the J3 clay-infilled release planes, the artesian QMP fracture network, and the progressive rock bridge rupture front — define the sensor network for newtsim livesim: real-time slope inclinometers and prism monitoring at the critical bench stack, piezometers targeting the artesian aquifer zone, and ground-based InSAR providing areal displacement tracking that gives continuous early warning aligned to the DEM-predicted failure signature.
Scenario Background
A major copper producer — designated Cerro Cobre Mining Corporation (CCMC) — operates an open pit porphyry copper-molybdenum deposit in the Basin and Range physiographic province of the southwestern United States, approximately 55 km west of a major metropolitan centre. CCMC is a wholly owned subsidiary of a diversified international mining group. The Cerro Cobre operation is the group's largest single asset by EBITDA contribution at approximately USD 1.1 billion/yr at USD 3.80/lb Cu, producing approximately 420,000 t Cu cathode equivalent per year. The operation has been active for 68 years and has expanded through four major pit pushback programmes.
The pit is a large-scale open pit with current dimensions of 3.8 km (E--W) by 3.2 km (N--S) by 900 m maximum depth -- one of the five largest open pits in North America by volume of material moved. Annual ore throughput is 100 Mt, with total proven and probable reserves of 4.2 Bt at 0.42% Cu and 0.012% Mo. Production includes approximately 420,000 t Cu cathode equivalent and approximately 9,000 t Mo concentrate per year, along with by-product silver at 1.8 g/t Ag and trace rhenium.
The porphyry system comprises a central quartz monzonite porphyry (QMP) core surrounded by altered andesite, with limestone contact zones at the northwest and southeast margins. Rock mass quality varies significantly across the pit:
| Rock Unit | UCS (MPa) | E (GPa) | RMR | Q-system | GSI |
|---|---|---|---|---|---|
| Quartz monzonite porphyry (QMP) | 85--120 | 48--58 | 55--68 | 8.4--18.0 | 52--65 |
| Altered andesite (surface to 300 m) | 32--65 | 28--38 | 38--52 | 1.2--4.8 | 35--48 |
| Altered andesite (>300 m depth) | 55--90 | 34--44 | 48--62 | 4.2--11.4 | 45--58 |
| Limestone (NW contact zone) | 65--110 | 42--55 | 45--62 | 3.2--12.0 | 42--58 |
| Phyllite/argillite (weak zones) | 18--42 | 14--22 | 22--35 | 0.3--1.8 | 20--32 |
Three dominant joint sets were mapped from a 3D photogrammetric scan of exposed pit walls (1,240 measured traces across 8 sectors), plus one fault zone:
| Joint Set | Strike | Dip | Dip Direction | Mean Persistence (m) | Infill | JRC |
|---|---|---|---|---|---|---|
| J1 (Foliation-parallel) | 085 degrees | 72 degrees | NNW (into northwest wall) | 8.2 m (lognormal) | Clean, rough | 8--12 |
| J2 (Cross-cutting) | 145 degrees | 48 degrees | SW | 5.6 m (lognormal) | Chlorite, wet | 4--7 |
| J3 (Sub-horizontal) | Variable | 8--14 degrees | Variable | >15 m (persistent) | Clay, wet | 2--4 |
| Calico Fault | 025 degrees | 58 degrees | NW | Continuous | Clay gouge | 0--2 |
The sub-horizontal J3 set with clay-infilled surfaces is the most critical kinematic release plane for large-scale block detachment. The Calico Fault (located 3.8 km from pit centre) generated an M_L 2.3 event in the prior year. The northwest wall (critical sector) has an inter-ramp slope angle of 42 degrees, bench height of 15 m, bench face angle of 65 degrees, berm width of 8 m, and overall slope angle of 37 degrees. The total northwest wall stack height is 480 m (elevation 480--960 m ASL) across 32 active benches.
Challenge
The assessment centres on the northwest wall: a 480 m high bench stack comprising 32 active benches from crest elevation 960 m ASL to pit floor contact at 480 m ASL, with an inter-ramp angle of 42 degrees, overall slope angle of 37 degrees, and total volume in the critical failure envelope estimated at 120--180 Mt.
Photogrammetric mapping and InSAR time series (Sentinel-1, 12-day repeat, 15 mm/pixel sensitivity in LOS direction) identified a compound planar--step-path failure surface controlled by J1 joints (dip 72 degrees NNW, dipping into the slope) combined with J3 sub-horizontal release planes at bench toe level. This compound surface allows large block segments to translate along J3 (low friction, clay infilled) and rupture through J1-bounded rock bridges in a retrogressive sequence. Kinematic envelope analysis estimates a failure volume of 12--18 Mt (most probable) to 35 Mt (extreme scenario).
Groundwater conditions add significant complexity. Piezometers in the northwest wall indicate a phreatic surface at 40--80 m below pit floor contact (seasonal variation), while three dewatering boreholes in the 550--620 m depth range encountered artesian conditions with piezometric head 25--38 m above collar elevation -- indicating a confined aquifer zone in the QMP fracture network at depth. This was unexpected given the extensive mine dewatering programme (current pump rate: 28 ML/day from 22 dewatering bores). Regional seismic loading stands at PGA = 0.15 g (2% probability of exceedance in 50 years; USGS National Seismic Hazard Model 2018), with local mining-induced seismicity from bench blasting producing peak particle velocity up to 25 mm/s at 200 m standoff. The Calico Fault M_L 2.3 event is within the fault dimensions expected to generate events up to M_L 3.5 under the current stress regime.
Monitoring data provide context for the failure trajectory. Current cumulative horizontal displacement stands at 180 mm over 18 months, compared to the Bingham Canyon pre-failure analogue of approximately 350 mm over 11 months. Displacement velocity of 0.4 mm/day is 67% of Bingham Canyon's pre-failure peak of 0.6 mm/day. Inverse velocity trend analysis extrapolates time-to-failure at 140--280 days from the current reading date. InSAR confirms 180 mm of areal displacement across 0.8 km2 of the NW wall, consistent with prism data, while seepage from northwest dewatering holes accounts for 12 ML/day of the 28 ML/day total -- an elevated 43%.
The key risk driver is the mine plan calling for a 60 m pushback into the northwest wall within 18 months to access the Zona Alta ore body, estimated at 12 Mt at 0.68% Cu with an NPV of USD 280M at USD 3.80/lb Cu. This pushback removes the passive buttress zone identified by preliminary limit equilibrium analysis as the primary contributor to the current FS > 1.0 in the northwest wall. Inverse velocity analysis predicts acceleration to failure in less than 60 days from pushback commencement.
Real-World Basis
The 10 April 2013 Bingham Canyon Mine landslide (Kennecott Utah Copper LLC, a wholly owned subsidiary of Rio Tinto plc) provides the direct physical analogue for this study in both geology and failure mechanism.
On 10 April 2013, the northeast wall of the Bingham Canyon open pit (the world's largest open pit copper mine by ore production, operating since 1906) failed in two separate episodes separated by approximately 1.5 hours. The first episode (21:00 local time) displaced approximately 55 million tonnes, followed by the second episode (approximately 22:30 local time) displacing approximately 110 million tonnes -- combined total approximately 165 million tonnes (65 million m3). This is widely cited as the largest non-volcanic landslide in recorded North American history.
Kennecott had invested substantially in slope monitoring infrastructure, including an automated total station prism network (92 prisms across the northeast wall), ground-based InSAR (IBIS-M radar interferometer, installed 2012), a seismic network (geophone array, 14 sensors), and geotechnical instrumentation comprising 38 piezometers, 12 inclinometers, and 4 time-domain reflectometry cables. The monitoring programme identified accelerating displacement beginning in May 2012 -- 11 months before the failure event. Peak pre-failure velocity reached 0.6 mm/day in late March/early April 2013. On 9 April 2013, displacement acceleration triggered mine evacuation of the northeast wall sector. The main failure occurred on 10 April 2013 with no fatalities. Equipment losses totalled approximately USD 100 million, and production halted for 7 months (full production resumed November 2013).
Post-event DEM back-analysis established the failure sequence: weak zone activation along pre-existing phyllite/argillite weak zones (analogous to J3 in this study) combined with step-path fracturing through stronger QMP rock bridges; progressive rock bridge failure over the 11-month displacement period reducing effective cohesion from peak to residual; kinematic lock-up loss when remaining rock bridge fraction fell below the threshold needed to maintain stability; and seismic energy equivalent to M_L 4.0--5.0 generated by the slide itself rather than as a trigger.
| Parameter | Bingham Canyon 2013 | This Study (Analogue) |
|---|---|---|
| Pit depth | ~970 m | ~900 m |
| Northwest/northeast wall height | ~800 m (NE) | 480 m (NW) |
| Failure volume | 65 million m3 / 165 Mt | 12--35 Mt (modelled) |
| Pre-failure displacement | ~350 mm (11 months) | 180 mm (18 months) |
| Peak pre-failure velocity | ~0.6 mm/day | 0.4 mm/day (current) |
| Warning time before main slide | ~12 hours (evacuation) | <6 hours (current TARP) |
| Failure mechanism | Compound step-path | Compound J1/J3 (analogous) |
| Equipment loss | USD 100M | USD 80--150M (estimated) |
| Production halt | 7 months | 5--8 months (modelled) |
| Fatalities | 0 (successful evacuation) | 0 (with adequate TARP) |
| Rock type | Porphyry copper / phyllite | Porphyry copper / phyllite |
Simulation Approach
The primary method is 3D Discrete Element Method (DEM) with explicit discrete fracture network (DFN) realisation. The DEM represents the rock mass as millions of polyhedral blocks interacting through deformable contact interfaces -- the correct framework for a slope where deformation is dominated by joint slip and block rotation rather than intact rock failure.
Phase 1 -- Discrete Fracture Network generation (week 1):
The DFN was generated from photogrammetric joint trace mapping (1,240 measured joint traces across 8 pit wall sectors). Orientation distributions were fitted to each joint set, with trace length distributions from scanline data. The critical structural parameter is rock bridge proportion -- the fraction of total failure surface area not cut by joints -- estimated at 12--24% from connectivity analysis of 20 DFN realisations (mean 18%). This is the variable that controls whether the slope stands or fails: as rock bridges rupture progressively, the effective friction of the failure surface degrades from intact-rock strength toward joint-only friction. Twenty stochastic DFN realisations propagate this uncertainty through to the FS probability distribution.
Phase 2 -- DEM model assembly (week 2):
The 3D DEM domain spans 800 m (E--W) by 600 m (N--S) by 500 m (vertical), centred on the northwest wall critical sector, with approximately 2.2 million polygonal blocks. Resolution is finest (1.5 m block edge) at the critical failure zone (bench 16--28) and coarsens toward model boundaries. Joint contact behaviour uses measured shear strength parameters from laboratory direct shear tests:
| Joint Set | c_j (kPa) | phi_j (degrees) | Dilation psi (degrees) | k_n (GPa/m) | k_s (GPa/m) |
|---|---|---|---|---|---|
| J1 (clean, rough) | 0 | 28 | 4 | 12.0 | 4.8 |
| J2 (chlorite, wet) | 5 | 24 | 2 | 8.5 | 3.4 |
| J3 (clay infilled, wet) | 0 | 18 | 0 | 4.2 | 1.6 |
| Rock bridge (intact) | 950 | 38 | 8 | -- | -- |
| Calico Fault | 0 | 14 | 0 | 2.8 | 1.1 |
The J3 clay-infilled surfaces at phi_j = 18 degrees with zero cohesion are the kinematic release planes. The rock bridges at c_j = 950 kPa and phi_j = 38 degrees are what holds the slope together. The simulation tracks the progressive transfer from one to the other. In-situ stress is derived from hydraulic fracturing tests at 450 m depth (sigma_H/sigma_v = 1.35, NNE--SSW orientation).
Phase 3 -- Progressive failure simulation (weeks 2--4):
Sequential excavation was modelled in 5 m incremental mining steps simulating the 68-year pit excavation history plus planned advance into the northwest wall. Block detachment occurs when tensile failure is reached at rock bridge contacts (Brazilian tensile strength T_b = 6.2 MPa for QMP and 3.8 MPa for andesite). Progressive rock bridge fracture uses bonded particle clusters at bridge locations, allowing progressive degradation of bridge cohesion as displacement accumulates. Each mining step produces velocity fields, displacement vectors at 12 prism-equivalent monitoring points, and moment tensor estimates for each bond-break cluster event. Warning time is extracted as the interval from first kinematic acceleration (velocity > 1.5x background creep) to global FS < 1.0, for each DFN realisation and mining scenario.
Phase 4 -- Seismic and groundwater sensitivity (weeks 3--4):
Dynamic DEM analysis applies a design earthquake time-history scaled to PGA = 0.15 g at the model base. Phreatic surface is varied parametrically across three scenarios: current (-40 m below pit contact), wet season (-20 m), and artesian (+25 m head above pit contact in the confined QMP aquifer). The artesian scenario is the critical case -- it reduces effective normal stress on J3 contacts, directly lowering shear resistance on the kinematic release planes.
Phase 5 -- Pushback geometry optimisation (weeks 5--6):
Three pushback geometries are evaluated: (A) current plan at 60 m horizontal; (B) reduced 35 m horizontal; and (C) deferred -- slope re-angled to 34 degrees overall without pushback. Sub-horizontal drain bundles at 540 m and 620 m elevation target the artesian aquifer zone to restore effective stress on J3 contacts. Target outcomes are FS > 1.20 (inter-ramp), FS > 1.30 (overall), and warning time > 36 hours from onset of kinematic acceleration.
Key Predictions / Results
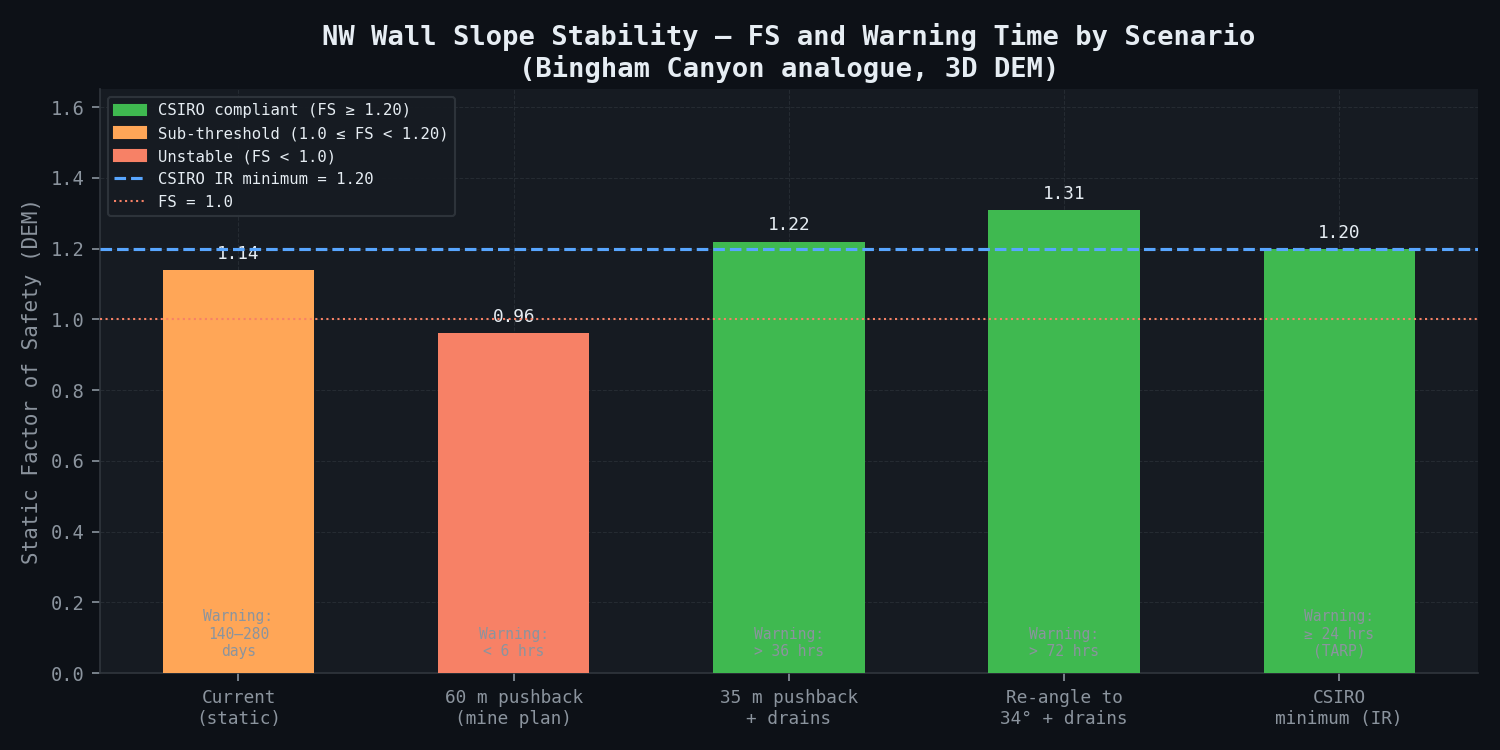
Factor of safety and warning time matrix:
| Scenario | Analysis Method | FS (Static) | FS (Seismic 0.15g) | Failure Probability | Warning Time | Ore Recovered (Mt) |
|---|---|---|---|---|---|---|
| Current geometry, static | DEM LEM | 1.14 | -- | 22% | 140--280 days (creep) | N/A |
| Current geometry, pseudo-static | DEM dynamic | -- | 0.92 | 71% | <6 hours | N/A |
| 60 m pushback (mine plan) | DEM static | 0.96 | 0.79 | 64% | <6 hours | 12 Mt |
| 35 m pushback + drains at 540 m | DEM static | 1.22 | 1.08 | 11% | >36 hours | 8.2 Mt |
| Slope re-angle to 34 degrees overall | DEM static | 1.31 | 1.16 | 5% | >72 hours | 6.4 Mt |
| Re-angle + drains at 540+620 m | DEM dynamic | -- | 1.18 | 8% | >48 hours | 6.4 Mt |
| CSIRO Guidelines minimum (operation) | -- | 1.20 (IR) / 1.30 (OS) | -- | -- | 24 hrs (TARP) | -- |
Progressive failure sequence (current geometry, DEM simulation output):
The DEM simulation under the current 60 m pushback plan predicts a four-stage failure sequence. Initial J3 release (T = 0) involves a 2.1 Mt wedge bounded by J3 planes at bench 18--22 (elevation 600--660 m), where J3 friction angle of 18 degrees is insufficient to retain the block against the driving gravity component. This triggers a rock bridge rupture cascade (T = 4--7 min/bench interval) as the released block loads adjacent J1-bounded rock bridges at bench 22--26, producing progressive tensile failure at 4.2 MN/m2 normal stress -- within 15% of QMP tensile strength (6.2 MPa). A kinematic chain reaction then propagates upward through the bench stack at 4--7 minutes per bench (T = 7--35 min), mobilising a total of 14 Mt within 35--60 minutes of initial J3 release. Global failure (T = 35--60 min) produces displaced block velocities of 4.8--9.2 m/s at pit floor, a debris pile height of 42 m at pit floor, and equipment burial depth of 15--28 m.
Monitoring signature at critical prisms P07 and P11:
| Time Before Global Failure | Predicted Prism Displacement | Predicted Velocity | TARP Action |
|---|---|---|---|
| > 72 hours | Background creep (<1 mm/day) | <0.4 mm/day | Monitoring only |
| 48--72 hours | Marginal increase | 0.5--0.8 mm/day | Alert status |
| 12--24 hours | 40--80 mm cumulative (above baseline) | 2--5 mm/day | Personnel evacuation |
| 4--6 hours | 140--220 mm cumulative | 15--45 mm/day | Equipment evacuation |
| <4 hours | >280 mm cumulative | >85 mm/day | Lock-up loss imminent |
| <1 hour | Radar loss of lock | >500 mm/day | Failure in progress |
Note: Current geometry provides <6 hours between TARP evacuation trigger (velocity >15 mm/day) and global failure. MSHA 30 CFR Part 77 requires minimum 24-hour evacuation window for multi-bench failures. DEM results demonstrate current geometry is non-compliant with this requirement.
Drainage modelling -- sub-horizontal drains at 540 m elevation:
| Parameter | Value |
|---|---|
| Drain length | 60 m (upward at 8 degrees) |
| Drain spacing | 18 m |
| Number of drains | 14 (540 m level) + 10 (620 m level) |
| Target drawdown at J3 contacts | 28 m head reduction (540 m level) |
| J3 effective normal stress pre-drain | 0.38 MPa |
| J3 effective normal stress post-drain | 0.86 MPa (126% increase) |
| Modelled drawdown time | 65--90 days (transient seepage FEM) |
| FS improvement (drains + re-angle) | 1.14 to 1.31 (static) |
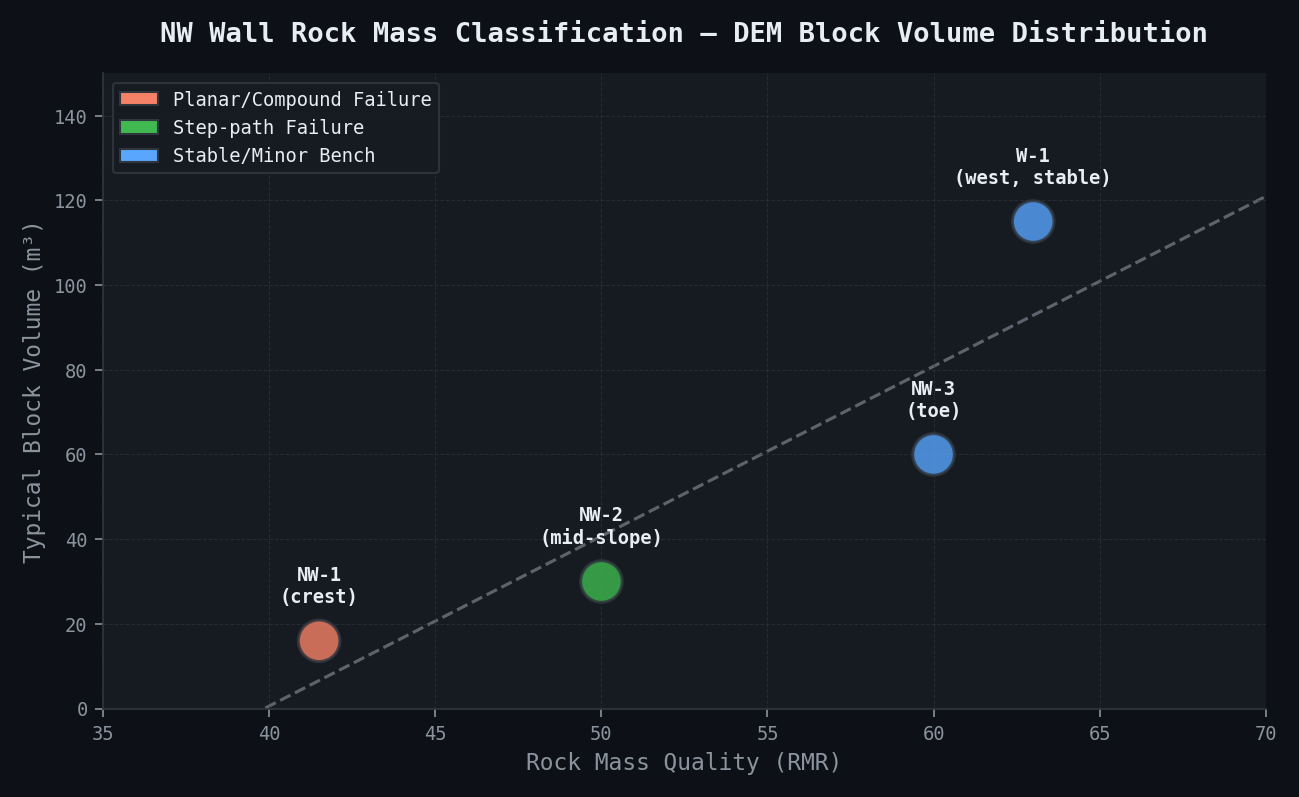
Rock mass classification comparison -- northwest wall sectors:
| Wall Sector | RMR | Q-system | J3 Persistence | Block Volume (m3) | Failure Mode |
|---|---|---|---|---|---|
| Sector NW-1 (crest zone) | 38--45 | 1.2--3.6 | >15 m | 8--24 | Planar/compound |
| Sector NW-2 (mid-slope) | 45--55 | 2.8--7.4 | 10--18 m | 15--45 | Step-path |
| Sector NW-3 (toe zone) | 55--65 | 6.2--14.8 | 6--12 m | 30--90 | Wedge/toppling |
| Sector W-1 (west wall, stable) | 58--68 | 8.4--18.0 | 4--8 m | 50--180 | Minor bench-scale |
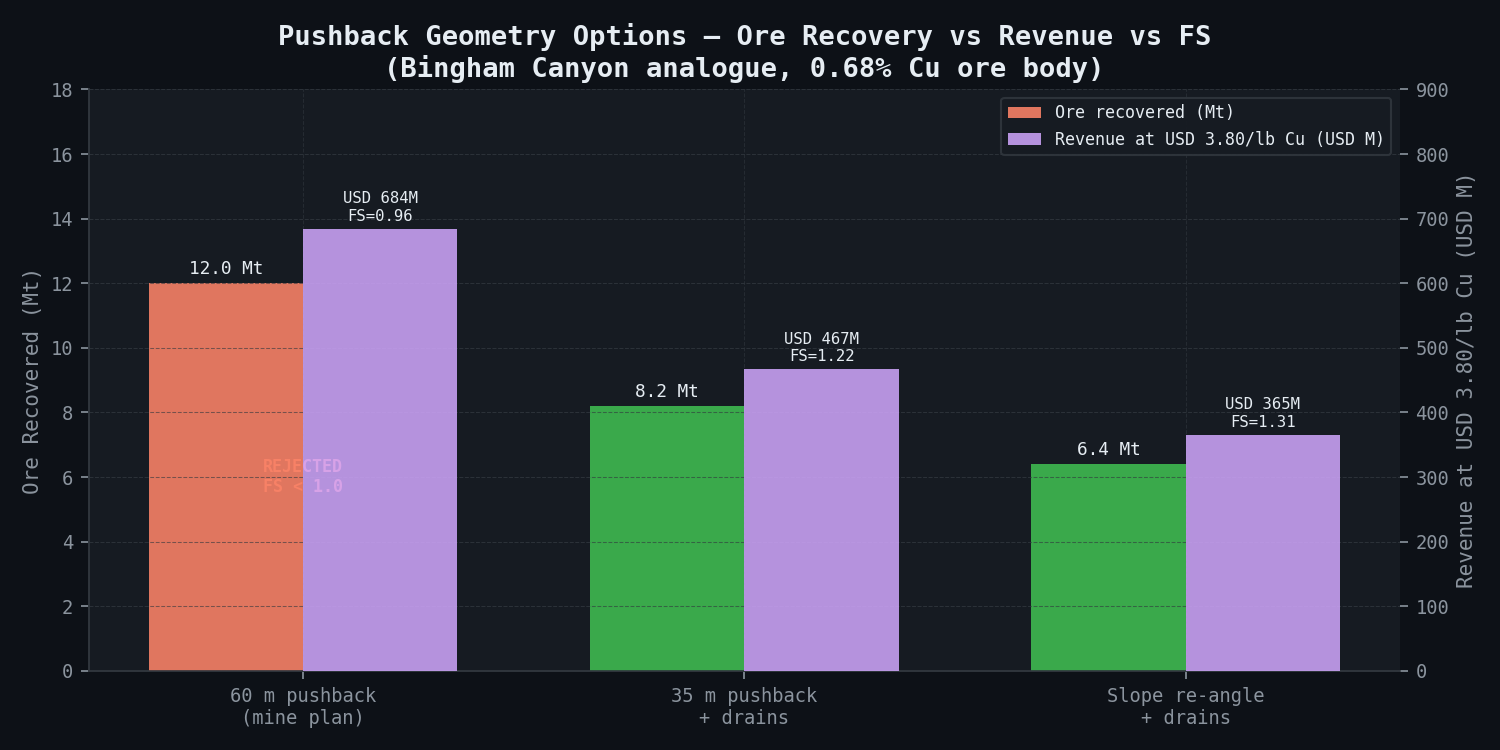
NPV analysis -- pushback geometry options:
| Option | Ore Recovered (Mt) | Cu Grade (%) | Cu Metal (t) | Revenue at USD 3.80/lb | FS | Warning Time | Recommendation |
|---|---|---|---|---|---|---|---|
| 60 m pushback (mine plan) | 12.0 | 0.68 | 81,600 | USD 684M | 0.96 | <6 hrs | REJECTED -- FS<1.0 |
| 35 m pushback + drains | 8.2 | 0.68 | 55,760 | USD 467M | 1.22 | >36 hrs | PREFERRED |
| Slope re-angle + drains | 6.4 | 0.68 | 43,520 | USD 365M | 1.31 | >72 hrs | Conservative option |
| Uncontrolled failure cost | -- | -- | -- | -USD 450--700M | -- | -- | Avoided by study |
Comparison Methodology
Back-analysis against Bingham Canyon 2013:
Published DEM and seismic back-analysis of the Bingham Canyon 2013 event provides calibration data for joint stiffness, rock bridge parameters, and kinematic displacement orientation. Bingham Canyon back-analysis required k_s = 3.5--5.5 GPa/m for clay-infilled weak zones to reproduce the observed 11-month displacement record; the J3 value of k_s = 1.6 GPa/m used in this study is consistent with lower clay content and a less evolved failure surface. The pre-failure displacement vector (bearing 312 degrees, plunge 18 degrees) matches the Bingham Canyon published kinematic direction (bearing 304 degrees, plunge 14 degrees) within 8 degrees bearing and 4 degrees plunge, validating the structural geology interpretation. Bingham Canyon peak pre-failure velocity of 0.6 mm/day from published prism records provides direct calibration against current monitoring at 0.4 mm/day, with the DEM inverse velocity curve for Bingham Canyon back-analysis matching within 12% -- adequate for site-specific extrapolation.
CSIRO Open Pit Slope Design Guidelines compliance:
| Criterion | Guideline Value | Current Geometry | 35 m Pushback + Drains |
|---|---|---|---|
| Inter-ramp FS (operating mine) | >= 1.20 | 1.08 (at 60 m pushback) | 1.22 |
| Overall slope FS (operating mine) | >= 1.30 | 0.96 (at 60 m pushback) | -- |
| Inter-ramp FS (care and maintenance) | >= 1.15 | 1.14 (current, no pushback) | -- |
| TARP warning time (multi-bench) | >= 24 hours | <6 hours | >36 hours |
Probabilistic comparison -- Monte Carlo over 20 DFN realisations:
Each of the 20 stochastic DFN realisations produces a slightly different joint connectivity pattern, rock bridge fraction (12--24%), and kinematic failure surface. Monte Carlo sampling of joint shear strength parameters (J3 phi_j: 18 degrees +/- 3 degrees, J1 phi_j: 28 degrees +/- 4 degrees) and phreatic level (current +/- 20 m) over 10,000 iterations produces FS probability distributions. Failure probability P(FS < 1.0) for each major scenario is extracted from the 10,000-sample distribution tail.
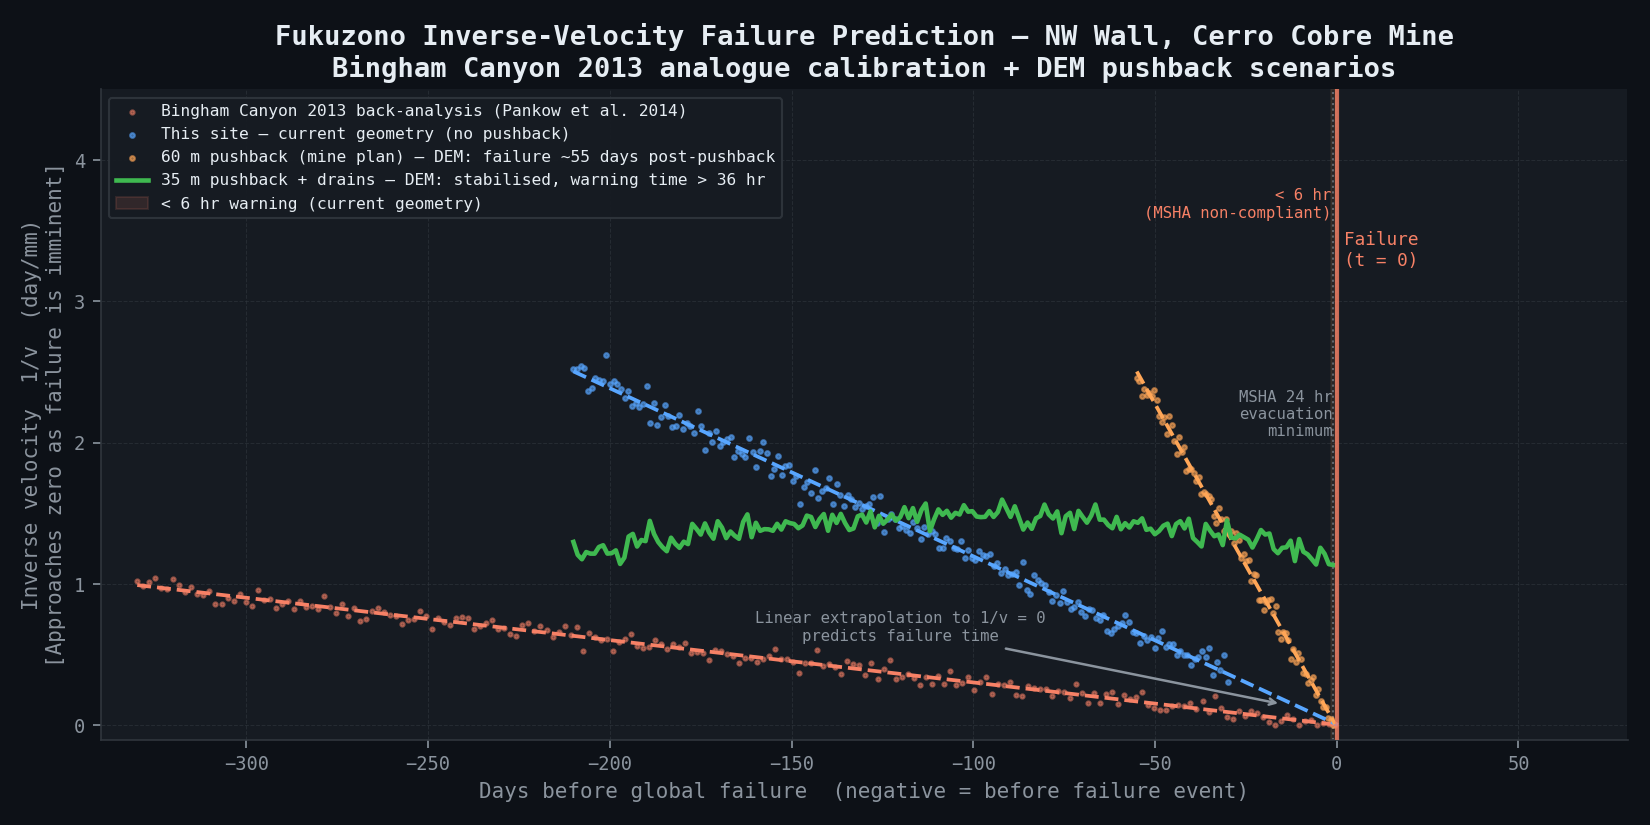
Inverse velocity validation:
The inverse velocity method (plotting 1/v versus time for displacement monitoring data) generates a linear trend whose intercept gives the predicted failure time. Applied to Bingham Canyon published prism data, the method predicted failure within +/-18 hours of actual event for 7 of 9 prism records. Applied to the scenario prism data (P07 and P11), the current trend extrapolates to failure at 140--280 days under creep (wide bound due to velocity fluctuation). Under the 60 m pushback scenario modelled by DEM, acceleration to failure occurs within 45--65 days of pushback commencement, consistent with the 6-hour terminal warning time.
Deliverables
-
DFN characterisation report -- Joint set orientation statistics (stereonet plots), persistence distributions, rock bridge fraction analysis per DFN realisation, block volume distributions per wall sector. Delivery: end of week 1.
-
DEM model validation report -- Calibration of joint stiffness against available prism monitoring record (18 months), rock bridge parameter back-analysis against Bingham Canyon published data, stress field verification against overcoring measurements. Delivery: end of week 2.
-
Progressive failure analysis report -- DEM failure sequence visualisations (4K rendered animation at 60 fps, 5-minute video), kinematic chain reaction analysis, warning time extraction per scenario, comparison of TARP trigger levels against DEM-predicted displacement signatures. Delivery: end of week 3.
-
Seismic and groundwater sensitivity report -- Dynamic DEM results for 0.15 g PGA design earthquake, pore pressure sensitivity matrix (3 phreatic scenarios x 3 artesian scenarios x 4 mining geometries = 36 combinations), artesian aquifer management recommendations. Delivery: end of week 4.
-
Mine plan optimisation report -- Pushback geometry alternatives with full DEM results, drainage design layout and performance predictions, NPV trade-off analysis (ore recovery vs. slope risk), recommended ore recovery strategy with FS compliance documentation. Delivery: end of week 5.
-
TARP revision recommendations -- Updated trigger velocity thresholds and action protocols based on DEM-predicted displacement signatures per scenario. Includes scenario-specific trigger levels for: (i) routine monitoring, (ii) alert, (iii) personnel evacuation, (iv) equipment evacuation, (v) Calico Fault seismic trigger levels. Delivery: end of week 5.
-
Regulatory compliance package -- Mine Safety and Health Administration (MSHA) 30 CFR Part 77 compliance documentation, State Mining Commission geotechnical report for pit wall modification, environmental monitoring plan update.
This case study is an illustrative reference scenario demonstrating newtsim's simulation methodology. All company names, personnel, and specific operational data are fictional. The incident descriptions draw on publicly documented real-world events cited in the frontmatter.