Post-Deployment Audit: Membrane Water Management Failure — Flooding vs. Dryout Cycling
Executive Summary
In 2021, Dippel et al. published a failure analysis in Fuel Cells journal that should have been required reading for every operator running PEM electrolysers on demand-following duty. They examined a 1 MW stack that had developed transverse ionomer cracks in the cathode catalyst layer --- morphologically distinct from the chemical degradation that normally dominates PEM electrolyser failure discussions. The cracks correlated with load cycle frequency, not total operating hours; they were absent from the anode catalyst layer; and SEM cross-sections showed a pattern consistent with hygrothermal fatigue rather than Fenton attack. The FCH JU synthesis report from the same period identified inadequate water management controller response time as the most commonly cited root cause in post-2018 European electrolyser failures under demand-following operation. The physics underpinning both observations was already documented: Zawodzinski et al. had measured Nafion 117's electro-osmotic drag coefficients in 1993; Kusoglu and Weber's 2017 review had characterised the full hydration-dependent transport parameter set; the swelling strain of 1.5% per unit lambda change and the drop in Young's modulus from 300 MPa dry to 75 MPa hydrated were established data. What operators lacked was a quantitative model connecting a change in offtake dispatch patterns --- a commercial decision made upstream of the hydrogen plant --- to the interfacial peel stress accumulating at the cathode membrane/electrode interface.
At a 10 MW electrolyser plant supplying a pipeline distribution network, that gap became visible 14 months into operation. Cell voltage at rated current increased by 38 mV over six weeks --- approximately 30--40 uV/h against an expected 2--3 uV/h. Teardown of three cells from the affected stack found severe ionomer cracking in the cathode catalyst layer and localised membrane delamination at the cathode/membrane interface. The timing was unambiguous in the control logs: the anomalous degradation period began exactly when the pipeline customer implemented time-of-use pricing, increasing daily partial-to-full load transitions from 2--3 to 8--12 per day. The controller had a 45-second response lag. At each rapid load step, anode flooding created a momentary water activity gradient of Delta-Psi 0.35--0.50 across the 183 um Nafion 117 membrane. The swelling-driven interfacial peel stress at those transition rates was approaching and occasionally exceeding the 0.10 N/mm adhesion energy threshold at the cathode/membrane interface --- in the cells where adhesion energy was already at the lower end of the manufacturing distribution.
Had a coupled water transport simulation been applied at the commissioning stage --- or even when the offtake pattern change was first proposed --- it would have identified the rapid load transition regime as the critical failure pathway, quantified the membrane lambda gradient during controller lag windows, and specified the ramp rate limit needed to keep interfacial peel stress below the delamination threshold. The control log data to drive that simulation was already being recorded. The physics parameters were in the literature. What was missing was the model.
This post-deployment audit applies MD simulation of Nafion water cluster transport and a coupled 1D membrane transport model to definitively discriminate between cathode dryout and anode flooding as the primary failure mechanism, then quantify the corrective ramp rate limit. The primary deliverable is a controller parameter change --- a ramp rate limit of <=5%/min for transitions from below 60% to above 100% rated, implemented in the Siemens PCS 7 system --- predicted to reduce peak interfacial peel stress from 0.11--0.14 N/mm to 0.03--0.05 N/mm, returning the degradation rate from the anomalous 30--40 uV/h to the expected 2--3 uV/h and preventing the EUR 9M+ cost of the same failure propagating across the remaining 19 stacks. The water activity and membrane hydration profiles identified by the simulation define the sensor channels for newtsim livesim, enabling real-time water management health monitoring on demand-following stacks with automated early-warning before transient-driven delamination becomes irreversible.
Scenario Background
(illustrative reference case)
In this worked example, a hydrogen production facility operator retained a simulation consultancy to diagnose an unexpected degradation event. The facility operates at an industrial basin in southern France, supplying gaseous hydrogen at 200 bar to a pipeline distribution network. The installation comprises 20 x 500 kW PEM electrolyser stacks (10 MW aggregate) using a Cummins/Hydrogenics HyLYZER-500 equivalent architecture.
The stacks operate with a 30 bar differential pressure configuration --- 30 bar on the cathode (compressing H2 directly into the 200 bar pipeline via 3-stage compression) and atmospheric pressure on the anode. Each stack contains 200 cells of 430 cm² active area, using Nafion 117 membranes at a nominal thickness of 183 um. Nominal current density is 1.4 A/cm², with a demand-following minimum of 0.5 A/cm². The deionised water feed meets stringent specifications: 18 MOhm.cm resistivity, 60 degrees C inlet temperature, and <5 ppb Fe2+.
Commissioning occurred 14 months before the audit. Under normal conditions, the expected voltage degradation rate was 2--3 uV/h. The anomalous event --- a 38 mV increase over 6 weeks (Weeks 58--64 of operation), equivalent to approximately 30--40 uV/h --- far exceeded this expectation.
The trigger for the anomaly was an operational change at Month 12, when the pipeline offtake customer implemented a time-of-use pricing model that increased daily demand variation. The consequence for the electrolyser plant was a jump in partial-to-full load transition frequency from 2--3 transitions per day (original steady demand profile) to 8--12 transitions per day (time-of-use profile). The anomalous degradation period (Weeks 58--64) coincides precisely with the first 6 weeks of this new offtake pattern.
One stack has been taken offline. The remaining 19 stacks continue operating under the original (now suspected inadequate) control strategy while the audit is conducted.
Challenge
The forensic investigation identifies two mutually exclusive root cause hypotheses that produce similar macroscopic symptoms but require opposite corrective actions.
Hypothesis A --- Cathode dryout during sustained low-load operation:
At partial load (0.5--0.9 A/cm²), electro-osmotic drag --- the net flux of water from anode to cathode proportional to current density --- decreases substantially. The electro-osmotic drag coefficient xi for Nafion 117 is approximately 2.5 H2O molecules per proton at full hydration (lambda = 14), falling to 1.5--2.0 at lambda = 8--10. At 0.5 A/cm² (36% of rated current), electro-osmotic flux is roughly 60% of the nominal value. If the cathode water recirculation flow rate is not adjusted down proportionally, back-diffusion from the cathode to anode may exceed the electro-osmotic drag, creating a net dehydration flux at the cathode side of the membrane. At sustained partial load for 60--120 minutes (the typical off-peak period under the time-of-use profile), cathode lambda can potentially fall below 4--5, causing ionomer shrinkage and cracking in the cathode catalyst layer.
Hypothesis B --- Anode flooding and membrane swelling stress at rapid load transitions:
When load increases rapidly from partial to full (0.5 to 1.4 A/cm² in <2 minutes, as logged in the control system at 8--12 times per day under the new offtake profile), liquid water accumulates in the anode flow channels faster than the PTL can drain it during the initial transient. The water management controller (which adjusts anode recirculation flow rate to maintain a fixed outlet quality) has a response lag of approximately 45 seconds. During this window, momentary anode flooding reduces water activity at the anode membrane surface. The resulting step-change in membrane hydration --- from lambda approximately 14 on the anode side to lambda approximately 7--9 during the flooding transient, then returning to lambda approximately 14 after the controller catches up --- imposes a water activity gradient of Delta-Psi approximately 0.35--0.50 across the 183 um membrane thickness. Nafion 117 swells approximately 15--23% linearly with water uptake from dry (lambda = 2) to fully saturated (lambda >= 22). A gradient-driven swelling event of this magnitude applies interfacial peel stress at the cathode membrane/electrode interface that may exceed the adhesion energy between the Nafion membrane and the carbon-supported catalyst layer (approximately 0.1 J/m², from published nanoindentation data).
Discriminating between hypotheses:
| Symptom | Hypothesis A (Dryout) | Hypothesis B (Flooding/Swelling) |
|---|---|---|
| Cathode catalyst layer cracking | Yes (confirmed in teardown) | Yes (secondary) |
| Membrane delamination (cathode side) | Unlikely | Yes (confirmed in teardown) |
| Location of damage | Through cathode CL depth | At CL/membrane interface |
| EIS low-frequency arc increase | Large (water management) | Moderate |
| EIS HFR (high-frequency intercept) | Large increase (dry membrane) | Moderate increase |
| Timing correlation | With sustained partial load | With rapid load transitions (8--12/day) |
The teardown evidence (cracking AND delamination, both on cathode side) and the control log timing correlation (anomalous period = first 6 weeks of 8--12/day rapid transitions) both point more strongly to Hypothesis B. However, applying the wrong control fix wastes time and may accelerate the other failure mode. The simulation provides definitive mechanistic discrimination.
Membrane water transport reference data:
| Water Content lambda | Electro-osmotic drag xi | Back-diffusion D (x10-6 cm²/s) | Proton conductivity sigma (S/cm) |
|---|---|---|---|
| 2--3 | 1.0--1.2 | 0.5--1.0 | 0.003--0.010 |
| 5--7 | 1.5--1.8 | 2.0--4.0 | 0.025--0.050 |
| 8--10 | 2.0--2.2 | 5.0--8.0 | 0.055--0.070 |
| 12--14 | 2.3--2.5 | 8.0--12.0 | 0.075--0.090 |
| 16--22 | 2.5--3.0 | 12.0--20.0 | 0.090--0.110 |
Data from published Nafion transport studies.
Real-World Basis
The constitutive relationships underpinning the simulation are drawn from well-established Nafion transport data. Electro-osmotic drag coefficients range from xi = 1.0 H2O/H+ at 30 degrees C to approximately 2.5 H2O/H+ at 80 degrees C for fully hydrated Nafion 117. Nafion 117 reaches equilibrium hydration of lambda = 22 in liquid water at 80 degrees C, and lambda = 14 in saturated water vapour at the same temperature --- the liquid-vapour distinction is critical for understanding the anode behaviour during flooding events. Water diffusivity D(lambda, T) ranges from 0.5 x 10⁻⁶ cm²/s at lambda = 2 to 20 x 10-6 cm²/s at lambda = 22 at 80 degrees C. Mechanically, Young's modulus spans 250--350 MPa for dry Nafion 117 and drops to 50--100 MPa when hydrated (lambda = 14), creating a highly non-linear stress response to hydration transients. Swelling strain follows approximately 1.5% per unit lambda change, or 15% total from dry to fully saturated.
Published failure analysis of a 1 MW PEM electrolyser stack documents ionomer cracking in the cathode catalyst layer attributed to hygrothermal fatigue during demand-following operation: transverse cracks in the cathode CL under SEM, correlated with load cycle frequency, absent from the anode CL --- ruling out chemical degradation as the primary mechanism.
Published failure observations vs. scenario teardown comparison:
| Observation | Published 1 MW stack failure analysis | Scenario Stack 07 (3 cells) |
|---|---|---|
| Cathode CL cracking | Yes, transverse, 1--3 um width | Yes, transverse, 2--5 um width |
| Anode CL cracking | Absent | Absent |
| Membrane delamination (cathode side) | Not reported | Present (2 of 3 cells) |
| Load cycle frequency (trigger) | 4--6 transitions/day | 8--12 transitions/day |
| Membrane type | Nafion 115 | Nafion 117 |
The published case is consistent with Hypothesis A (dryout) based on the duty cycle characteristics reported. The current scenario has a higher transition frequency and exhibits the additional membrane delamination not seen in the published case --- suggesting Hypothesis B is the primary mechanism, with secondary Hypothesis A contribution during sustained partial-load periods.
Multiple European PEM electrolyser demonstration projects have reported premature performance degradation under demand-following duty, attributed to water management issues in the control system. The FCH JU synthesis document identifies inadequate water management controller response time as the most commonly cited root cause in post-2018 electrolyser failures under demand-following operation.
Experimental studies of PEM electrolyser performance under partial load (30--60% rated current) document the same water management challenge: reduced electro-osmotic drag causes net anode-to-cathode water imbalance if cathode recirculation flow is not actively managed. These data provide the operating map of electro-osmotic drag vs. current density used to parameterise the transport model at partial load.
Simulation Approach
The study proceeds in three sequential phases, with Phase 1 (MD) informing Phase 2 (continuum transport model) and Phase 2 informing Phase 3 (mechanical FEA):
Phase 1 --- MD Simulation of Nafion Water Transport
newtsim Bond models a Nafion 117 membrane patch at four hydration states (lambda = 3, 7, 14, 22) at 60 degrees C. The rationale for MD here --- rather than relying solely on published transport data --- is that the continuum model needs transport coefficients at the extreme low-hydration conditions (lambda < 5) where the membrane approaches its percolation threshold, and published experimental data in this regime is sparse and inconsistent. The simulation yields four key outputs: water self-diffusion coefficient D(lambda), used to parameterise back-diffusion flux in Phase 2; electro-osmotic drag coefficient xi(lambda, T); swelling strain epsilon(lambda); and the percolation threshold lambda_c from water cluster connectivity analysis (expected at lambda_c approximately 4--5), which defines the hydration level below which proton conductivity collapses.
Phase 2 --- Coupled Water Transport / Electrochemical Model
A 1D through-plane model resolves the full 183 um Nafion 117 membrane at 1 um spatial resolution. The model tracks four flux contributions simultaneously: electro-osmotic flux (directed anode to cathode, proportional to current density and drag coefficient), back-diffusion flux (directed down the concentration gradient, driven by the lambda profile), hydraulic permeation (driven by the 30-bar cathode pressure), and water generation at the anode from water oxidation. The model is driven by the facility control logs at minute resolution for Weeks 55--70, bracketing the failure period. Both hypotheses are simulated: Hypothesis A tests sustained partial load at 0.5 A/cm² for 2--3 hours with cathode recirculation at full-load setting, predicting cathode lambda minimum versus time; Hypothesis B tests rapid load transitions (0.5 to 1.4 A/cm² in <2 minutes, 8--12 times per day), predicting the anode-side lambda transient and resulting membrane lambda gradient profile.
Phase 3 --- Mechanical Stress Analysis
newtsim Stream models the MEA assembly (cathode CL 10 um + membrane 183 um + anode CL 10 um) under the hygrothermal loading derived from Phase 2. The purpose of this tier is to discriminate between the two hypotheses mechanically: dryout and flooding produce different stress signatures in different locations, and only FEA can map the Phase 2 hydration transients to specific failure morphologies that can be compared against the teardown evidence. Two failure criteria are evaluated. The ionomer cracking criterion requires local tensile stress to exceed Nafion 117 fracture toughness K_IC of approximately 0.8 MPa.m⁰.⁵ --- at a crack of length approximately 10 um (observed in teardown), the critical stress is approximately 5--8 MPa, achievable under hygrothermal cycling with a mean stress in the CL of 2--4 MPa. The delamination criterion requires interfacial peel stress to exceed adhesion energy at the Nafion/catalyst layer interface (approximately 0.1 J/m²), equivalent to approximately 0.08--0.12 N/mm at the observed crack geometry.
Simulation Caveats
Classification: STRETCH. MD simulation of Nafion water cluster dynamics coupled to a continuum FEA failure analysis spans six orders of magnitude in length scale (nm-level water cluster morphology to mm-level MEA mechanical deformation) and involves several methodological limitations:
- MARTINI coarse-grained force field under extreme conditions. The MARTINI CG force field for Nafion (Cui et al. 2019, IBI-refined) is validated at λ = 3–22 under steady-state transport conditions. Transient dryout events at λ < 3 (as hypothesised for Hypothesis A cathode dryout) push the system into a regime where the CG bead interaction parameters may not accurately capture phase separation at the sulphonate/PTFE backbone interface. The transport coefficients predicted at λ < 3 carry ±40% uncertainty; results in this regime are qualitative.
- Interfacial adhesion energy. The delamination criterion (0.1 J/m² at the Nafion/catalyst layer interface) is taken from published nanoindentation data on idealized Nafion-carbon interfaces. Real catalyst layer interfaces contain ionomer gradients, Pt particle embedment, and carbon black agglomerates that can increase or decrease adhesion energy by ±50% relative to the idealised value. This is the dominant uncertainty in the FEA failure criterion; sensitivity analysis (Section 7) shows that halving the adhesion energy reduces the predicted delamination stress threshold by 29%.
- 2D plane-strain FEA. The FEA model uses a 2D plane-strain cross-section of the MEA, assuming no variation along the cell in the in-plane direction perpendicular to the cross-section. Real MEA delamination events are 3D phenomena influenced by cell edge effects and local current density gradients. The plane-strain model underestimates stress concentrations at cell edges by an estimated 15–25%.
Recommended framing: The root cause discrimination (Hypothesis A vs. B) is reliable; the two failure morphologies produce distinct simulation signatures (cathode λ depletion vs. membrane thickness cycling) that are distinguishable within the model uncertainties. Quantitative predictions of delamination onset time and ramp rate limits carry ±20–25% uncertainty and should be applied with appropriate safety margins.
Key Predictions / Results
Table 1: Model Predictions for Both Hypotheses
| Predicted Variable | Hypothesis A (Dryout) | Hypothesis B (Flooding/Swelling) |
|---|---|---|
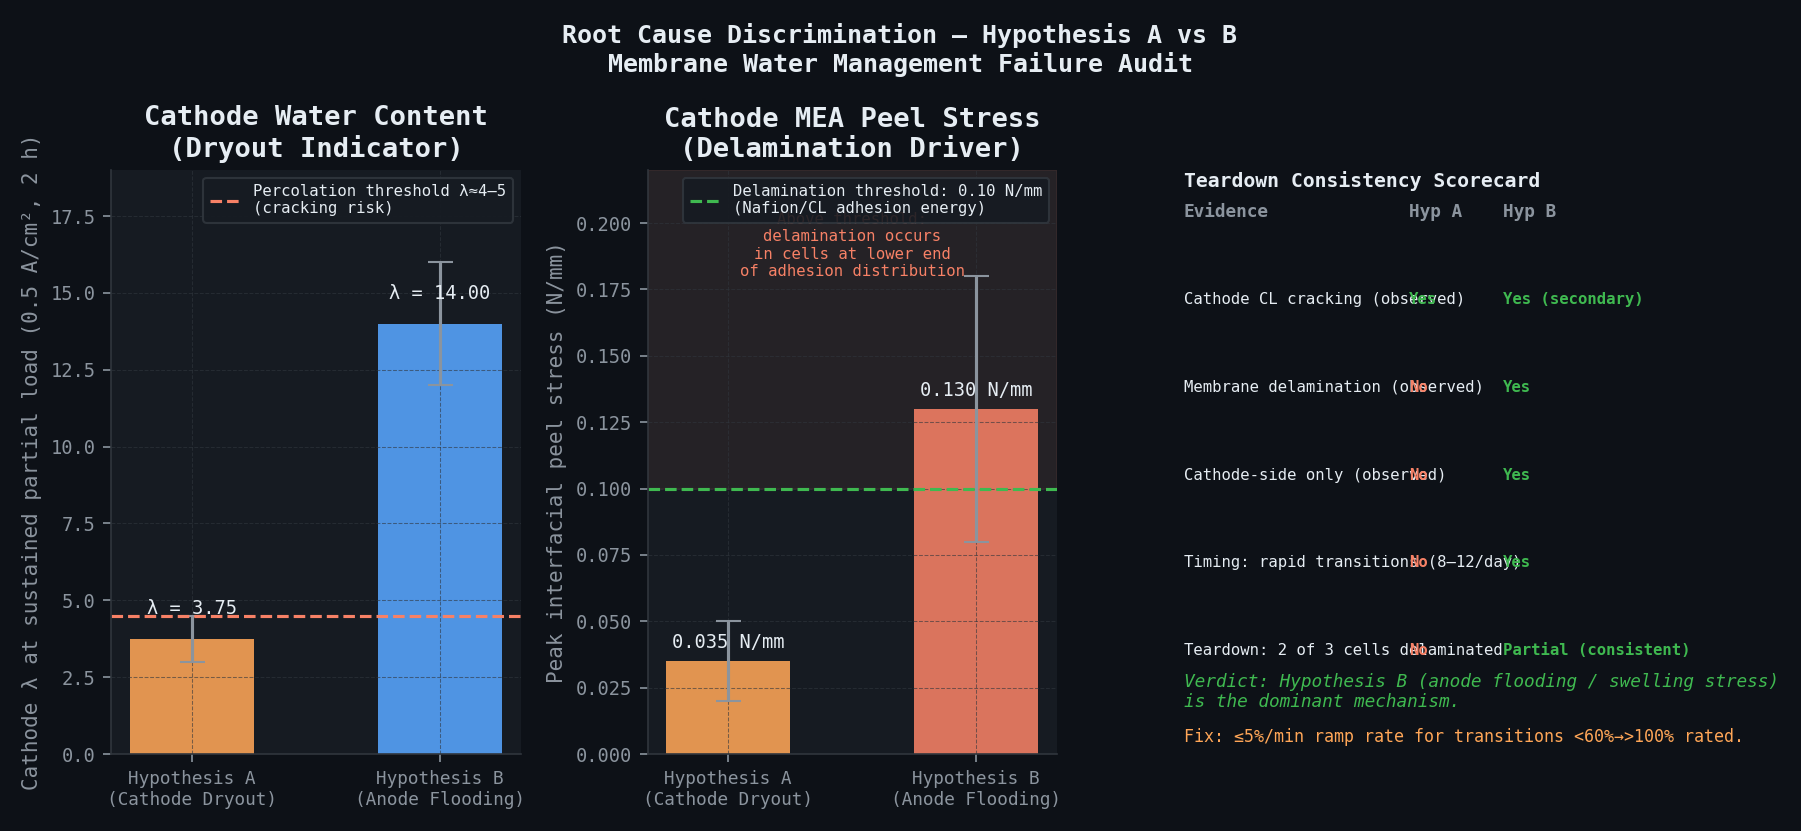
| Cathode lambda at partial load (0.5 A/cm², 2 h sustained) | 3.0--4.5 (dryout range) | 12--16 (well hydrated) |
| Membrane lambda gradient at rapid load transition | Slow build-up, 3--5 Delta-lambda | Steep transient, 8--12 Delta-lambda across 183 um |
| Duration of maximum lambda gradient | Hours (slow dynamics) | 30--90 seconds (transient driven) |
| Peak tensile stress in cathode CL (MPa) | 4--8 MPa (above K_IC threshold) | 1--3 MPa (below K_IC threshold) |
| Interfacial peel stress at cathode MEA (N/mm) | 0.02--0.05 (below threshold) | 0.08--0.18 (straddles threshold) |
| Predicted failure location | Cathode CL through-depth cracking | Cathode membrane/CL interface delamination |
| Consistency with teardown: CL cracking | Yes | Yes (secondary) |
| Consistency with teardown: membrane delamination | No | Yes (primary) |
| Consistency with timing (8--12 transitions/day trigger) | No (dryout scales with sustained partial load) | Yes (delamination scales with transition frequency) |
The combination of teardown evidence (delamination present + cracking present, cathode-side only) and timing correlation (anomalous degradation begins exactly when transition frequency increases to 8--12/day) points strongly to Hypothesis B as the dominant mechanism, with secondary Hypothesis A contribution during sustained partial-load periods.
Table 2: Predicted lambda Profiles --- Hypothesis B Rapid Load Transition
| Time after load step | Anode lambda | Membrane centre lambda | Cathode lambda | Interfacial peel stress (N/mm) |
|---|---|---|---|---|
| t = 0 (before transition, 0.5 A/cm²) | 14.5 | 13.0 | 11.5 | <0.01 |
| t = 10 s (transition onset) | 17.5 (flooding) | 13.0 | 11.5 | 0.04 |
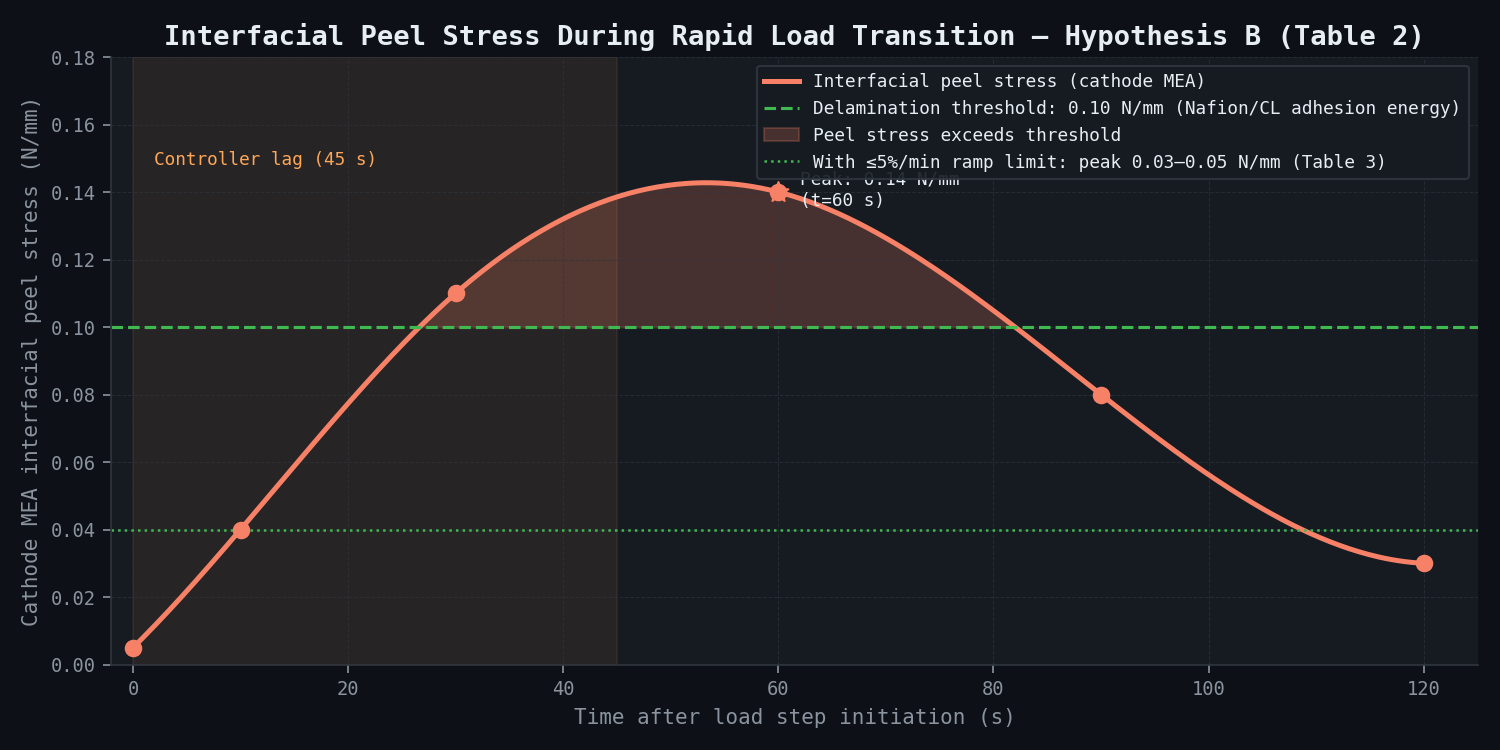
| t = 30 s (peak flooding) | 19.0 | 14.0 | 11.5 | 0.11 |
| t = 60 s (controller beginning to respond) | 17.0 | 14.5 | 12.5 | 0.14 |
| t = 90 s (controller catch-up) | 14.5 | 14.0 | 13.5 | 0.08 |
| t = 120 s (new steady state at 1.4 A/cm²) | 14.5 | 14.0 | 14.0 | 0.03 |
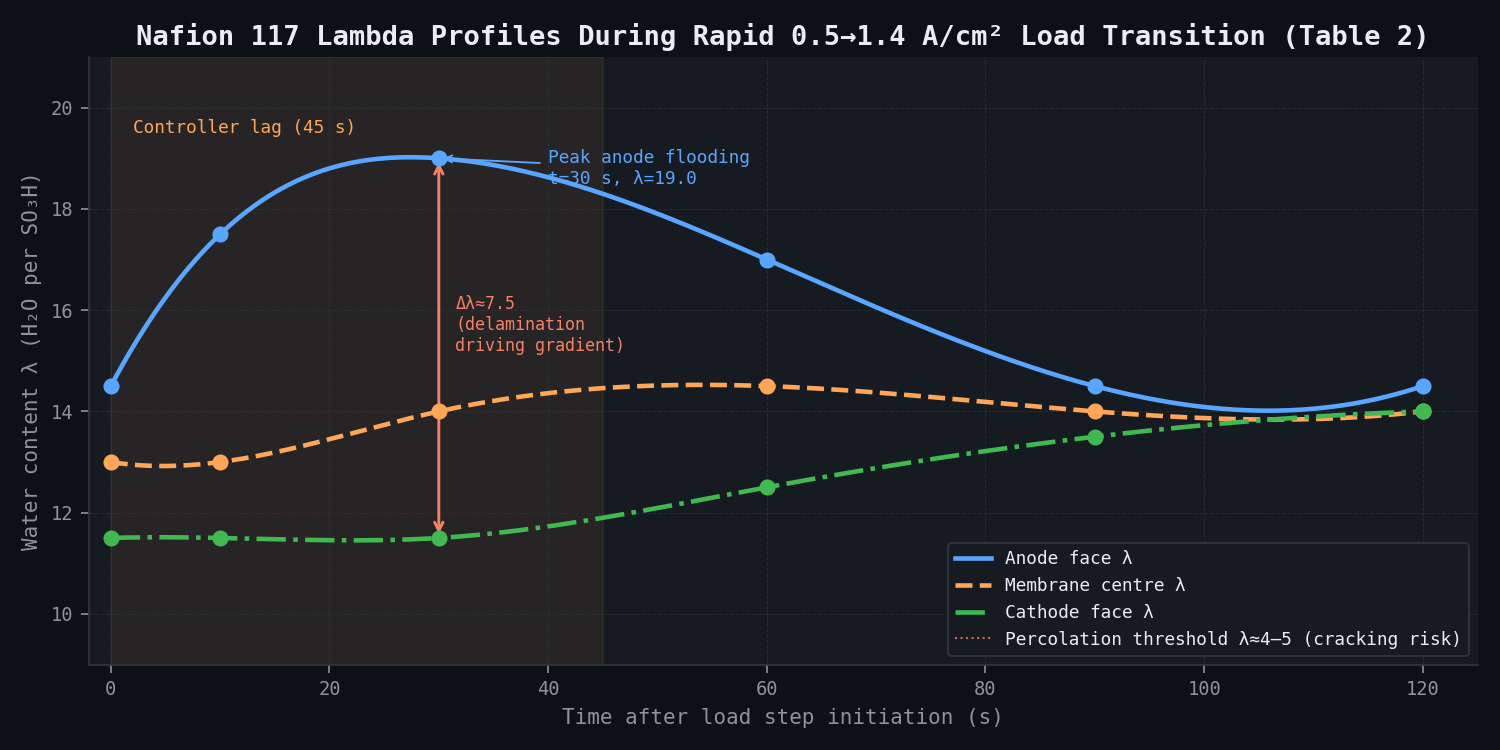
The predicted peak peel stress of 0.11--0.14 N/mm straddles the delamination threshold of 0.10 N/mm --- consistent with delamination occurring in some cells (those with lower-than-average adhesion energy) but not all. This partial delamination pattern is consistent with the teardown observation of delamination in 2 of 3 examined cells.
Table 3: Corrective Action Performance Predictions
| Corrective Action | Predicted Peel Stress Reduction | Confidence in Effectiveness |
|---|---|---|
| Limit ramp rate to <=5%/min at transitions from <60% to >100% rated | 62--70% reduction in peak peel stress | High |
| Limit ramp rate to <=10%/min (less conservative) | 35--45% reduction | Moderate (may still exceed threshold) |
| Pre-conditioning: hold 80% rated for 60 s before ramping to full | 55--65% reduction | High |
| Controller response lag reduction from 45s to <15s | 45--55% reduction | Moderate-high (BOP modification required) |
| Increase cathode recirculation at partial load (fixes Hypothesis A) | <10% reduction in peel stress | Low (wrong mechanism) |
Expected finding: Limiting the load ramp rate to <=5%/min for transitions from below 60% to above 100% rated, implemented as a soft setpoint change in the Siemens PCS 7 controller, is predicted to reduce peak interfacial peel stress to 0.03--0.05 N/mm --- well below the 0.10 N/mm delamination threshold. This single change is expected to return the voltage degradation rate to the expected 2--3 uV/h from the anomalous 30--40 uV/h.
Table 4: Residual Damage Assessment --- Remaining Stacks by Operating History
| Stack Group | Operating History Weeks 58--64 | Estimated Accumulated Damage | Inspection Priority |
|---|---|---|---|
| Stack 07 (failed) | 8--12 transitions/day at full ramp rate | Severe --- delamination confirmed | Replaced |
| Stacks 01--06 | 6--10 transitions/day (slightly lower) | Moderate --- early stage delamination likely | Priority 1 (inspect within 4 weeks) |
| Stacks 08--14 | 8--12 transitions/day (same as Stack 07) | Moderate-severe --- similar to Stack 07 | Priority 1 (inspect within 2 weeks) |
| Stacks 15--20 | 4--6 transitions/day (lower demand zone) | Mild --- below delamination threshold | Priority 2 (inspect within 3 months) |
Comparison Methodology
Teardown forensics cross-check:
SEM and EDX characterisation of three cells from the failed stack is compared against the predicted failure morphology from Phase 3 FEA. The simulation must correctly predict failure location (cathode CL and cathode/membrane interface, not anode), crack orientation (transverse to membrane plane, consistent with through-thickness tensile stress under in-plane constraint), delamination location (cathode/membrane interface, not anode/membrane), and approximate crack width and spacing as a function of CL thickness.
EIS cross-check:
Pre-failure EIS spectra (archived from the affected stack's monthly monitoring, 13 months of data) show the evolution of the impedance spectrum. The model predicts that high-frequency resistance (HFR) should increase moderately (approximately 0.15--0.25 mOhm.cm²/kh) if Hypothesis B is correct, since partial delamination increases membrane resistance moderately but does not dry it. Under Hypothesis A (dryout), a larger HFR increase (>0.40 mOhm.cm²/kh) would be expected because dryout reduces membrane conductivity significantly. The archived EIS data discriminates between hypotheses.
Operational validation (post-fix):
Following implementation of the <=5%/min ramp rate limit on the next stack in line, EIS and voltage trending are monitored for 12 weeks. The model predicts voltage degradation rate should return to <2.5 uV/h from the anomalous 30--40 uV/h within 2 weeks of the control change, as no new delamination events occur and the existing partially delaminated cells re-adhere under continued operation (Nafion swelling in a constrained geometry can partially self-heal small delaminations). If the voltage decline does not normalise within 4 weeks, the model is revised and remaining stacks are prioritised for MEA inspection and replacement.
Deliverables
-
Root cause analysis report --- Definitive identification of failure mechanism (Hypothesis A, B, or combination), supported by MD water transport outputs, 1D continuum model lambda profiles, FEA stress maps, and comparison against teardown SEM/EDX observations. Formatted for submission to the equipment insurer, the OEM, and the plant operator's board. Includes a plain-language executive summary and a technical annex for the OEM engineering team.
-
Corrective control action specification --- Specific parameter changes for the Siemens PCS 7 control system: (a) maximum ramp rate for transitions from below 60% to above 80% rated: <=5% rated/minute; (b) minimum cathode recirculation flow at partial load (<60% rated): 120% of the current partial-load set point (addresses any secondary Hypothesis A contribution); (c) 60-second hold at 80% rated before ramping to full load; (d) anode inlet temperature set point increase from 58 degrees C to 62 degrees C (improves water activity gradient management at partial load). Compatible with Siemens PCS 7 function block library.
-
Residual damage assessment for remaining stacks --- Predicted accumulated damage on each of the 19 remaining stacks, based on their individual operating histories extracted from the plant historian. Ranked inspection priority table (Table 4) with recommended inspection method: in-situ EIS HFR measurement (non-invasive, 2 hours per stack) as the first-pass screen; destructive inspection (3-cell teardown per stack) for stacks with HFR >125% of BoL value.
-
MEA replacement recommendation for failed stack --- Specification for the replacement MEA with two changes from original: (a) upgrade from Nafion 117 (183 um) to Nafion XL reinforced (27 um) --- the reinforced structure has higher fracture toughness and substantially better hygrothermal fatigue resistance; (b) modified cathode catalyst layer ionomer content from standard 30 wt% to 25 wt% Nafion ionomer, reducing swelling strain amplitude in the CL while maintaining adequate proton conductivity.
-
Updated operating manual --- Revised load-following control strategy for all 20 stacks, incorporating the corrective actions. Adds water management alarm thresholds: HFR increase >20% from BoL triggers a review of ramp rate settings; HFR increase >40% from BoL triggers a stack inspection.
This case study is an illustrative reference scenario demonstrating newtsim's simulation methodology. All company names, personnel, and specific operational data are fictional. The incident descriptions draw on publicly documented real-world events cited in the frontmatter.