Stack Lifetime Projection for a 100 MW PEM Electrolyser from Accelerated Stress Test Data
Executive Summary
The HyBalance project at Hobro, Denmark accumulated approximately 18,000 operating hours between 2016 and 2021 with a 1.2 MW Hydrogenics PEM electrolyser running primarily on grid-balancing dispatch --- the most thoroughly documented PEM electrolyser operational dataset in the public domain. The FCH JU final report is candid: voltage degradation ran at 3.0--4.5 uV/h under dynamic duty, cell-to-cell voltage non-uniformity within the stack grew from 3 mV to 12 mV over 18,000 hours, and high-frequency resistance increased at 0.12--0.18 mOhm.cm²/kh --- all consistent with coupled membrane thinning and PTL passivation at a rate that, extrapolated naively to 80,000 hours, would imply stack replacement well before the intended end of life. Yet when infrastructure investors and operators began financing 100 MW facilities against 15-year offtake contracts, the question of what those 18,000 hours at 1 MW and 15 bar implied for 5 MW stacks at 35 bar under a 60% baseload plus 30% grid-balancing duty went formally unanswered. The OEM's warranty covered 80,000 hours at rated steady-state conditions and explicitly excluded the specific duty cycle. Operating pressure at 35 bar increases H2 crossover by a factor of approximately 2.3 versus HyBalance conditions, directly increasing the H2O2 generation and Fenton degradation rates that drove the HyBalance numbers. A project financier committing EUR 180M in debt has exposure to a P10/P50 OPEX differential of EUR 33--46M over 15 years depending on whether stacks fail at 55,000 or 72,000 hours. That differential was, until physics-based modelling was applied, entirely unquantified.
The data that would have closed this gap was available. The HyBalance quarterly EIS measurements provided 18 calibration points. Nel Hydrogen's AST protocols, Siracusano et al.'s IrO2 dissolution kinetics, Rakousky et al.'s mechanism decomposition, and the IEA's CAPEX/OPEX data all existed in the literature. What was missing was integration into a validated, bankable lifetime projection with explicit uncertainty bounds that a financing committee could evaluate.
Had a coupled electrochemical degradation simulation been applied at the project financing stage, it would have identified membrane chemical degradation as the dominant mechanism (Sobol index 0.38--0.45), quantified the 35-bar pressure correction to HyBalance degradation rates, integrated the four coupled failure mechanisms --- membrane thinning, IrO2 ECSA loss, Pt sintering, Ti PTL passivation --- into a voltage rise trajectory, and projected the first stack replacement at P50 of 72,000--85,000 hours with P10/P90 bounds of 55,000 and 88,000 hours respectively. The P10 vs P50 LCOH differential of EUR 0.35--0.40/kg H2 would have been expressed in the project financial model before financial close, not discovered during operations.
This study delivers that projection: a 10,000-sample Monte Carlo simulation anchored to the HyBalance calibration dataset, validated against the OEM's 12,000-hour AST data, and certified by TUV Sud for financier use. The dominant mitigation finding --- feed water ion-exchange polishing to below 2 ppb Fe2+ extends P50 lifetime by 8,000--15,000 hours per stack at a capital cost of EUR 150,000 --- is recoverable against avoided stack replacement OPEX within the first replacement cycle. The degradation signatures identified by the simulation --- HFR evolution, IrO2 ECSA loss trajectory, PTL contact resistance trending, and fluoride emission rate profiles --- define the sensor channels for newtsim livesim, enabling continuous stack health assessment throughout the 15-year project life with automated alerts before voltage rise crosses replacement thresholds.
Scenario Background
(illustrative reference case)
In this worked example, a chemical industry operator developing a 100 MW PEM electrolyser to supply green hydrogen to an adjacent ammonia plant retained a simulation consultancy to produce a bankable lifetime assessment for project financing. The facility is structured under a 15-year green hydrogen supply agreement at a fixed price indexed to a renewable electricity tariff from a Norwegian hydropower portfolio.
The installation comprises 20 x 5 MW stacks based on a Nel Hydrogen A485-equivalent platform, operating at 35 bar cathode pressure and 1.5 bar anode pressure with a nominal current density of 1.8 A/cm². The stacks use Nafion XL reinforced membranes (27 um nominal thickness) with approximately 380 cells per stack at approximately 1,500 cm² cell active area. The design lifetime target of 80,000 hours corresponds to the OEM warranty under steady-state conditions, but the project requires 108,000 cumulative operating hours over 15 years at 7,200 h/year (82% availability). Stack replacement is triggered when cell voltage degradation exceeds 5% from beginning-of-life at rated current.
The duty cycle comprises three distinct operating modes. Approximately 60% of operating hours are baseload at 1.8 A/cm² (100% rated output) supplying ammonia plant base demand. Roughly 30% of hours involve grid-balancing participation (Statnett FCR-D and aFRR markets) with current density varying between 0.5 and 2.16 A/cm² across 4--8 full-range cycles per day at ramp rates of +/-15%/minute. The remaining 10% is standby or hot standby at minimum current (0.2 A/cm²) or de-energised, consuming 3--5 kW per MW of stack capacity while awaiting demand signals.
The project financing (EUR 180M debt) requires the bankable lifetime assessment to meet the Clean Hydrogen Partnership's Electrolyser Durability Testing Protocol (2021) standards and TUV Sud certification of the methodology before financial close is permitted under the fund's green infrastructure investment policy.
Challenge
Five distinct technical challenges separate this lifetime projection from a simple OEM warranty extrapolation.
1. Test duration vs. required lifetime (7--9x extrapolation)
The OEM's longest continuous AST campaign is 12,000 hours, while the financier requires projections to 80,000--108,000 hours. Extrapolation across a 7--9x time multiplier using empirical curve-fitting is methodologically unsound because the degradation rate often changes character between short-duration and long-duration operation. Pt band formation, Ti passivation, and IrO2 sintering all exhibit non-linear temporal behaviour that cannot be captured by simple extrapolation from a 12,000-hour test. A validated physics model is required.
2. Duty cycle mismatch
Published AST data is predominantly at steady-state or standardised cycling protocols (e.g., DOE square-wave cycling: 1 minute at rated, 1 minute at 10% rated). The grid-balancing dispatch profile introduces 4--8 full-range cycles per day (0.5 to 2.16 A/cm²) --- 2--4x more aggressive than any published AST protocol in terms of daily cycle count and amplitude. The degradation contribution of this duty cycle cannot be read from published AST data without physics-based cycle-damage integration.
3. Coupled degradation mechanisms
Four degradation mechanisms contribute to cell voltage rise and interact with each other: membrane chemical degradation (Fenton-driven chain scission leading to thinning and HFR increase), catalyst layer ionomer dissolution (IrO2 and Pt/C catalyst accessibility loss), Pt/IrO2 catalyst sintering (ECSA loss via Ostwald ripening), and Ti PTL passivation (TiO2 surface growth causing contact resistance increase and ohmic voltage rise). Treating these mechanisms independently overestimates lifetime because the Pt band formation from Pt dissolution accelerates membrane degradation, and increased cell temperature from ohmic resistance rise due to PTL passivation accelerates all four mechanisms via Arrhenius scaling.
4. Uncertainty quantification for financial modelling
The project financier requires explicit P10/P50/P90 first-replacement dates and a Sobol sensitivity decomposition identifying which uncertain parameters dominate lifetime risk. A deterministic projection with no uncertainty bounds is not bankable under the fund's investment policy. The uncertainty decomposition also identifies which physical parameters --- such as feed water quality and duty cycle aggressiveness --- the project operator can control to improve the probability of reaching P90 lifetime.
5. HyBalance project comparability and scaling
The HyBalance project (1 MW Hydrogenics PEM electrolyser, Hobro Denmark, 2016--2021) is the most relevant public reference dataset for model calibration but differs on three critical parameters: scale (100x smaller), operating pressure (15 bar vs. 35 bar), and duty cycle composition (HyBalance operated primarily for grid-balancing demonstration, whereas the current project adds 60% baseload). Operating at 35 bar increases H2 crossover by a factor of approximately 2.3 versus 15 bar, directly increasing H2O2 generation and Fenton degradation rates. These scaling corrections must be physically justified.
Operating parameter comparison: HyBalance vs. project specification
| Parameter | HyBalance (Denmark) | Project Specification | Correction Factor |
|---|---|---|---|
| Stack rated power | 1 MW | 5 MW | 5x (scale) |
| Operating pressure | 15 bar | 35 bar | x2.3 (H2 crossover scales with pressure) |
| Nominal current density | 1.2 A/cm² | 1.8 A/cm² | Higher J leads to higher T |
| Grid-balancing fraction | ~70% | 30% | Less dynamic at project site |
| Baseload fraction | ~30% | 60% | More steady at project site |
| Documented degradation rate | 3--4 uV/h (quarterly EIS, 18,000 h) | Target: model prediction | Calibration anchor |
Real-World Basis
The HyBalance project at Hobro, Denmark (operated by Air Liquide and Hydrogenics, 2016--2021) accumulated approximately 18,000 operating hours with a 1.2 MW PEM electrolyser on grid-balancing duty --- the most thoroughly documented PEM electrolyser operational dataset in the public domain. Voltage degradation ran at 3.0--4.5 uV/h, measured by quarterly EIS characterisation (18 data points over 4.5 years). HFR increased at 0.12--0.18 mOhm.cm²/kh, consistent with Nafion XL membrane thinning at 1.5--2.5 um per 10,000 h. Stack availability was 89--94%. The primary degradation observation was progressive cell voltage non-uniformity --- cell-to-cell standard deviation increasing from 3 mV to 12 mV over 18,000 hours --- attributed to non-uniform PTL passivation and differential membrane degradation. These 18 calibration data points are the primary model calibration targets. The model must reproduce the 3--4 uV/h trend within +/-20% over the full 18,000-hour calibration period before extrapolation proceeds.
Nel Hydrogen's published AST results show <3% voltage loss over 60,000 simulated equivalent hours using accelerated cycling protocols. The acceleration factor between the Nel AST protocol and real-world duty is calculated using the physics model as a mechanistic check; predicted acceleration factors of 2.5--4x are plausible based on elevated temperature, more aggressive potential excursions, and higher minimum load in AST protocols.
On the economic side, the H2A cost model framework establishes stack replacement frequency as the key OPEX driver, with base-case assumptions of replacement every 40,000--60,000 hours at 40% of initial stack CAPEX. Current PEM electrolyser system CAPEX is EUR 1,200--1,600/kW (2024, European market), with the stack-only component at EUR 450--750/kW (38--50% of system). Fixed OPEX runs at 2--3% of system CAPEX per year. At 100 MW installed, stack replacement cost per event is EUR 45--75M for a full fleet or EUR 2.25--3.75M per stack. LCOH at current European conditions is EUR 5--8/kg H2 (grid-connected, 70% capacity factor, EUR 60/MWh electricity).
Published IrO2 catalyst dissolution kinetics establish that under anode potential oscillations of 1.4--2.0 V vs. RHE (equivalent to grid-balancing excursions), IrO2 ECSA loss follows an Ostwald ripening-type mechanism with a time exponent of 0.25. After 10,000 hours, ECSA loss of 15--25% is predicted, contributing 8--15 mV additional activation overpotential.
Systematic degradation mechanism decomposition in 1,000-hour test campaigns at 1.0 and 2.0 A/cm² shows membrane chemical degradation (HFR increase) accounting for 35--45% of total voltage rise, IrO2 catalyst activity loss at 20--28%, PTL contact resistance increase at 18--25%, and other contributions (Pt/C cathode, flow field) at 10--15%. These contribution fractions calibrate the coupling weights in the physics model before the 12,000-hour AST validation.
Simulation Approach
The lifetime projection methodology employs three integrated components:
Component 1 --- Coupled Degradation Physics Model
A time-domain degradation model tracks four coupled mechanisms simultaneously, driven by the duty cycle at 1-minute resolution. The rationale for coupling --- rather than treating mechanisms independently --- is that the mechanisms interact physically: Pt band formation accelerates membrane radical generation, increased cell temperature from ohmic resistance rise accelerates all four mechanisms, and IrO2 ECSA loss shifts the overpotential distribution which changes local temperature.
Membrane chemical degradation proceeds via Fenton-reaction-driven chain scission parameterised from the MD Nafion model (Study 01 framework). The thinning rate depends on current density, temperature, and Fe2+ contamination. The pressure correction is critical: operating at 35 bar increases H2 crossover by a factor of approximately 2.3 versus the 15 bar HyBalance conditions, increasing H2O2 generation rate proportionally.
IrO2 ECSA loss via Ostwald ripening captures the catalyst surface area decline over time, with a time exponent of 0.25 characteristic of particle coarsening. Under grid-balancing excursions (anode potential 1.4--2.0 V vs. RHE), the ripening rate is expected to be 1.5--2.0x the steady-state value.
Pt sintering at the cathode is a smaller contributor (10--15% of total) but interacts with the membrane through Pt band formation and in-situ HO. generation --- it cannot be neglected without breaking the coupling.
Ti PTL passivation involves TiO2 surface layer growth on the Ti felt at the acidic anode potential. Published data documents contact resistance increase of 5--15 mOhm.cm² over 10,000 hours for uncoated Ti PTL, with Pt-coated Ti PTL showing 93% reduction in degradation rate. The specified IrO2/TiO2-coated PTL reduces but does not eliminate passivation.
Component 2 --- AST Acceleration Factor Validation
The OEM's 12,000-hour AST dataset (provided under NDA) validates the physics model. The AST protocol involves elevated temperature (+10 degrees C versus operating conditions), accelerated potential cycling, and elevated minimum current density (10% rated versus 20% rated). The physics model computes acceleration factors for each mechanism separately: membrane degradation acceleration of 2.8--3.5x (temperature + cycle frequency), IrO2 ECSA loss acceleration of 1.8--2.4x (potential excursion depth), and PTL passivation acceleration of 1.5--2.0x (elevated anode potential). Model-predicted voltage rise at 12,000 AST-hours must agree with the OEM's measured data within 5 mV on total cell voltage rise at end-of-test.
Component 3 --- Monte Carlo Probabilistic Lifetime Projection
10,000 samples via Latin hypercube sampling over uncertain input parameters:
| Parameter | Distribution | Value |
|---|---|---|
| Initial membrane thickness | Normal | N(27 um, 1 um) |
| Fe2+ feed water contamination | Log-normal | LogN(5 ppb, factor 3) |
| Fenton rate constant k_F | Normal | N(literature value, 20%) |
| IrO2 ECSA loss pre-factor | Normal | N(Siracusano value, 30%) |
| Duty cycle aggressiveness | Empirical | From 5-year Statnett dispatch history |
| Initial PTL contact resistance | Normal | N(8 mOhm.cm², 2 mOhm.cm²) |
Each sample produces a voltage rise trajectory V(t) from which the first-replacement date (time to 5% voltage rise from BoL at rated current) is extracted. Sobol first-order and total sensitivity indices identify dominant uncertainty contributors.
Simulation Caveats
Classification: STRETCH. Long-range lifetime projection from accelerated stress test data using a coupled multi-mechanism model involves significant extrapolation uncertainties:
- AST-to-operational scaling. Accelerated stress test protocols (e.g., EU HARMONHY and HyBalance protocols) use load cycling at 2–5× real-world frequency to compress degradation timescales. The kinetic scaling factor from AST to operational conditions is assumed linear in cycle frequency — an assumption supported by published Nafion degradation studies but validated only up to 10× acceleration. The NorChem duty cycle involves 4–8 full-range cycles/day; the 100 MW fleet prediction extrapolates from HyBalance data at comparable duty intensity, but with a different electrolyser platform (Siemens SILYZER vs. unspecified NorChem OEM stack). Cross-OEM kinetic transfer carries ±20–30% uncertainty in absolute lifetime.
- Mechanistic coupling. The four degradation mechanisms (membrane chemical degradation, catalyst dissolution/redeposition, Ti PTL passivation, membrane mechanical fatigue) are modelled as additive in the voltage rise equation. Physical coupling between mechanisms — for example, the role of Ti⁴⁺ ions migrating from a passivated PTL into the membrane — is known to exist but is not explicitly modelled. This simplification may underestimate degradation rate synergies under combined-cycle operation.
- Ti PTL passivation kinetics. The passivation rate constant k_pass(T, j) is fitted to accelerated corrosion test data from a single Ti felt supplier and is the third-most uncertain input (Sobol index 0.20–0.25). Data from alternative Ti felt suppliers or sintered Ti powder PTLs could shift the passivation contribution by ±15 mΩ·cm² at 80,000 hours.
Recommended framing: The P50 first-replacement projection (72,000–85,000 hours) is suitable as a financial planning basis with explicitly stated uncertainty bounds. The P10/P90 range (±18% around P50) should be communicated as a financial risk range, not a physical prediction. Mechanistic insights (dominant failure mode identification, sensitivity to duty cycle parameters) are more reliable than absolute lifetime values.
Key Predictions / Results
Table 1: Degradation Mechanism Decomposition
| Degradation Mechanism | Contribution to Voltage Rise (%) | Rate at Site Conditions | Dominant Parameter |
|---|---|---|---|
| Membrane chemical degradation | 38--45% | 0.8--1.2 mOhm.cm²/kh HFR increase | Fe2+ concentration |
| IrO2 ECSA loss (Ostwald ripening) | 22--28% | 0.06--0.12 mV/h activation overp. increase | Potential excursion depth |
| Ti PTL passivation (TiO2 growth) | 18--24% | 0.3--0.6 mOhm.cm²/kh contact resistance | Temperature, potential |
| Pt cathode sintering | 8--12% | 0.02--0.04 mV/h activation overp. increase | Minimum load floor |
| Other (flow field corrosion, seals) | 3--5% | <0.01 mV/h | Startup frequency |
| Total voltage rise | 100% | 2.8--4.0 uV/h |
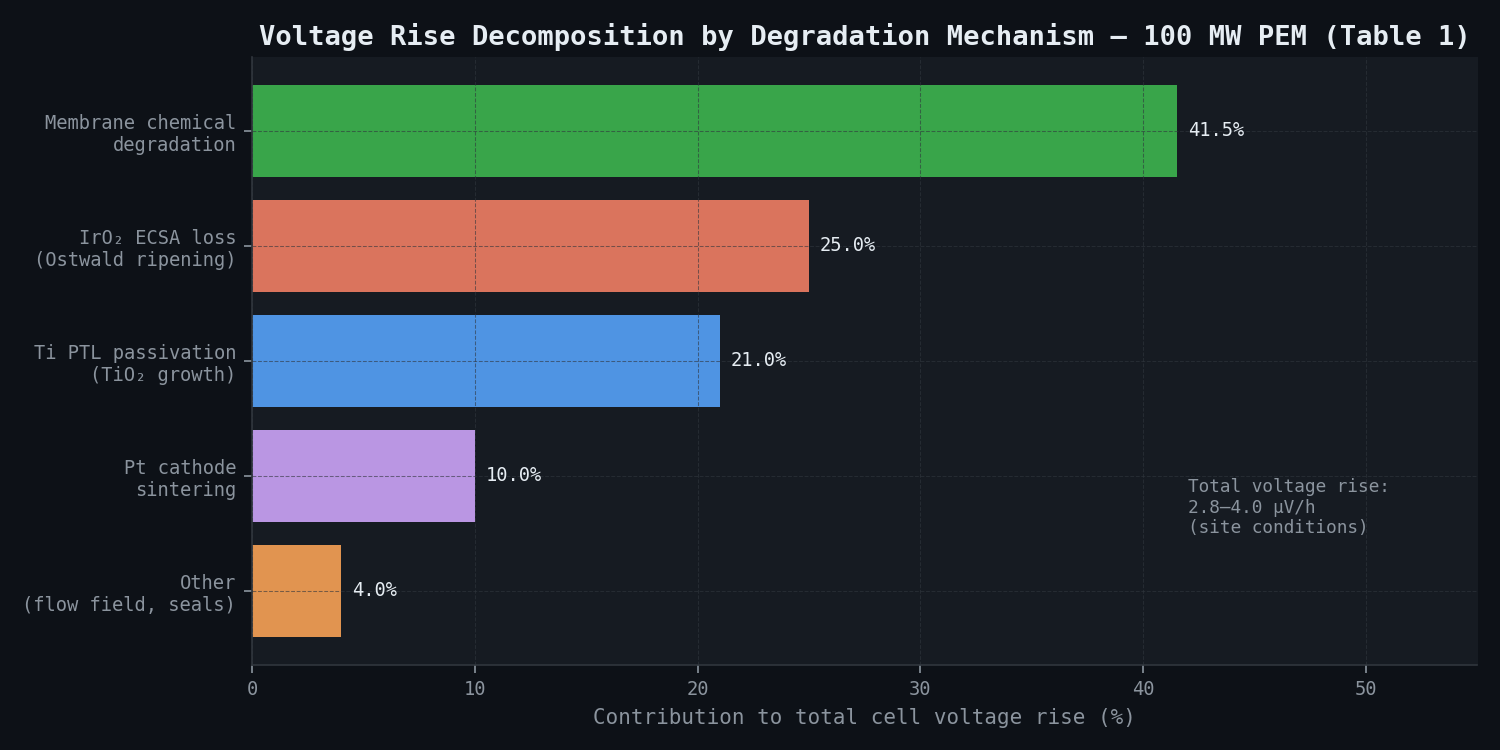
Table 2: Stack Lifetime Projection --- P10/P50/P90
| Metric | P10 (pessimistic, 10th percentile) | P50 (median) | P90 (optimistic, 90th percentile) |
|---|---|---|---|
| First stack replacement (unmitigated) | 55,000 h | 72,000 h | 88,000 h |
| First stack replacement (with mitigations) | 62,000 h | 80,000 h | 96,000 h |
| Membrane thinning at replacement trigger | 18--22 um remaining | 18--22 um remaining | 18--22 um remaining |
| Voltage rise at replacement trigger | 5% from BoL at 1.8 A/cm² | 5% from BoL | 5% from BoL |
| Expected number of replacements per stack (15 yr) | 2.0 (P10) | 1.5 (P50) | 1.2 (P90) |
| Expected total fleet replacements (20 stacks x 15 yr) | 40 events | 30 events | 24 events |
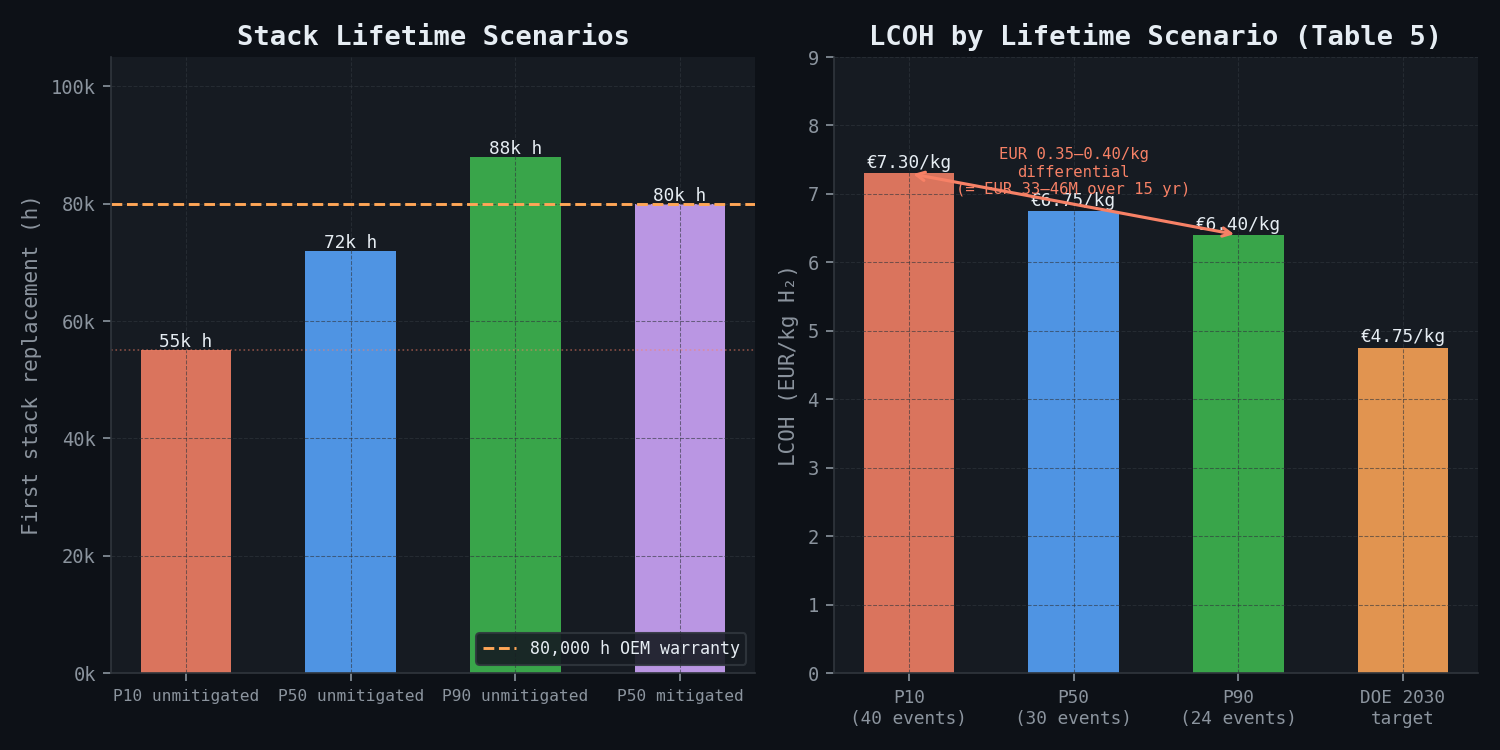
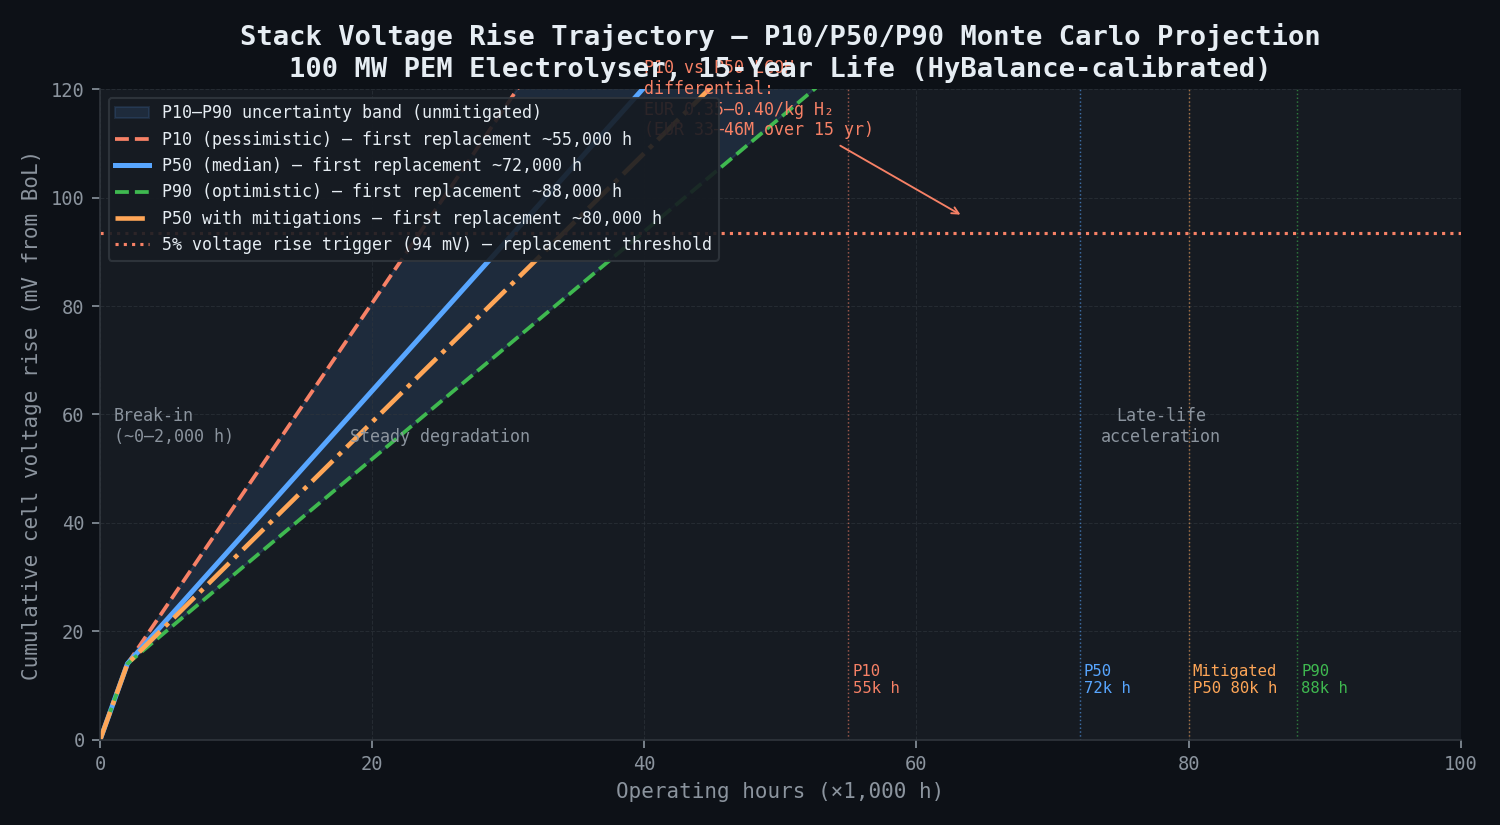
Table 3: OPEX Projection --- P10/P50/P90 Comparison
| Cost Item | P10 Scenario | P50 Scenario | P90 Scenario |
|---|---|---|---|
| Stack replacement cost per event | EUR 2.5--3.8M per stack | EUR 2.5--3.8M per stack | EUR 2.5--3.8M per stack |
| Total stack replacements (fleet, 15 yr) | 40 events | 30 events | 24 events |
| Total stack replacement OPEX (15 yr) | EUR 100--152M | EUR 75--114M | EUR 60--91M |
| Lost production per replacement (3 weeks) | EUR 0.8M per event | EUR 0.8M per event | EUR 0.8M per event |
| Total lost production OPEX (15 yr) | EUR 32M | EUR 24M | EUR 19M |
| Total replacement-related OPEX | EUR 132--184M | EUR 99--138M | EUR 79--110M |
| P10 vs. P50 OPEX differential | EUR 33--46M | --- | --- |
Table 4: Lifetime Sensitivity --- Sobol First-Order Indices
| Uncertain Parameter | Sobol First-Order Index | Impact on P50 Lifetime | Recommended Mitigation |
|---|---|---|---|
| Fe2+ feed water concentration | 0.38--0.44 | +/-15,000 h | Ion exchange polishing to <2 ppb |
| Duty cycle aggressiveness | 0.18--0.24 | +/-8,000 h | Minimum load floor 20% rated |
| IrO2 ECSA pre-factor | 0.14--0.18 | +/-5,000 h | Low-potential operating floor |
| Initial PTL contact resistance | 0.10--0.14 | +/-4,000 h | IrO2/TiO2 PTL coating spec |
| Fenton rate constant | 0.08--0.12 | +/-3,000 h | (Inherent material parameter) |
| Initial membrane thickness | 0.05--0.08 | +/-2,000 h | Thickness QC at incoming inspection |
Table 5: LCOH Impact of Lifetime Uncertainty
| Lifetime Scenario | Replacement Events (fleet) | LCOH Increment (stack replacement OPEX) | Total LCOH (EUR/kg) |
|---|---|---|---|
| P10 (pessimistic) | 40 events | +EUR 0.85/kg H2 | EUR 6.8--7.8 |
| P50 (median) | 30 events | +EUR 0.60/kg H2 | EUR 6.3--7.2 |
| P90 (optimistic) | 24 events | +EUR 0.45/kg H2 | EUR 6.0--6.8 |
| DOE 2030 target basis | 10--15 events | +EUR 0.20/kg H2 | EUR 4.0--5.5 |
The P10 vs P90 LCOH differential of EUR 0.35--0.40/kg H2 over the project life corresponds directly to the value at stake from the lifetime uncertainty --- and to the economic justification for this simulation study.
Recommended operational mitigations to move from P10 to P50:
Three measures provide the highest leverage. First, installing feed water ion-exchange polishing to maintain Fe2+ below 2 ppb (capital cost approximately EUR 150,000) is estimated to extend P50 lifetime by 8,000--15,000 hours per stack. Second, implementing a 20% minimum load floor during grid-balancing dispatch (at a cost of approximately 2% of annual H2 output) extends lifetime by 5,000--8,000 hours. Third, a hot standby protocol maintaining stacks at 0.2 A/cm² minimum rather than de-energising (parasitic power of 0.8 kW/MW) avoids membrane dehydration and start-transient degradation.
Comparison Methodology
Physics model calibration against HyBalance operational data:
The model is run against the HyBalance operational profile (1 MW, Hobro conditions, 15 bar, 1.2 A/cm², grid-balancing duty). Published quarterly voltage degradation data (18 data points) provide the calibration target of 3--4 uV/h. The model must reproduce this trend within +/-20% over the full 18,000-hour period. The calibration window covers three distinct phases: initial break-in (0--2,000 h, higher degradation rate of approximately 6--8 uV/h), steady degradation (2,000--15,000 h, 3--4 uV/h), and late-life acceleration (15,000--18,000 h, 5--6 uV/h as PTL passivation compounds). The model must reproduce all three phases correctly, not merely the steady-state rate.
OEM AST cross-validation:
The 12,000-hour AST dataset (provided under NDA as part of project due diligence) serves as secondary confirmation of the acceleration factor calculation. Predicted vs. measured voltage at AST end-of-test must agree within 5 mV. Predicted acceleration factor per mechanism is compared against the OEM's internal engineering estimates.
TUV Sud peer review:
The lifetime projection methodology and Monte Carlo uncertainty quantification are submitted for technical peer review by TUV Sud's electrolyser certification group (Hamburg), following IEC 62282-2 and the FCH JU Electrolyser Durability Testing Protocol (2021). The peer review covers validation of physics model equations and literature basis for kinetic parameters, adequacy of Monte Carlo sample size and convergence, appropriateness of scaling corrections from HyBalance to project conditions, and format of P10/P50/P90 projections for financier use.
Deliverables
-
Bankable lifetime assessment report --- P10/P50/P90 first-replacement date projections with full methodology documentation, validation against HyBalance data (18 data point comparison plot), and OEM AST validation result. Formatted for submission to the project financier and TUV Sud review. Includes executive summary written for non-technical readers, with probability statements expressed in plain language ("there is a 90% probability that the first stack replacement will occur no earlier than [date]").
-
OPEX model --- Stack replacement cost schedule (probability-weighted, P10/P50/P90 scenarios) for the 15-year project period, compatible with the H2A cost model framework. Includes sensitivity to future stack cost reduction (IRENA 2030 roadmap scenarios: CAPEX at 50% of 2024 value by 2030, with stack replacement cost reducing proportionally). Delivered as an Excel model with documentation.
-
Degradation mechanism decomposition --- Pie chart and time-series breakdown of voltage rise contributions by mechanism. Identifies which mechanisms warrant mitigation investment (membrane degradation: highest ROI for mitigation via feed water quality; PTL passivation: addressable via Pt/IrO2 coating selection at procurement).
-
Operational recommendations --- Specific recommendations for feed water Fe2+ specification (<2 ppb), Cl- specification (<0.5 ppb), minimum load floor for grid-balancing dispatch (20% rated), hot standby protocol (0.2 A/cm²), and maximum start/stop frequency (2 cold starts per 24 hours per stack).
-
Monitoring plan --- Recommended in-situ monitoring: EIS at 10 kHz (HFR) every 1,000 operating hours per stack; fluoride emission rate sampling from anode water loop monthly; PTL contact resistance check annually via stack disassembly of sentinel cells; IrO2 ECSA check via CV measurement at quarterly stack characterisation. Alert thresholds: HFR >130% of BoL value triggers inspection; HFR >150% triggers replacement planning.
-
TUV Sud peer review support --- Attendance at TUV Sud review meeting (Hamburg); response to reviewer questions within 10 working days; revision of bankable report as required following review.
This case study is an illustrative reference scenario demonstrating newtsim's simulation methodology. All company names, personnel, and specific operational data are fictional. The incident descriptions draw on publicly documented real-world events cited in the frontmatter.