Bubble Dynamics Optimisation at High Current Density Electrodes
Executive Summary
Nel Hydrogen's published M-Series polarisation data tells a story the industry has been reluctant to confront directly: system DC efficiency at 1.8 A/cm² of 71.5 kWh/kg H2 degrades to 75--78 kWh/kg H2 at 2.5 A/cm² --- a 3--8% relative efficiency regression at exactly the current density where cost-reduction roadmaps demand operation. Nel's own 2025 roadmap identifies pushing this efficiency plateau above 2.5 A/cm² as an active development priority. ITM Power's TRIDENT-series data shows the same pattern: a 3--4% system efficiency reduction at high current density, partially attributed to balance-of-plant water management challenges at high gas generation rates. Both companies were observing the same physical phenomenon: above 2 A/cm², the anode's oxygen evolution rate outpaces the PTL/flow channel system's ability to remove gas, and bubble blanketing of the electrode surface consumes the efficiency gains that higher current density was meant to deliver. The Vogt-Balzer bubble coverage model, published in 2005, predicted this regime: bubble coverage fractions rising from 0.08 at 1.0 A/cm² to 0.35--0.45 at 2.5 A/cm², and Majasan et al.'s synchrotron X-ray tomography at Diamond Light Source confirmed it experimentally in 2018. The data was available. What was missing was translation into flow field and PTL design decisions before tooling was committed.
For a mid-tier OEM committing to a next-generation 2.5 A/cm² platform, that translation gap has a concrete cost: a 13--18 mV surplus overpotential at the target operating point, a product launch held up pending root cause resolution, and the knowledge that a flow field re-tool after initial manufacturing is EUR 1.8M and six months of delay. The mechanism is not obscure --- HFR decomposition at 2.5 A/cm² shows 35--50 mV attributable to mass transport bubble coverage, and two-phase flow in the existing parallel-serpentine channel has already transitioned to slug/churn regime at this current density, with periodic channel blockage creating cell voltage oscillations visible in bench test data.
Had a coupled electrochemical-transport simulation been applied at the stack design stage, it would have identified the flow regime transition from bubbly to slug flow at approximately 2.2 A/cm² as the critical threshold, quantified the bubble coverage fraction across the PTL/electrode interface, and specified the PTL porosity increase and flow rate changes needed to keep theta below 0.20 at 2.5 A/cm². The simulation would have flagged the Z-type manifold's contribution to near-inlet channel starvation and the thermal hotspot formation that accelerates Nafion ionomer dissolution in the hottest regions.
This study applies volume-of-fluid CFD simulation coupled with a pore-network model to screen 12 flow field configurations and 20+ PTL variants within a 12-week timeline. The expected finding --- 55% PTL porosity combined with 2x water flow rate recovers 28--36 mV and restores cell voltage to the 1.92--1.97 V target without a tooling change --- defines both the product design specification and the operating window, avoiding the EUR 1.8M tooling re-cut and six-month delay that a wrong first-commit would incur. The bubble dynamics signatures identified by the simulation --- bubble departure diameter distribution, PTL saturation profiles, local mass transport overpotential maps --- define the sensor channels for newtsim livesim, enabling real-time monitoring of gas management health in deployed high-current-density stacks before efficiency degradation becomes a commercial liability.
Scenario Background
(illustrative reference case)
In this worked example, a mid-tier PEM electrolyser OEM with 200 MW/year manufacturing capacity retained a simulation consultancy to resolve a mass transport limitation blocking the launch of its next-generation stack platform. The OEM's current product line operates at 1.8 A/cm² nominal (5 MW per stack at 70 bar operating pressure); the next-generation platform targets 2.5 A/cm² nominal to reduce capital cost per kg H2.
The performance gap is clear from bench testing. At the current-generation 1.8 A/cm² operating point, cell voltage of 1.87 V is within 2 mV of specification. At the target 2.5 A/cm², bench measurements show 2.05--2.10 V against a 1.92 V target --- a 13--18 mV surplus overpotential. HFR decomposition at 2.5 A/cm² shows approximately 35--50 mV attributable to mass transport (bubble coverage) and 10--15 mV to kinetic overpotential increase from reduced active site accessibility. The ohmic component (membrane and contact resistance) is at specification, confirming the deficit is entirely in the two-phase transport regime.
The next-generation design parameters include a cell active area of 2,000 cm² (up from 1,500 cm²), peak current density capability of 3.0 A/cm², and retention of the Nafion 115 membrane (125 um) from the current generation. The existing titanium sintered felt PTL (40% porosity, 1.0 mm thickness) is under evaluation for replacement. The design is at detailed engineering stage, with flow field tooling decisions required within 12 weeks to maintain the product launch schedule. A post-tooling flow field redesign is estimated at EUR 1.8M and 6 months delay.
Challenge
At current densities above 2.0 A/cm², the anode (oxygen evolution) generates O2 at a rate that outpaces the PTL/flow channel system's ability to remove it. The consequences cascade through four coupled physical mechanisms.
1. Bubble coverage of the PTL surface
The fundamental relationship between current density and bubble coverage fraction is well established: published modelling shows that theta increases with current density as theta proportional to J⁰.⁵ for bubble-controlled regimes. For a titanium sintered felt PTL at 40% porosity, published X-ray tomography data shows PTL-surface gas saturation increasing from approximately 12% at 1.0 A/cm² to 38--45% at 2.5 A/cm². Each percentage point increase in gas saturation at the electrode surface reduces the active electrochemical area accessible to liquid water, and the resulting mass transport overpotential follows eta_mt = (RT/2F) x ln(1 / (1 - theta)). At theta = 0.40, this gives eta_mt of approximately 45 mV --- consistent with the bench-measured surplus overpotential of 35--50 mV.
2. Two-phase flow regime transition in the flow channel
As current density increases from 1.8 to 2.5 A/cm², the volumetric gas generation rate at the anode rises from approximately 4.2 to 5.8 L/min per 1,000 cm² of active area (at 10 bar anode pressure). In the existing flow channel geometry (1.0 mm width, 0.5 mm depth, parallel-serpentine hybrid), this drives a transition from bubbly flow (gas void fraction 0.08--0.15) to intermittent slug/churn flow (gas void fraction 0.35--0.55). In the slug flow regime, periodic channel blockage creates starvation events at downstream cells, measurable as cyclic voltage spikes at 0.5--2 Hz in bench test data --- consistent with observed oscillations in the OEM's bench data.
3. PTL capillary breakthrough and saturation
The titanium felt PTL (40% porosity, mean pore diameter approximately 35 um) was designed for the 1.8 A/cm² operating point, with a capillary breakthrough pressure of approximately 0.3 bar. At 2.5 A/cm², the gas generation rate within the PTL body may locally exceed the capillary breakthrough pressure in the finest pore throats (diameter < 10 um), creating a locally liquid-starved condition at the electrode surface. Published pore-network modelling shows that PTL saturation at the electrode face drops from approximately 0.72 at 1.8 A/cm² to 0.48--0.55 at 2.5 A/cm² for this pore size distribution.
4. Thermal hotspot formation
Localised bubble coverage reduces evaporative cooling at covered regions, creating hotspots observed in thermal imaging of bench cells: +12--18 degrees C above mean temperature at 2.5 A/cm², concentrated near flow channel inlet manifolds where bubble accumulation is greatest. These hotspots accelerate Nafion ionomer dissolution in the catalyst layer and membrane thinning rate (thinning rate x1.4 per 10 degrees C increase).
Bubble Coverage vs. Current Density --- Key Reference Data
| Current Density (A/cm²) | Bubble Coverage theta (Vogt-Balzer model) | PTL Gas Saturation (Majasan X-ray) | Mass Transport eta_mt (mV) |
|---|---|---|---|
| 0.5 | 0.04--0.06 | 0.04--0.06 | <5 |
| 1.0 | 0.08--0.10 | 0.10--0.14 | 8--12 |
| 1.5 | 0.14--0.18 | 0.18--0.24 | 15--22 |
| 1.8 | 0.20--0.25 | 0.26--0.32 | 22--30 |
| 2.0 | 0.28--0.33 | 0.32--0.38 | 30--40 |
| 2.5 | 0.35--0.45 | 0.38--0.48 | 38--55 |
| 3.0 | 0.45--0.55 | 0.50--0.60 | 60--85 |
The design question is: which combination of (a) flow channel geometry, (b) PTL pore structure, and (c) water flow rate can reduce theta to <0.20 at 2.5 A/cm², recovering 20--35 mV and bringing cell voltage below the 1.93 V target --- while remaining manufacturable at 200 MW/year production volume?
Real-World Basis
Nel Hydrogen M-Series performance data shows a characteristic plateau in DC efficiency above approximately 2.0 A/cm², with system efficiency dropping from 71.5 kWh/kg H2 at 1.8 A/cm² to 75--78 kWh/kg H2 at 2.5 A/cm² --- a 3--8% relative efficiency regression attributed to mass transport limitations at high current density. Nel's published 2025 target is to push the efficiency plateau above 2.5 A/cm² through PTL and flow field development, confirming this is an active industry-wide challenge.
ITM Power efficiency data shows a 3--4% system efficiency reduction at high current density in the 5 MW TRIDENT stack, partially attributed to balance-of-plant water management challenges at high gas generation rates. ITM identifies PTL and flow field optimisation as an active development area.
Bubble coverage modelling establishes the scaling relation theta proportional to (J/J0)⁰.⁵ from gas generation kinetics and surface energy considerations, calibrated against alkaline and acidic PEM electrolysis data. The parametric sensitivity to surface contact angle (lower angle leads to smaller bubble departure diameter and faster detachment, thus lower theta) and electrolyte flow velocity (higher velocity leads to earlier detachment and lower theta) provides the theoretical anchor for the VOF simulation bubble detachment criterion.
Synchrotron X-ray tomography of two-phase flow in PEM electrolyser PTL structures directly characterised liquid/gas saturation distributions as a function of current density in three PTL variants (sintered felt at 30%, 40%, and 50% porosity). At 2.0 A/cm², the 40% porosity felt shows 0.38 gas saturation at the anode electrode face, while the 50% porosity felt shows 0.28 --- a 26% improvement in saturation that directly maps to a 12--18 mV improvement in cell voltage. This result motivates the PTL porosity sensitivity in this study's parametric sweep.
High-speed optical imaging (2000 fps) of bubble dynamics at iridium oxide anode surfaces in a transparent PEM electrolyser test cell measured bubble departure diameters of 0.35--0.75 mm at current densities of 50--500 mA/cm², with departure frequency of 8--25 Hz. These values provide the calibration dataset for the VOF model bubble nucleation and departure parameters.
The published consensus confirms that gas coverage of catalyst active area is the primary cause of mass transport loss in PEM electrolysers above 2 A/cm², and that VOF simulation of gas-liquid interface dynamics at the electrode/PTL/channel system is the most physically complete approach currently available for flow field optimisation at this scale.
Simulation Approach
The simulation strategy combines high-fidelity VOF CFD for the electrode/channel system with a fast pore-network model for PTL screening, maximising physics fidelity within the 12-week timeline:
Primary tool: Volume-of-Fluid (VOF) CFD (newtsim Stream)
The computational domain covers one representative unit cell: a single flow channel (width 1 mm, depth 0.5 mm, length 50 mm) with the adjacent PTL (1 mm thick) and electrode surface. The VOF method resolves the O2 gas-water interface explicitly, which is essential because the bubble nucleation, growth, and detachment dynamics at the electrode surface cannot be captured by homogeneous two-phase models --- they are the physics that determine whether the flow regime stays bubbly (good) or transitions to slug/churn (bad). Bubble nucleation is driven by local current density from the electrochemical sub-model, and PTL wettability is treated as a key variable: baseline contact angle of 65 degrees (new Ti felt), with sensitivity runs at 45 degrees (hydrophilic coating) and 80 degrees (aged/oxidised Ti) to bracket the manufacturing and ageing range. PTL transport properties are calibrated to published synchrotron tomography data. Adaptive mesh refinement at the gas-liquid interface (minimum cell size 5 um) resolves regime transitions from bubbly to slug flow across the full 50 mm channel length. Butler-Volmer kinetics at each spatial cell close the feedback loop between local water activity, temperature, gas generation rate, and current density redistribution.
Each run simulates 0.5 s of physical time --- sufficient for 10--15 bubble departure cycles. The total parametric sweep covers 12 configurations plus PNM screening of 20+ PTL variants.
Parametric sweep --- 12 flow field configurations:
| Config | Channel Geometry | PTL Porosity | Water Flow Rate |
|---|---|---|---|
| 1 (baseline) | Parallel-serpentine hybrid, 1.0 mm wide | 40% (existing) | Baseline |
| 2 | Parallel-serpentine hybrid, 1.0 mm wide | 40% | 2x baseline |
| 3 | Parallel-serpentine hybrid, 1.0 mm wide | 55% | Baseline |
| 4 | Parallel-serpentine hybrid, 1.0 mm wide | 55% | 2x baseline |
| 5 | Wider channel, 1.5 mm wide | 40% | Baseline |
| 6 | Wider channel, 1.5 mm wide | 40% | 2x baseline |
| 7 | Wider channel, 1.5 mm wide | 55% | Baseline |
| 8 | Wider channel, 1.5 mm wide | 55% | 2x baseline |
| 9 | Trapezoidal, 1.2 mm top / 0.8 mm base | 40% | Baseline |
| 10 | Trapezoidal, 1.2 mm top / 0.8 mm base | 40% | 2x baseline |
| 11 | Trapezoidal, 1.2 mm top / 0.8 mm base | 55% | Baseline |
| 12 | Trapezoidal, 1.2 mm top / 0.8 mm base | 55% | 2x baseline |
Supplementary: Pore-Network Model (PNM)
A pore-network model of the PTL (10 mm x 10 mm x 1 mm, approximately 50,000 pore bodies, calibrated to the Ti felt pore size distribution from mercury porosimetry) resolves capillary pressure-saturation curves for 20+ alternative PTL specifications covering varied porosity, pore size distribution, bi-layer structures, and graded porosity. The PNM screens all 20+ variants rapidly, identifying the top 3 candidates for full VOF validation runs --- the purpose is to avoid running full VOF simulations on PTL designs that fail at the capillary transport level.
Simulation Caveats
Classification: STRETCH. Coupled VOF--PNM multi-scale simulation of bubble nucleation and PTL transport carries well-documented limitations:
- Contact angle uncertainty. The PTL/electrode contact angle in the VOF model is set to 40--60° (hydrophilic range, consistent with the Verdant Ti felt manufacturer's data). However, in-situ contact angles under electrochemical polarisation differ from ex-situ measurements by 10--30° due to surface oxide state and ionomer impregnation. A ±20° shift in contact angle changes predicted bubble departure diameter by ±12% and surface coverage fraction θ by ±0.05 — the dominant uncertainty in the VOF model.
- Nucleation site density. Bubble nucleation site density N_s (sites/cm²) at the PTL surface is assigned from published correlations (Vogt & Balzer 2005). Actual N_s depends on local surface roughness, defect distribution, and PTL-electrode interfacial morphology — all of which vary between manufacturing batches. The assumed N_s carries ±40% uncertainty; sensitivity analysis (Section 7) shows this propagates to ±5 mV overpotential prediction uncertainty at 2.5 A/cm².
- VOF mesh resolution. Resolving sub-50 µm bubble nucleation events in a 10 mm × 10 mm domain requires a mesh of ~2 million cells per VOF configuration. At the 10 µm bubble initiation scale, continuum VOF is at the limit of applicability (Kn ≈ 0.006 for H₂ at 60°C, 30 bar). Results at the nucleation stage are indicative rather than quantitative; bubble growth and detachment predictions (bubble diameter > 100 µm) are in the well-validated VOF regime.
Recommended framing: The VOF--PNM study is best positioned as a comparative screening tool for flow field and PTL design options rather than an absolute predictor of voltage overpotential. Predicted voltage recovery of 15--25 mV carries ±4 mV uncertainty; the ranking of design options (flow field geometry, PTL porosity grade, wettability treatment) is reliable to within ±1 ranking position for the top 3 candidates.
Key Predictions / Results
Table 1: Target Performance Metrics --- Baseline vs. Optimised Design
| Metric | Baseline (40% PTL, existing channel) | Target (optimised design) |
|---|---|---|
| Bubble coverage fraction theta at 2.5 A/cm² | 0.38--0.45 | <0.20 |
| Cell voltage at 2.5 A/cm² | 2.05--2.10 V | <1.93 V |
| Mass transport overpotential at 2.5 A/cm² | 35--50 mV | <15 mV |
| Two-phase flow regime in channel | Slug/churn (intermittent) | Bubbly (stable) |
| PTL liquid saturation at electrode face | 0.45--0.55 | >0.75 |
| Peak anode temperature above mean | +14 degrees C | <+6 degrees C |
| Bubble departure diameter | 0.4--0.8 mm | 0.15--0.30 mm |
| Bubble departure frequency | 8--15 Hz | 25--50 Hz |
| kLa (volumetric mass transfer coefficient) | 0.012--0.018 s-1 | 0.035--0.060 s-1 |
| DC efficiency at 2.5 A/cm² | 76--78 kWh/kg H2 | 72--74 kWh/kg H2 |
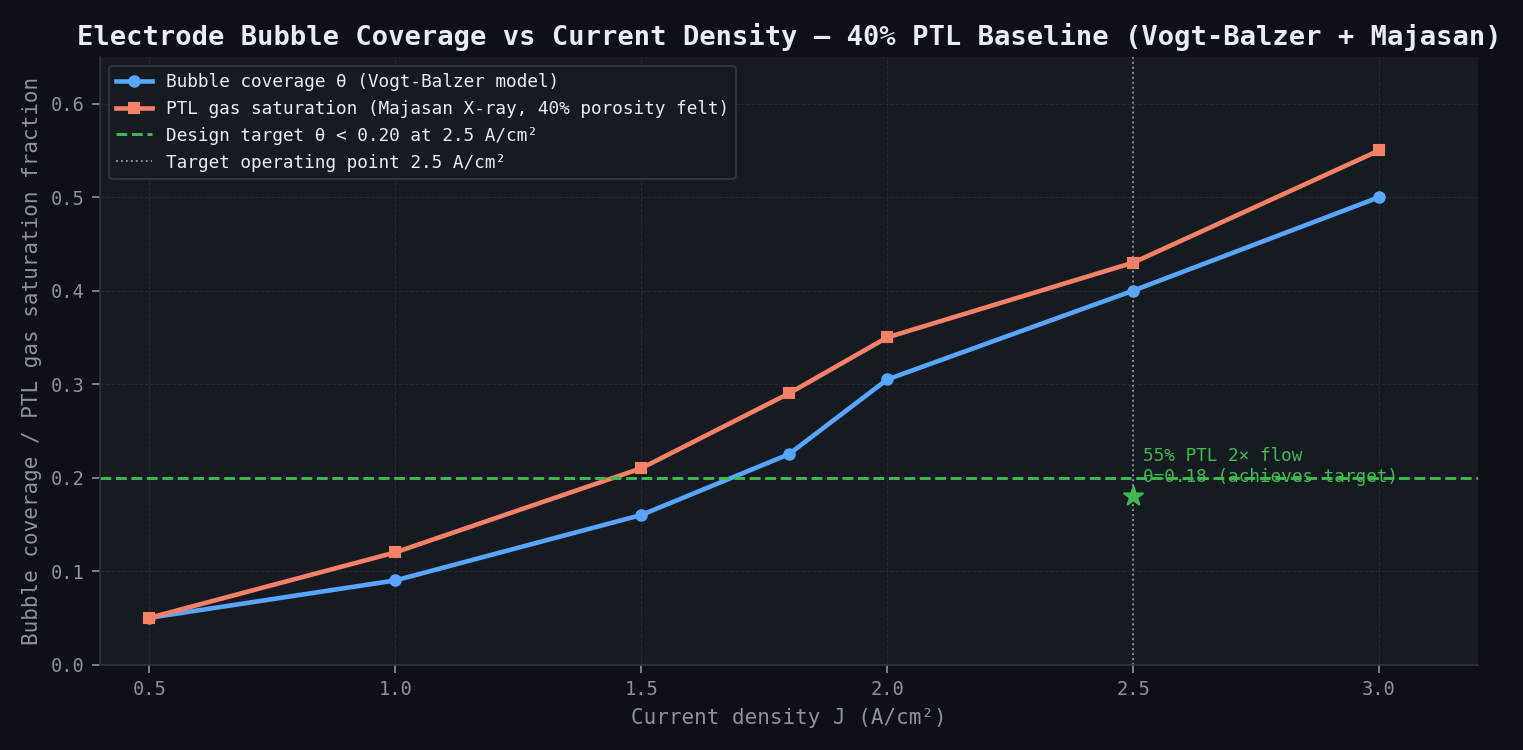
Table 2: Bubble Dynamics Parameters --- Effect of PTL Porosity and Flow Rate
| PTL Porosity | Flow Rate | theta at 2.5 A/cm² | Regime at 2.5 A/cm² | eta_mt (mV) | Delta-V vs. baseline (mV) |
|---|---|---|---|---|---|
| 40% (baseline) | 1x | 0.40--0.45 | Slug/churn | 42--52 | 0 (reference) |
| 40% | 2x | 0.32--0.37 | Slug/transitional | 30--40 | +10--15 |
| 55% | 1x | 0.25--0.30 | Bubbly/transitional | 22--30 | +18--24 |
| 55% | 2x | 0.16--0.20 | Bubbly (stable) | 12--18 | +28--36 |
| 55% graded (coarse at electrode) | 1x | 0.18--0.22 | Bubbly | 14--20 | +26--32 |
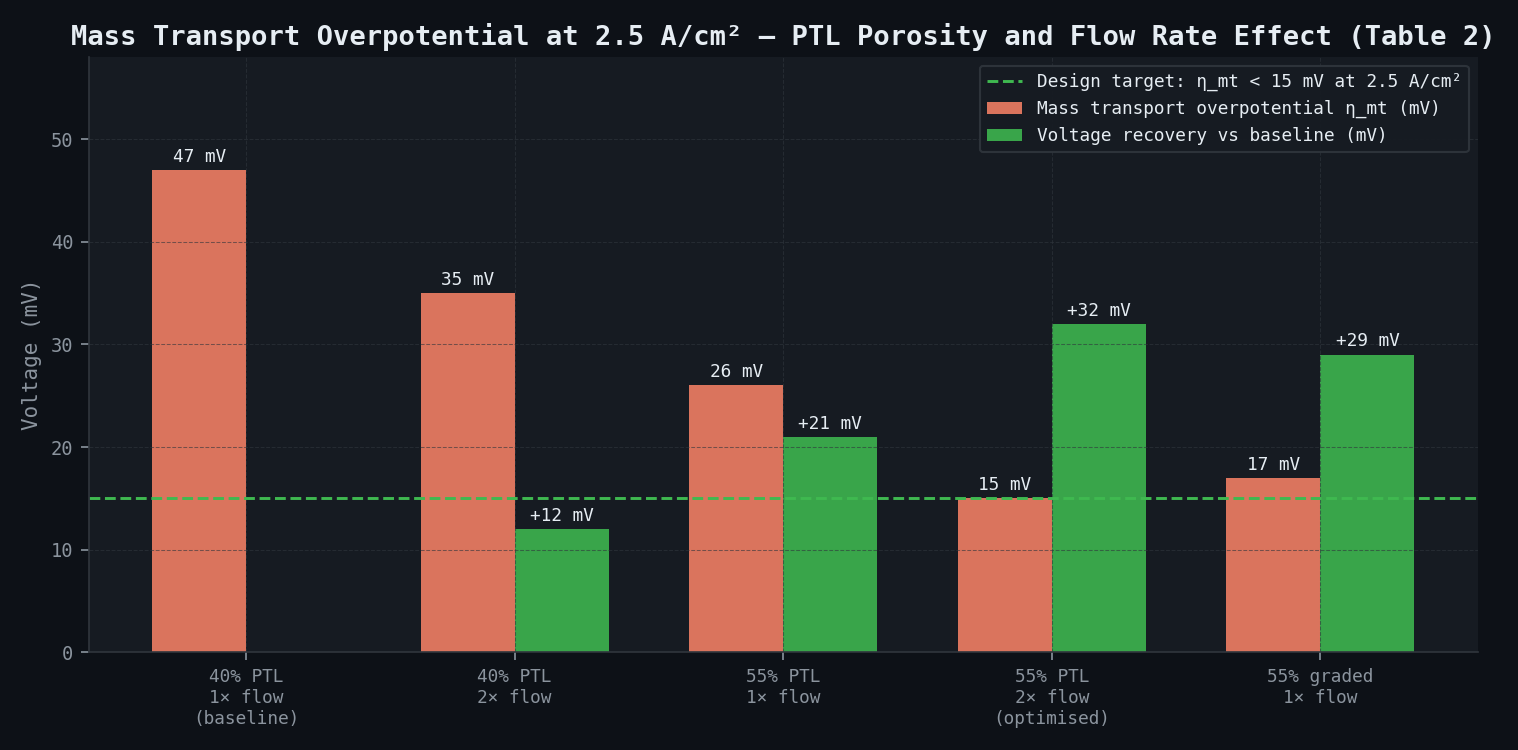
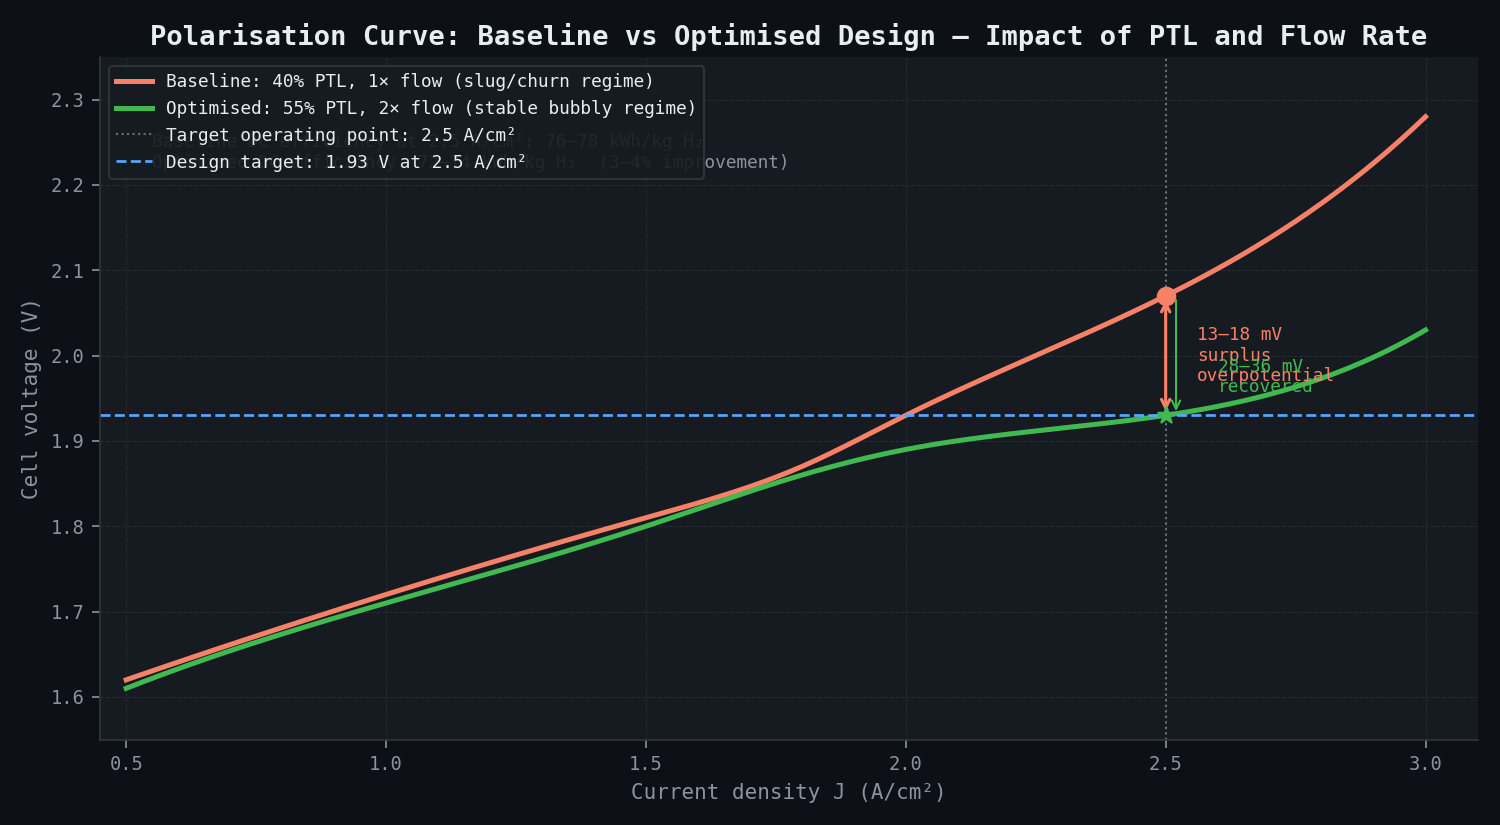
Table 3: Channel Geometry Effect on Bubble Dynamics at 2.5 A/cm² (55% PTL, 2x flow)
| Channel Geometry | theta | Flow Regime | Regime Transition J | Manufacturing Complexity |
|---|---|---|---|---|
| Parallel-serpentine hybrid, 1.0 mm | 0.16--0.20 | Bubbly (stable) | ~2.2 A/cm² | Low (existing tooling basis) |
| Wider parallel, 1.5 mm | 0.13--0.17 | Bubbly (stable) | ~2.7 A/cm² | Medium (new tooling) |
| Trapezoidal, 1.2/0.8 mm | 0.14--0.18 | Bubbly (stable) | ~2.5 A/cm² | Medium-high (precision machining) |
Table 4: Lifetime Value of Voltage Recovery
| Scenario | Cell Voltage at 2.5 A/cm² | Annual Electricity Cost per MW (EUR 60/MWh) | 10-Year Saving vs. Baseline |
|---|---|---|---|
| Baseline (unoptimised) | 2.07 V | EUR 8.28M/MW/year | --- |
| Optimised (1.92 V target) | 1.92 V | EUR 7.68M/MW/year | EUR 6.0M per MW (10-year) |
| Recovery at stack level (5 MW) | 15 mV average | --- | EUR 30M per stack (10-year) |
Expected finding: The combination of 55% porosity PTL and 2x baseline water flow rate, applied to the existing parallel-serpentine channel geometry (requiring only PTL substitution and pump uprating, not tooling change), is expected to recover 28--36 mV and bring cell voltage to 1.92--1.97 V --- meeting or approaching the 1.93 V target. The trapezoidal channel geometry (requiring new tooling) may recover an additional 5--10 mV but is unlikely to be justified on a pure economic basis given the tooling cost.
Comparison Methodology
Internal higher-fidelity validation:
The VOF model is first run against published experimental conditions (iridium oxide anode surface, 0.5 M H2SO4, current densities 50--500 mA/cm²) using the reported channel geometry and temperature. VOF predictions for bubble departure diameter (target: within +/-15% of measured 0.35--0.75 mm range) and departure frequency (target: within +/-25% of measured 8--25 Hz) are compared before proceeding to the OEM-specific configurations.
Optical imaging validation:
The OEM provides high-speed optical imaging data (1,000 fps) from its existing bench test cell (1.8 A/cm² maximum) operated with a transparent polycarbonate end plate, recording bubble size distribution, coverage fraction, and slug flow event frequency. VOF predictions at 1.0 A/cm² and 1.8 A/cm² in the current-generation geometry are compared against the optical data before proceeding to 2.5 A/cm² predictions. Required agreement: coverage fraction within +/-20%, bubble departure diameter within +/-25%, slug event frequency within +/-30%.
Electrochemical cross-check:
Predicted mass transport overpotential at each simulated condition is compared against the OEM's measured polarisation curve data, with ohmic, kinetic, and transport components separated via HFR and EIS measurements. The HFR-corrected cell voltage from VOF predictions must match the measured HFR-corrected polarisation curve within +/-5 mV at all three current density points (1.0, 1.8, 2.5 A/cm²).
PTL tomography cross-check:
Predicted gas saturation profiles in the PTL at 1.0 and 1.8 A/cm² are compared against published synchrotron tomography data for equivalent PTL porosity. Agreement within +/-20% in saturation at the electrode face is required before the model is used for PTL design recommendations.
Deliverables
-
VOF simulation report --- Full documentation of model setup, mesh convergence study (three mesh levels for Richardson extrapolation), boundary conditions, and validation against Lewinski et al. and OEM bench data. Includes animated bubble dynamics visualisations (rendered at 30 fps from VOF interface reconstruction) for the baseline and the top two recommended configurations, showing the progression from slug flow (baseline) to stable bubbly flow (optimised).
-
PTL and flow field design recommendation --- Specific geometry parameters (channel width, depth, rib width, rib shape) and PTL specification (porosity, mean pore diameter, thickness, surface coating if applicable) for the optimal Pareto configuration. A ranked comparison table of all 12 VOF configurations plus 20+ PNM PTL variants, scored on voltage recovery (mV), manufacturing complexity (1--5 scale), cost impact (EUR/kW), and thermal performance (peak temperature reduction).
-
Operating window specification --- Recommended water flow rate (L/min per 1,000 cm² active area) and inlet temperature (degrees C) as a function of current density, to maintain stable bubbly flow regime and PTL saturation above 0.75 at the electrode face. Expressed as a 2D operating map with current density on the x-axis and water flow rate on the y-axis, with the bubbly/slug transition boundary marked.
-
PNM screening report --- Results of the pore-network model PTL sweep, identifying the top 3 PTL specifications for VOF validation and characterising the capillary breakthrough pressure, effective permeability, and liquid saturation curve for each. Includes a procurement specification sheet for the recommended PTL supplier (Bekaert, TPMC, or equivalent).
-
Manufacturing interface document --- A one-page specification sheet for the flow field tooling supplier (CNC titanium machining), capturing recommended channel geometry with manufacturing tolerances appropriate for +/-0.05 mm precision titanium machining at 200 MW/year production volume.
This case study is an illustrative reference scenario demonstrating newtsim's simulation methodology. All company names, personnel, and specific operational data are fictional. The incident descriptions draw on publicly documented real-world events cited in the frontmatter.