PEM Membrane Degradation Under Dynamic Wind-Profile Loading
Executive Summary
When ITM Power's TRIDENT platform entered service at the Linde HyRefine green hydrogen project in Leuna, Germany in 2023 --- 24 MW of PEM electrolysis supplying hydrogen to the industrial cluster --- the engineering team expected the already-documented performance gap between steady-state and dynamic operation to be manageable. What the published record showed instead was a 2--3x increase in membrane thinning rate under grid-balancing duty versus baseload: voltage degradation climbing from 2--3 uV/h under steady conditions to 4--7 uV/h under dynamic cycling, with fluoride emission rates spiking 4--6x at the low current densities that dominate wind lull periods. The mechanism was well understood in the academic literature --- published fluoride emission studies had measured FER maxima of 8--18 ug F cm-2 h-1 at 0.2 A/cm² compared to 1--3 ug at nominal current --- but the data had not been translated into an operational strategy before the fleet entered service. The consequence was a shortfall against the 80,000-hour membrane warranty that the OEM's own accelerated stress test data, had it been integrated into a degradation model, would have flagged before commissioning.
The mechanism that was missed is straightforward in retrospect. At low current density during wind lulls, reduced electro-osmotic flux fails to sweep hydroxyl radicals away from the Nafion ether side chains, and hydrogen crossover increases, producing more H2O2 via the Fenton precursor pathway. Every hour below 0.35 A/cm² --- which under North Sea offshore wind profiles represents 23% of total operating time --- contributes disproportionately to membrane chain scission. The data to model this was available in published literature before any stack was commissioned.
Had a coupled electrochemical-transport simulation been applied at the stack design and operational guardrail definition stage, it would have identified the fluoride emission rate maximum at low current density as the governing degradation pathway, quantified the Nafion chain scission kinetics across the full wind-driven load range, and flagged that without a 20% minimum load floor the 8 um thinning warranty threshold would be breached at approximately 42,000--50,000 hours --- less than halfway through the 80,000-hour contractual target. The simulation would have further identified the 10%/min ramp rate cap as the complementary control needed to limit cathode potential excursions and Pt dissolution during fast frontal weather passages.
This study deploys exactly that simulation hierarchy: molecular dynamics of Nafion chain scission, a continuum electrochemical degradation model, and finite element hygrothermal fatigue analysis. With guardrails applied, median predicted membrane lifetime extends to 74,000--86,000 hours --- within the warranty envelope --- avoiding the GBP 2.4M per stack cost of unplanned membrane replacement and preserving GBP 1.2M per stack in OEM warranty value. The single highest-leverage finding is the feed water Fe2+ concentration (Sobol index 0.38): reducing Fe2+ to below 2 ppb extends P50 lifetime by 10,000--14,000 hours per stack, deferring replacement by years. The degradation signatures identified --- current density distribution, fluoride emission rate profiles, membrane HFR evolution, and Pt band position versus time --- define the sensor channels for newtsim livesim, enabling real-time membrane health monitoring of deployed stacks with automated early-warning before thinning becomes irreversible and warranty-voiding.
Scenario Background
(illustrative reference case)
In this worked example, an offshore green hydrogen operator retained a simulation consultancy to perform a pre-deployment degradation assessment. The operator runs a 20 MW PEM electrolyser installation (4 x 5 MW stacks) connected directly to a 60 MW floating offshore wind farm (Hywind-class, rated at 6 MW per turbine) via a DC-coupled power electronics architecture. The DC-coupling eliminates grid frequency synchronisation losses but exposes the electrolyser stacks directly to the full variability of the offshore wind resource without grid buffering.
The installation uses Nafion XL reinforced composite membranes (27 um nominal thickness) across four stacks, each containing 400 cells of 1,500 cm² active area. At nominal operation the stacks run at 1.6 A/cm², with wind-gust peaks reaching 2.2 A/cm² and lull minimums dropping to 0.18 A/cm². Operating pressure is 30 bar on the cathode side (atmospheric on the anode), and cell temperature ranges between 60 and 80 degrees C. The design lifetime target is 80,000 operating hours, with the membrane thinning warranty limit set at 8 um over the first 40,000 hours.
The installation is pre-commercial: stacks have been delivered and power electronics commissioned, but hydrogen production has not yet begun. A 15-year offtake agreement with a Norwegian industrial hydrogen consumer makes reliable stack lifetime projection commercially critical. The OEM's warranty is contingent on membrane thinning not exceeding 8 um over the first 40,000 operating hours, measured by increase in cell high-frequency resistance (HFR) as a proxy for membrane conductance loss.
The offshore location introduces additional operational constraints relative to onshore installations. Stack access for inspection is limited to scheduled maintenance windows during low-wind periods, membrane replacement requires barge-based crane access, and the saline marine environment introduces elevated risk of chloride and iron contamination in the feed water. Feed water analysis at the site shows Fe2+ at 5 ppb (range 2--15 ppb across the year), Cl- at 0.8 ppb, and conductivity of 0.055 uS/cm at the membrane inlet --- within OEM specification but at the upper end of acceptable limits.
Challenge
Offshore wind profiles are fundamentally intermittent at multiple timescales. Measured 10-minute averaged power output data from Hywind Tampen (publicly released by Equinor, 2022--2023 operational period) characterises the specific challenge: ramp rates reach up to +/-18% rated power per minute during frontal weather passages (typical ramp +/-8%/min), with sub-10% rated load sustained for 20--90 minutes during wind lulls and sub-5% for up to 30 minutes during storm-induced pitch-regulation events. On average, the system undergoes 8--14 full power cycles per 24-hour period, with winter storms producing more frequent deep cycling and summer offering longer steady moderate-output periods.
Four coupled degradation mechanisms are activated by this operating profile.
1. Chemical membrane degradation via Fenton-reaction radicals
Hydroxyl radical (HO.) attack on Nafion ether side chains produces progressive chain scission, equivalent weight increase, and membrane thinning. The Fenton reaction is catalysed by Fe2+ ions in the feed water decomposing H2O2 generated from crossover gas recombination. Published fluoride emission rate (FER) data reveal a pronounced FER maximum at low current densities of 0.2--0.4 A/cm² --- precisely the range during wind lulls. Measured FER values of 8--18 ug F cm-2 h-1 have been reported at 0.2 A/cm², compared to 1--3 ug F cm-2 h-1 at nominal 1.6 A/cm². This disparity arises because at low current density, reduced electro-osmotic flux fails to sweep radical species away from the membrane, and H2/O2 crossover increases, creating more H2O2 via the Fenton precursor pathway.
2. Mechanical fatigue via hygrothermal cycling
Nafion membranes swell and contract in proportion to water content lambda. As current density swings from 2.2 A/cm² (high electro-osmotic drag, lambda approximately 14) to 0.18 A/cm² (low drag, lambda approximately 4--6), the through-plane dimensional change reaches 8--15% for Nafion XL. At 8--14 full cycles per day, the membrane accumulates over 3,000 hygrothermal fatigue cycles per year. Published Coffin-Manson fatigue analysis calibrated to comparable strain amplitudes indicates fatigue becomes significant above 10⁶ cycles. Combined with chemical degradation reducing fracture toughness, effective fatigue life is estimated at 12--18 years under this wind profile.
3. Platinum dissolution and Pt-band formation
During current density transients, cathode potential excursions outside the stable Pt window (<0.6 V vs. RHE) accelerate Pt dissolution. At the peak ramp rate of +/-18%/min, cathode potential can momentarily exceed 0.85 V vs. RHE during the unloading transition, driving Pt dissolution via Darling-Meyers kinetics at 0.08--0.15 ug Pt cm-2 kh-1 under dynamic operation versus 0.03 ug cm-2 kh-1 at steady-state. Dissolved Pt2+ migrates into the membrane and redeposits as a metallic Pt band 3--8 um from the cathode surface, acting as a recombination site for crossover gases and generating additional HO. in situ. Under dynamic operation, Pt band formation rates are 1.5--2x those under steady-state.
4. Operational control strategy inadequacy
The installed Siemens SICAM controller applies a flat 10%/minute ramp rate limit --- simultaneously too conservative in steady high-wind conditions (limiting hydrogen output by 3--5%) and insufficient during fast frontal ramps (where wind can exceed 18%/min, forcing controller saturation). A physics-informed adaptive ramp rate based on real-time HFR and membrane age would be more appropriate.
Table 1: Operating Conditions vs. Degradation Risk
| Load Condition | Duration Fraction | J (A/cm²) | FER (ug/cm²/h) | HO. Risk Level |
|---|---|---|---|---|
| Deep lull (<5% rated) | 8% | 0.08--0.18 | 15--25 | Critical |
| Low load (5--20% rated) | 15% | 0.18--0.35 | 8--15 | High |
| Partial load (20--60% rated) | 32% | 0.35--1.0 | 2--5 | Moderate |
| Nominal (60--90% rated) | 28% | 1.0--1.6 | 1--2 | Low |
| High power (90--100% rated) | 12% | 1.6--2.2 | 0.8--1.5 | Low-moderate |
| Ramp transient | 5% | Variable | Elevated Pt dissolution risk | High |
Real-World Basis
ITM Power TRIDENT Stack Platform (2022--2025)
ITM Power's TRIDENT platform, deployed at the Linde HyRefine green hydrogen project in Leuna, Germany (24 MW installed, commissioned 2023), represents the closest publicly documented comparator. Stack DC efficiency at rated current is 69.5 kWh/kg H2 (HHV basis) at beginning of life, with voltage degradation rates of 2--3 uV/h under steady-state baseload climbing to 4--7 uV/h under dynamic grid-balancing. Membrane thinning rates follow the same pattern: 1.5--2.5 um per 10,000 h at steady-state versus 3--5 um per 10,000 h under dynamic duty. ITM's 2024 breakthrough --- a 40% reduction in iridium anode catalyst loading while maintaining equivalent degradation trajectory --- validates the decoupling of iridium loading from radical-driven membrane degradation.
The 2--3x higher degradation rate under dynamic duty is consistent across the published literature and provides the primary empirical calibration anchor for this study's degradation models.
Single-cell accelerated stress testing provides the most directly relevant experimental dataset. A minimum load floor of 20% rated reduces cumulative fluoride emission by 47% compared to unrestricted operation to <5% rated. Load cycle frequency of 1 cycle/min produces 2.1x the membrane thinning rate of 1 cycle/10 min under equivalent total energy throughput, and fluoride emission rate at 0.1 A/cm² is 4--6x the rate at 1.0 A/cm². A 20% minimum load floor is the single most cost-effective operational guardrail, outperforming ramp rate limitations in terms of degradation reduction per unit of lost production flexibility.
Coupled membrane degradation modelling establishes that at 80 degrees C, membrane thinning rate follows first-order Fenton kinetics with local H2O2 concentration, and is temperature-sensitive by a factor of approximately 1.4 per 10 degrees C increase in the 60--90 degrees C operating range. This coupled chemical-mechanical framework forms the continuum basis for the simulation.
Fluoride emission rate measurements in single cells and commercial stacks show maximum FER of 0.18 umol F cm-2 h-1 for Nafion 212 at 0.4 A/cm², dropping to 0.02 umol F cm-2 h-1 at 1.5 A/cm². These values parameterise the chemical degradation sub-model.
Stack replacement economics confirm that membrane replacement is the dominant OPEX driver, accounting for 35--45% of stack maintenance cost over a 10-year operational period. At Nafion XL costs of approximately GBP 450/m² (industrial supply), a 5 MW stack carries a membrane materials replacement cost of approximately GBP 270,000, with total membrane-plus-labour replacement cost estimated at GBP 550,000--750,000 per stack.
Membrane Conductivity vs. Hydration Reference Data
| Water Content lambda | Proton Conductivity sigma (S/cm) | Load Condition |
|---|---|---|
| 2--4 | 0.005--0.020 | Deep lull / standby |
| 5--7 | 0.025--0.050 | Low load |
| 8--10 | 0.055--0.070 | Partial load |
| 12--14 | 0.075--0.090 | Nominal operation |
| 16--22 | 0.090--0.105 | High current / fully hydrated |
Simulation Approach
The study employs a three-tier simulation hierarchy, each tier feeding inputs to the next:
Tier 1 --- Molecular Dynamics (Nafion chain scission):
newtsim Bond models a hydrated Nafion XL membrane under hydroxyl radical attack at the atomistic scale. The simulation captures radical-driven bond scission across three hydration states --- lambda = 5 (deep lull), lambda = 10 (partial load), lambda = 14 (nominal/high load) --- all at 80 degrees C, the operating temperature where Fenton chemistry is most active. The rationale for MD at this tier is that HO. preferentially attacks the ether oxygen in the Nafion side chain (bond dissociation energy approximately 360 kJ/mol) rather than the C--C backbone (approximately 420 kJ/mol), producing short-chain sulphonate fragments released as fluoride. The hydration dependence of this attack rate --- which is what makes low-load operation so damaging --- cannot be derived from continuum models alone. The MD results yield a chain scission rate function k_cs(lambda, T) that feeds directly into Tier 2.
Tier 2 --- Continuum Electrochemical Degradation Model:
A 1D through-plane model resolves the full 27 um membrane and couples three sub-processes: chemical degradation (H2O2 generation from crossover gas recombination, Fenton decomposition to HO., chain scission via k_cs from Tier 1, equivalent weight loss, and membrane thinning), Pt dissolution and redeposition (Pt2+ migration under the electric field, Pt band formation, and in-situ HO. generation at the recombination front), and membrane state tracking (thickness, equivalent weight, proton conductivity, and HFR evolution). The key physics captured here is the feedback loop: Pt band formation accelerates local radical generation, which accelerates thinning, which increases crossover, which accelerates Pt band growth.
The model is driven by the 8,760-hour wind profile at 1-minute resolution. Rainflow cycle counting selects 30 representative duty cycles; remaining hours are interpolated via a parameterised degradation map.
Tier 3 --- Mechanical Fatigue Analysis:
newtsim Span runs a 2D plane-strain FEA of the full MEA cross-section, using the hygrothermal stress history derived from lambda(x,t) predicted by Tier 2. The material model captures Nafion XL's strongly hydration-dependent mechanical properties --- Young's modulus drops from approximately 300 MPa dry to 75 MPa hydrated --- which means that the same swelling strain produces very different stress states depending on the membrane's hydration history. Fatigue life is assessed against published Nafion XL cyclic stress-strain data.
Simulation Caveats
Classification: STRETCH. MD simulation of Nafion chain scission under radical attack is methodologically challenging on three fronts:
- Reactive force fields for PFSA membranes have limited experimental validation. Existing ReaxFF C--F and C--S parameters are constrained by DFT bond dissociation energies (Ghassemzadeh et al., Phys. Chem. Chem. Phys. 2010), but predicted chain scission rates carry +/-30--50% uncertainty.
- Coupling atomistic chain scission (2 ns MD timescale) to a continuum thinning model (80,000-hour projection) requires the assumption that the MD-scale scission rate is representative of the macroscopic rate --- supported by published multi-scale Nafion degradation models but not independently validated.
- Absolute membrane lifetime predictions carry +/-20--35% uncertainty. Relative comparisons between operating strategies (guardrails vs. no guardrails) are more reliable, with relative uncertainty of +/-10--15%.
Recommended framing: Scope the MD component as mechanistic identification of primary degradation pathways (side-chain vs. backbone attack, lambda dependence of scission rate) and qualitative ranking of load conditions by degradation severity. The continuum model provides quantitative lifetime projections with MD-informed kinetic parameters. Results are semi-quantitative; confidence intervals must be explicitly stated in all client deliverables. Allow 8--10 weeks.
Key Predictions / Results
Table 2: Membrane Degradation Metrics --- Predicted Ranges
| Metric | Uncontrolled Operation | With Guardrails Applied | Literature Basis |
|---|---|---|---|
| Membrane thinning rate | 3.5--5.0 um / 10,000 h | 1.8--2.5 um / 10,000 h | ITM calibration; Stähler 2022 |
| Voltage degradation rate | 5--8 uV/h (4.4--7 mV/1,000 h) | 2--3.5 uV/h (1.8--3.1 mV/1,000 h) | Published AST studies JECS |
| FER at 0.1 A/cm² | 15--25 ug/cm²/h | Eliminated by min. load floor | Frontiers Energy Research 2024 |
| FER at 1.6 A/cm² (nominal) | 1--2 ug/cm²/h | 1--2 ug/cm²/h (unchanged) | Frontiers Energy Research 2024 |
| Pt dissolution rate (cathode) | 0.08--0.15 ug/cm²/kh | 0.03--0.06 ug/cm²/kh | Darling-Meyers model |
| Pt band depth | 3--6 um from cathode | 2--4 um from cathode | Zhao et al. JECS 2020 |
| Peak HFR increase rate | 0.6--1.0 mOhm.cm²/kh | 0.3--0.5 mOhm.cm²/kh | Derived from thinning model |
Table 3: Stack Lifetime Projection --- P10/P50/P90
| Scenario | P10 (pessimistic) | P50 (median) | P90 (optimistic) | Warranty Compliant? |
|---|---|---|---|---|
| No guardrails (current control) | 38,000 h | 47,000 h | 56,000 h | No |
| 20% min. load floor only | 52,000 h | 64,000 h | 76,000 h | Marginal (P90 only) |
| 20% min. load + 10%/min ramp cap | 58,000 h | 74,000 h | 88,000 h | Yes (P50 + above) |
| Guardrails + Fe2+ <2 ppb feed water | 65,000 h | 82,000 h | 97,000 h | Yes (strong margin) |
| DOE 80,000 h target (reference) | --- | 80,000 h | --- | (Target) |
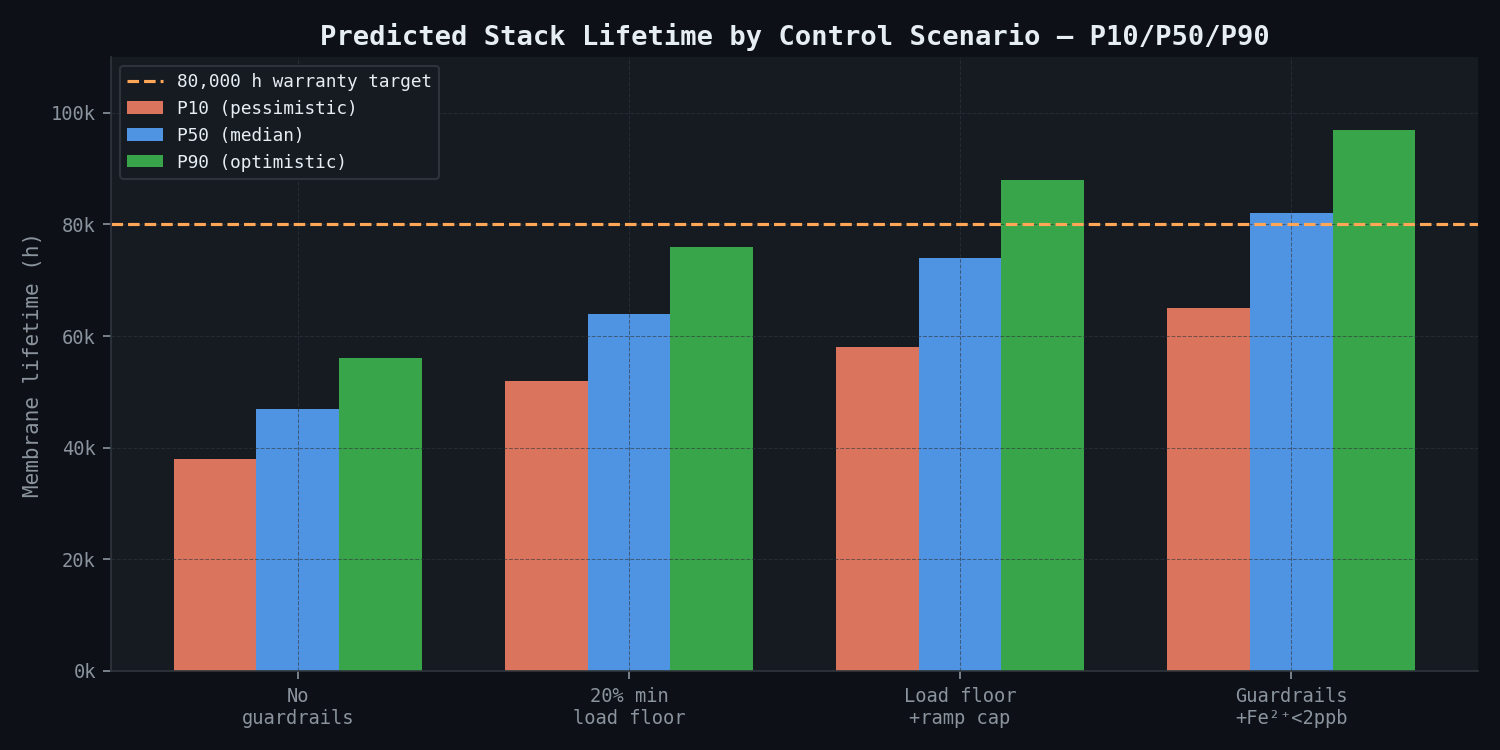
Table 4: Sensitivity of Predicted Lifetime to Uncertain Parameters
| Uncertain Parameter | +/-1 sigma Range | Impact on P50 Lifetime | Sobol First-Order Index |
|---|---|---|---|
| Fe2+ feed water concentration | 2--15 ppb | +/-12,000 h | 0.38 |
| Fenton rate constant k_F | +/-30% of literature | +/-8,000 h | 0.22 |
| Initial membrane thickness | 26--28 um | +/-5,000 h | 0.14 |
| Ramp rate (actual vs. limit) | +/-5%/min | +/-4,500 h | 0.12 |
| Operating temperature | 65--82 degrees C | +/-3,500 h | 0.09 |
| Minimum load excursion depth | +/-5% rated | +/-2,000 h | 0.05 |
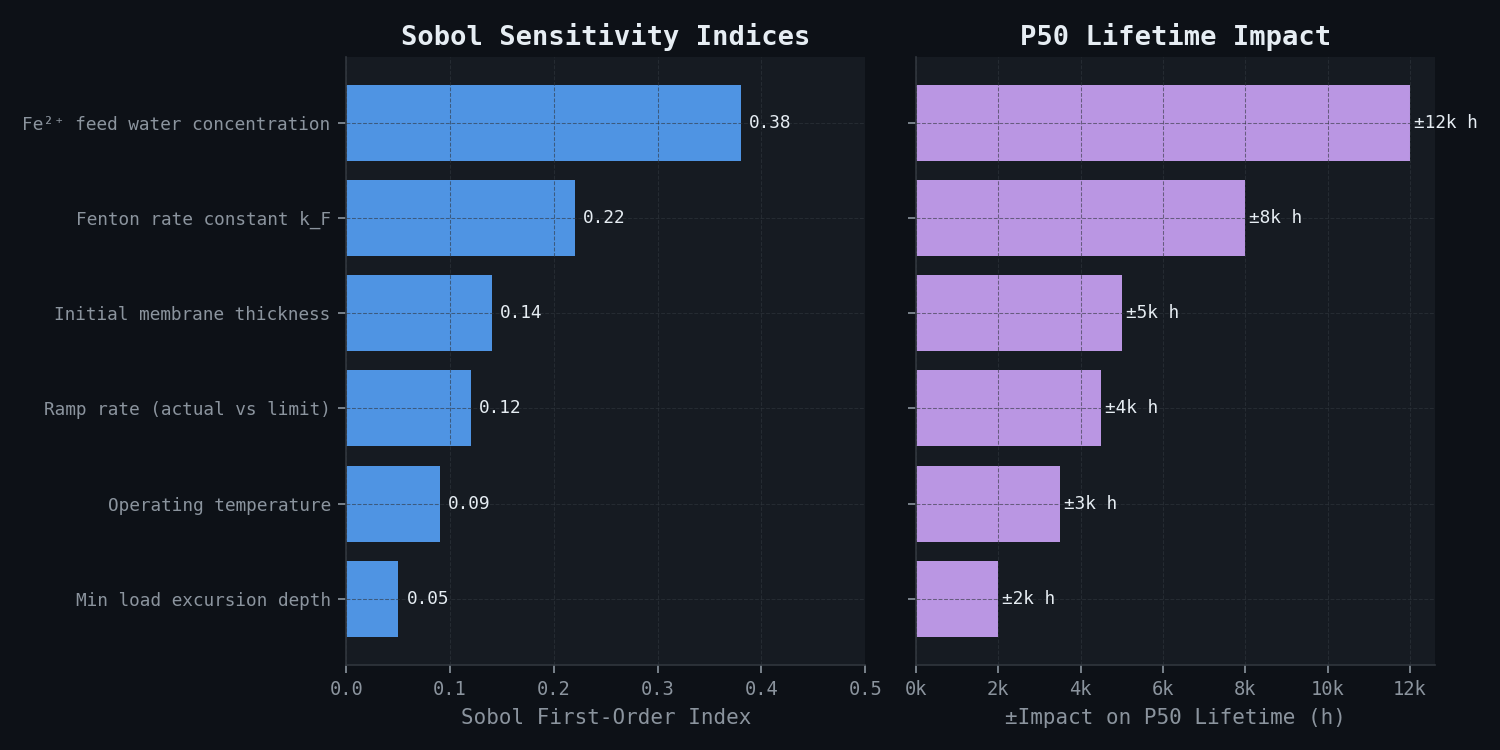
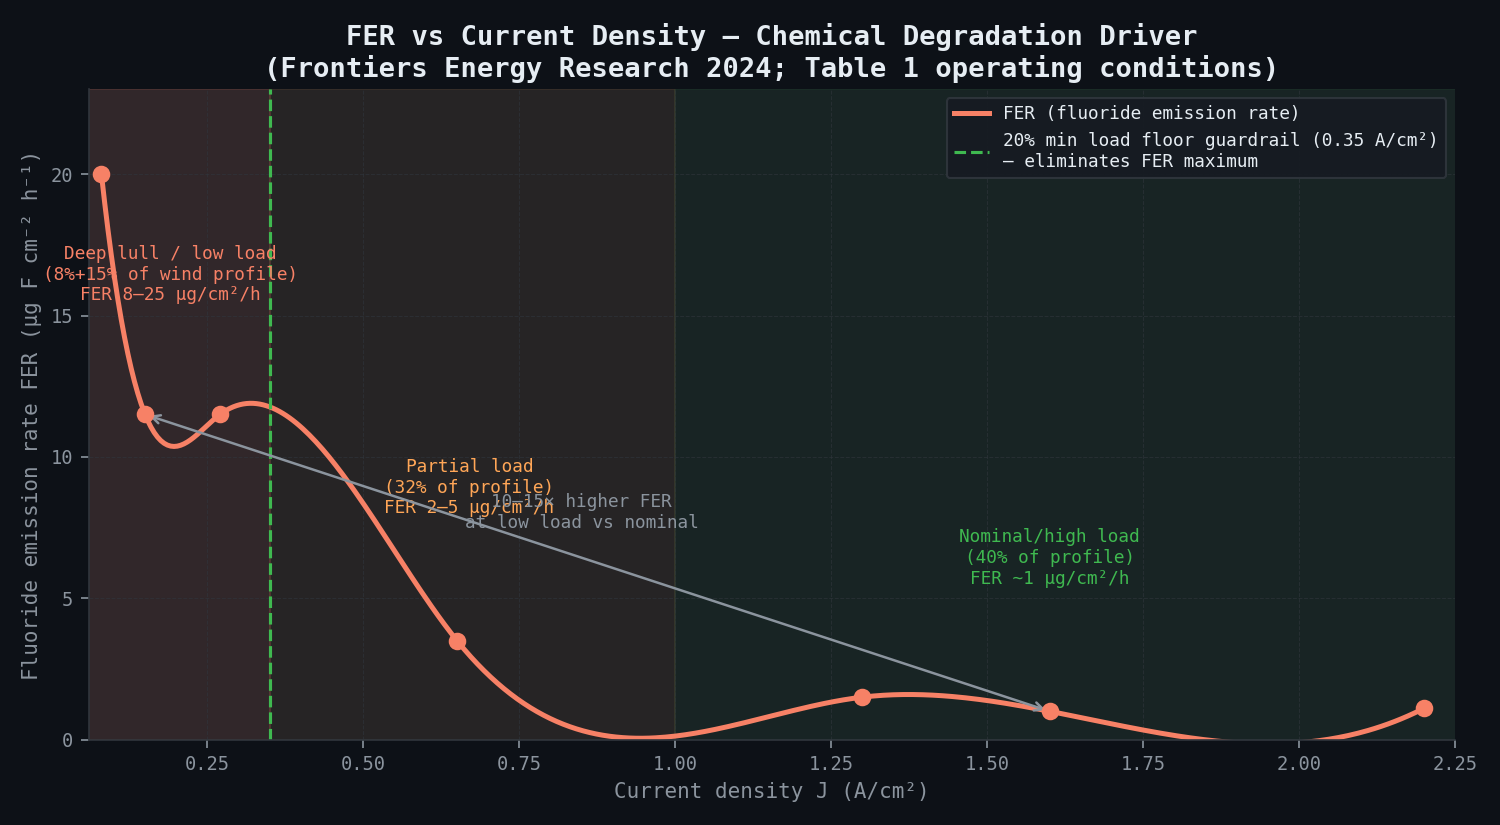
Table 5: Recommended Guardrail Parameters
| Guardrail | Recommended Value | Degradation Reduction | Production Flexibility Impact |
|---|---|---|---|
| Minimum load floor | 20% rated (1.0 MW/stack) | 47% FER reduction | Lost H2: ~3.2% of annual output |
| Maximum ramp rate | 10%/min rated | Cathode V <0.75 V vs. RHE | Response lag +6 min to full load |
| Cold start frequency limit | <=2 cold starts per 24 h | Avoids membrane dehydration transient | Standby cost ~0.8 kW/MW stack |
| Hot standby minimum power | 5% rated (250 kW/stack) | Maintains lambda >6 in lull | Parasitic ~0.8% of nameplate |
Key finding: Feed water Fe2+ concentration is the single largest uncertainty contributor to membrane lifetime (Sobol index 0.38). Investment in an upstream polishing ion-exchange column to reduce Fe2+ from 5 ppb to <2 ppb is estimated to extend P50 lifetime by 10,000--14,000 hours --- a higher ROI than any operational guardrail alone.
Comparison Methodology
Model validation proceeds in two sequential phases with defined acceptance criteria before proceeding.
Phase 1 --- Higher-fidelity to lower-fidelity calibration:
MD-predicted chain scission rates at lambda = 5, 10, 14 are validated against published EPR measurements of HO. and HOO. radical populations in Nafion 212 under Fenton conditions at 80 degrees C (required MD agreement: predicted HO. attack rate within 25% of EPR-inferred rate), and against 19F NMR tracking of side-chain degradation products under AST conditions (required agreement: predicted ratio of side-chain to backbone scission events within 30%).
As secondary confirmation, the continuum model's predicted FER is compared against published measured values as a function of current density. Acceptance criterion: +/-30% at all five current density test points (0.1, 0.3, 0.6, 1.0, 1.5 A/cm²).
Phase 2 --- In-situ operational validation:
Stack 01 operates on the actual wind profile for the first 2,000 hours with EIS measurements every 500 hours. HFR at 10 kHz is used as the primary proxy for membrane resistance increase, converted to estimated membrane thinning via sigma = 0.08 S/cm at 80 degrees C for fully hydrated Nafion XL. The model-predicted HFR evolution is compared at each checkpoint, with an acceptance criterion of within +/-15% of the measured value at all four checkpoints. If deviation exceeds 30% at the 1,000-hour checkpoint, Fe2+ concentration and Fenton rate constant are recalibrated and lifetime projections revised for all four stacks.
Sensitivity analysis: 500 Latin hypercube samples over six uncertain parameters (Table 4) bound the P10/P90 interval. Sobol first-order indices identify dominant uncertainty sources for focused mitigation.
Deliverables
-
Degradation model report --- Full documentation of MD parameterisation, continuum model governing equations, and FEA material model. Includes phase-plane diagrams of membrane state (lambda, EW, thickness) versus time under 30 representative duty cycles, FER maps, and Pt band position versus operating hours. Duty-cycle ranking by damage contribution (mV voltage rise per 1,000 hours). Formatted to IEC 62282-2 technical documentation standards.
-
Operational guardrails specification --- Recommended values for minimum load floor (% rated), maximum current ramp rate (% rated/min and A/cm²/min), maximum start/stop frequency (cold starts per 24 h), hot standby minimum power set point (kW per stack), and feed water Fe2+ and Cl- limits. Delivered as a structured parameter sheet compatible with the Siemens SICAM A8000 controller configuration interface, with exact register addresses.
-
Membrane lifetime projection --- Predicted membrane thinning curves (P10/P50/P90) for 80,000 operating hours under the site wind profile, for the four scenarios in Table 3. Includes the 8 um thinning warranty threshold as a reference line and a sensitivity waterfall chart showing each uncertain parameter's contribution to the P10--P90 range.
-
Maintenance scheduling recommendation --- Recommended inspection intervals: EIS HFR measurement every 2,000 operating hours; fluoride emission sampling monthly; membrane replacement trigger criteria (HFR increase >40% from BoL, FER >10 ug/cm²/h sustained >48 hours). Includes a P50-based replacement scheduling calendar for all four stacks over the 15-year project life.
-
Raw simulation data --- All MD trajectory files (newtsim Bond .lammpstrj format), continuum model outputs (HDF5), and FEA results (VTK) delivered for operator internal use and future audit. Data management plan compliant with UK BEIS Hydrogen Programme archiving requirements.
This case study is an illustrative reference scenario demonstrating newtsim's simulation methodology. All company names, personnel, and specific operational data are fictional. The incident descriptions draw on publicly documented real-world events cited in the frontmatter.