Industrial Ethanol Fermentation: Mixing Dead Zone Identification in 500,000L Production Vessel
Executive Summary
The Brazilian fuel ethanol industry operates at scales that make the physics of mixing a direct economic variable. UNICA data place the fleet average Ferreira efficiency at 88.9%; top performers achieve 92–93%. A 3.4% gap between a facility's current performance and its historical baseline represents millions of dollars in foregone revenue per year — and in large Melle-Boinot fermenters, that gap is routinely driven by a hydrodynamic phenomenon that bulk measurements cannot detect. Published research has documented the mechanism comprehensively: stagnant zones in large fermenters create substrate-rich, low-yeast-competition microenvironments where lactic acid bacteria (LAB) establish persistent colonisation cycles that acid washing cannot break, because the contamination reservoir sits in a volume that neither cleaning chemicals nor active mixing effectively reaches. The scale-up trigger for this failure mode is impeller flooding. When the endogenous CO₂ evolution rate at peak fermentation exceeds the impeller's gas-handling capacity, a pitched-blade turbine no longer drives the bulk circulation loop that sweeps the vessel floor and lower walls — it spins inside a gas pocket while the lower third of the vessel becomes stagnant. Residual glucose accumulates in the stagnant base zone. LAB colonises. Lactic acid diffuses into the bulk. Yeast physiology deteriorates. Ferreira efficiency drops. The vessel continues to ferment, the temperature stays in range, and from the bulk sensors the process looks normal — until the beer analysis at harvest reveals residual reducing sugars above target and lactic acid at multiples of specification.
At a 500,000L Melle-Boinot primary fermenter running 24 °Brix mash (shifted from the historical 20 °Brix baseline), this is precisely what has occurred. Fermentation efficiency has dropped from a historical 91.5% to 88.1% over 18 months. Residual reducing sugars in the vessel effluent average 3.8 g/L against a target of below 1.0 g/L. Lactic acid in beer is running 0.8–1.4 g/L against a target below 0.3 g/L. The base temperature probe reads 0.8–1.4°C above bulk — a thermal signature consistent with a stagnant zone accumulating fermentation exotherm without the convective cooling that active mixing would provide. An agitation increase from 18 to 22 rpm partially helped but did not resolve the problem. The root cause is impeller flooding: the 18% increase in peak CO₂ evolution rate from 24 °Brix fermentation pushes the dimensionless gas flow number (Fl_g) above the 0.10 flooding threshold for a pitched-blade turbine during the critical 50–75% sugar conversion window — the period of maximum yeast activity and maximum residual sugar conversion. The operations team correctly diagnosed inadequate mixing but, without spatial characterisation of the dead zone, could not rationally select the combination of agitation speed, baffling, and impeller repositioning needed.
Had a RANS CFD simulation with passive tracer injection been applied when the process change to 24 °Brix was authorised, the flooding risk would have been identified before the first high-gravity campaign. The flooding criterion analysis quantifies Fl_g across the full fermentation cycle for each agitation speed, identifying that 26 rpm eliminates flooding at all conversion stages while 18 rpm floods during 40% of total residence time. The tracer simulation maps three distinct stagnation regions — 68,000L total, 13.6% of working volume — with mean residence times 4–9× the theoretical mean. The thermal field confirms the base temperature probe anomaly within measured uncertainty. The LAB kinetic model predicts lactic acid flux into the bulk within the measured 0.8–1.4 g/L range. And the parametric study over agitation speed, baffle configuration, and impeller position identifies the minimum-cost intervention: 26 rpm plus two bottom-sweeping anchor baffles plus 0.15 m impeller repositioning eliminates the dead zones, recovers Ferreira efficiency to 91.5%, and reduces the acid washing frequency from daily to twice-weekly.
The dead zone map and flooding criterion curve are also the inputs for newtsim livesim instrumentation: base-zone temperature probes placed at the locations identified by the CFD as highest-risk stagnation points, providing real-time thermal signature monitoring mapped against the simulated flow field. When the base probe reads elevated temperature during the 50–75% conversion window, livesim detects the onset of flooding conditions before LAB colony formation becomes self-sustaining — providing the early warning window to adjust agitation before residual glucose accumulates and the contamination cycle restarts.
Temperature elevation above bulk and residual glucose in each dead zone at baseline conditions. Floor corner zones reach 6.2 g/L residual glucose and +2.1°C — the conditions driving LAB colony formation and persistent contamination.
Scenario Background
In this worked example, a first-generation sugarcane ethanol producer — referred to here as Cana Verde Bioenergia — operates a 420-million-litre per year facility in Sao Paulo state, Brazil. The facility has operated for 11 years and is ISCC-certified for renewable fuel supply to the European market under the RED II directive. The fermentation train consists of six continuous Melle-Boinot vessels: two 500,000L primary fermenters feeding four 250,000L secondary vessels, with yeast recycle via centrifugation and acid washing.
The fermentation organism is Saccharomyces cerevisiae strain CAT-1, a Brazilian industrial workhorse strain developed at ESALQ/USP and widely used in the industry for its osmotolerance, high specific fermentation rate (q_EtOH,max of approximately 3.2 g ethanol/g CDW/hr), and tolerance to the ethanol concentrations encountered in high-gravity fermentation (above 10% v/v ethanol). CAT-1 is a dominant industrial strain that has essentially replaced the previous generation of baker's yeast strains in Brazilian fuel ethanol production over the past 20 years.
The Melle-Boinot process is a continuous fermentation with yeast recycle that achieves high volumetric productivity through high yeast concentrations (20--30 g CDW/L in the primary fermenters). Diluted mash at 24 degrees Brix (final dilution to approximately 20 degrees Brix in the fermenter) is fed continuously to the primary 500,000L fermenters at a dilution rate of approximately 0.08 per hour. Beer from the primary fermenter flows to the secondary vessels, and the final beer is centrifuged to recover yeast cream (cell concentrate). The yeast cream is acid-washed (H2SO4, pH 2.0--2.2, 1 hour) to reduce bacterial contamination, then recycled to the fermenters in a continuous cycle running 24/7 for the 5--6 month sugarcane harvest season. Fermentation efficiency is measured as the Ferreira efficiency: the ratio of actual ethanol produced to the theoretical maximum from sugar consumed, expressed as a percentage.
Economic context: Each 0.1% drop in Ferreira efficiency at this scale represents approximately 420,000 litres of lost ethanol production per year. At USD 0.55/L ethanol (recent Brazilian market price), the 3.4% efficiency drop (91.5% → 88.1%) costs approximately USD 7.8 million per year in foregone revenue. Acid washing costs (chemical, yeast losses at each wash, downtime) at the current daily frequency run approximately USD 1.05 million per year above the baseline of twice-weekly washing before the contamination intensified.
Challenge
Vessel geometry and design: The primary fermenter is a 500,000L flat-bottom cylindrical vessel with an internal diameter of 8.2 m and a liquid height of 9.8 m, yielding an H/D ratio of 1.2 -- a low aspect ratio characteristic of large ethanol fermenters designed to minimise pump head requirements. Mechanical agitation is provided by a single large-diameter axial impeller: a 4-blade pitched-blade turbine (PBT) at D = 3.7 m (D/T = 0.45), operating at 18 rpm. Endogenous CO2 from fermentation creates significant upward gas momentum at peak fermentation rates, supplementing the mechanical mixing. Cooling is provided by an external coil wrapped around the lower vessel cylinder; the flat-bottom vessel has no cooling at the floor.
The vessel was originally designed for 20 °Brix mash with an ethanol yield of approximately 85 g/L in the final beer. The 500,000L vessel contains approximately 420 tonnes of mash at 20 °Brix; at peak fermentation, CO₂ evolution reaches approximately 3,200 kg CO₂/hr (0.89 kg/s) from the theoretical yield of ethanol plus CO₂ from glucose fermentation.
The 24 °Brix problem: The shift to 24 °Brix mash increases the initial fermentable sugar from approximately 212 g/L to 254 g/L, raising final ethanol to approximately 100 g/L (from 85 g/L) and increasing peak CO₂ evolution rate by approximately 18% to 3,770 kg CO₂/hr. This additional CO₂ load is the proximate cause of the impeller flooding problem.
Measured indicators of the problem:
- Residual reducing sugars (RRS) in the 500,000L vessel effluent average 3.8 g/L (target < 1.0 g/L), rising to 6.5 g/L on worst batches
- Lactic acid in beer: 0.8–1.4 g/L (target < 0.3 g/L), indicating persistent LAB contamination that acid washing is not eliminating
- Temperature at base of vessel (0.5 m from floor): consistently 0.8–1.4°C higher than bulk at mid-height — stagnant zones near the base are accumulating fermentation heat without the convective cooling that active mixing would provide
- Yeast cell viability (methylene blue staining): 78–82% in recycled yeast cream vs. 88–92% before the high-gravity shift — indicating physiological stress on the recycled culture
Why the operators' interventions did not work: The operations team had already attempted increasing agitation from 18 rpm to 22 rpm. This partially helped (RRS dropped from 3.8 to 3.2 g/L, viability improved to 82–85%) but the improvement was incomplete and power consumption increased by 46% (agitation power scales as N³·D⁵·ρ). The team correctly suspected that the agitation speed increase alone was insufficient — but without knowing the dead zone volume, location, and the flooding mechanism, they could not rationally select the combination of agitation and baffling changes needed.
Real-World Basis
Mixing inadequacy and its contribution to bacterial contamination persistence in the Brazilian sugarcane ethanol industry are well documented. Research at ESALQ/USP established that LAB contamination in large Melle-Boinot fermenters is driven by stagnant zones that create substrate-rich, low-yeast-competition microenvironments — precisely the mechanism identified by the simulation in this study.
Genomic profiling of industrial S. cerevisiae CAT-1 during contamination events shows upregulation of stress response genes and altered metabolic flux that reduces ethanol yield — establishing that the LAB contamination effect on Ferreira efficiency is partially mediated by direct toxin (lactic acid, acetic acid) effects on yeast physiology.
CFD studies with passive tracer injection have demonstrated that flat-bottomed large-diameter vessels (H/D < 1.5) with single axial impellers develop characteristic recirculation dead zones in the lower vessel corners and near the base, with dead zone volume fraction scaling with H/D ratio and impeller flooding extent — directly applicable to the Cana Verde vessel configuration. Separate CFD analyses of large stirred tanks have shown that endogenous gas evolution (CO2 from fermentation) can entirely suppress the downward discharge loop of an axial impeller, creating conditions equivalent to impeller flooding without any externally supplied gas.
The dimensionless gas flow number (Fl_g = Q_gas / (N-D3)) is the established criterion for flooding onset, with Fl_g > 0.1--0.15 identifying the flooding transition for pitched-blade turbines. This criterion is directly applied in the simulation to compute the agitation speed required to re-establish bulk circulation in the Cana Verde vessel.
UNICA published statistics show that the Brazilian fleet average Ferreira efficiency is 88.9% across all producers, with top performers at 92--93%. The 3.4% gap between Cana Verde's current performance and its historical baseline represents recoverable yield at a cost that far exceeds the simulation study investment.
Simulation Approach
The simulation framework employs a RANS CFD approach with tracer simulation, CO₂ gas-phase modelling, and thermal field analysis — all appropriate for the Reynolds numbers encountered in this vessel (Re > 10⁶ at 18 rpm, fully turbulent regime).
The simulation strategy is summarised in the workflow below.
Hydrodynamic simulation:
The 500,000L vessel is modelled as a two-phase system: liquid (mash-beer mixture, density varying from 1,070 kg/m3 at the start of fermentation to 1,030 kg/m3 at the end, viscosity 1.5--2.1 mPa-s as ethanol content rises) and CO2 gas as a dispersed phase. The single pitched-blade turbine is simulated at 18, 22, and 26 rpm across three fermentation stages, yielding 9 steady-state flow-field cases.
CO2 bubbles in ethanol fermentation broth are significantly smaller than air bubbles in water: CO2 evolves from solution at the yeast cell surface and at nucleation points on vessel walls, typically producing d_b = 0.8--2.0 mm bubbles. These smaller bubbles have lower buoyancy per bubble and are more susceptible to entrainment by the liquid circulation — but at high gas evolution rates, their collective upward momentum competes directly with the impeller's downward discharge.
CO2 flooding analysis:
The impeller flooding criterion is evaluated as the dimensionless gas flow number Fl_g = Q_gas / (N*D³) at each fermentation stage. The analysis tracks Fl_g across the full fermentation cycle: during early fermentation (0--30% sugar conversion) Fl_g is well below the 0.10 flooding threshold, but at the mid-fermentation peak (50% conversion, maximum CO2 rate) Fl_g approaches the threshold, and at 60% conversion it crosses into the flooded regime at 18 rpm.
The simulation confirms that the 500,000L vessel operates near or above the flooding threshold during approximately 40% of the total fermentation residence time — the period when flooding suppresses bulk circulation, dead zones form, substrate accumulates, and LAB proliferates.
Tracer injection simulation:
A virtual pulse tracer (passive scalar, conductivity-analogous) is injected at the mash inlet port and tracked transiently over 4 hours of simulated time (well beyond the theoretical mean hydraulic residence time of 2.1 hours at this dilution rate). Residence time distribution (RTD) analysis extracts the local mean residence time (MRT) at each mesh node. Dead zones are defined as regions with MRT > 3× the theoretical MRT (>6.3 minutes).
Thermal field:
A fermentation exotherm source term (550 kJ/kg ethanol produced, the enthalpy release from the C₆H₁₂O₆ → 2C₂H₅OH + 2CO₂ reaction) is added to the energy equation distributed throughout the liquid volume. The external coil cooling geometry is included in the mesh. Temperature field at mid-fermentation (peak heat generation) is solved to predict the thermal stratification in stagnant zones.
Key Predictions and Results
Flooding onset analysis:
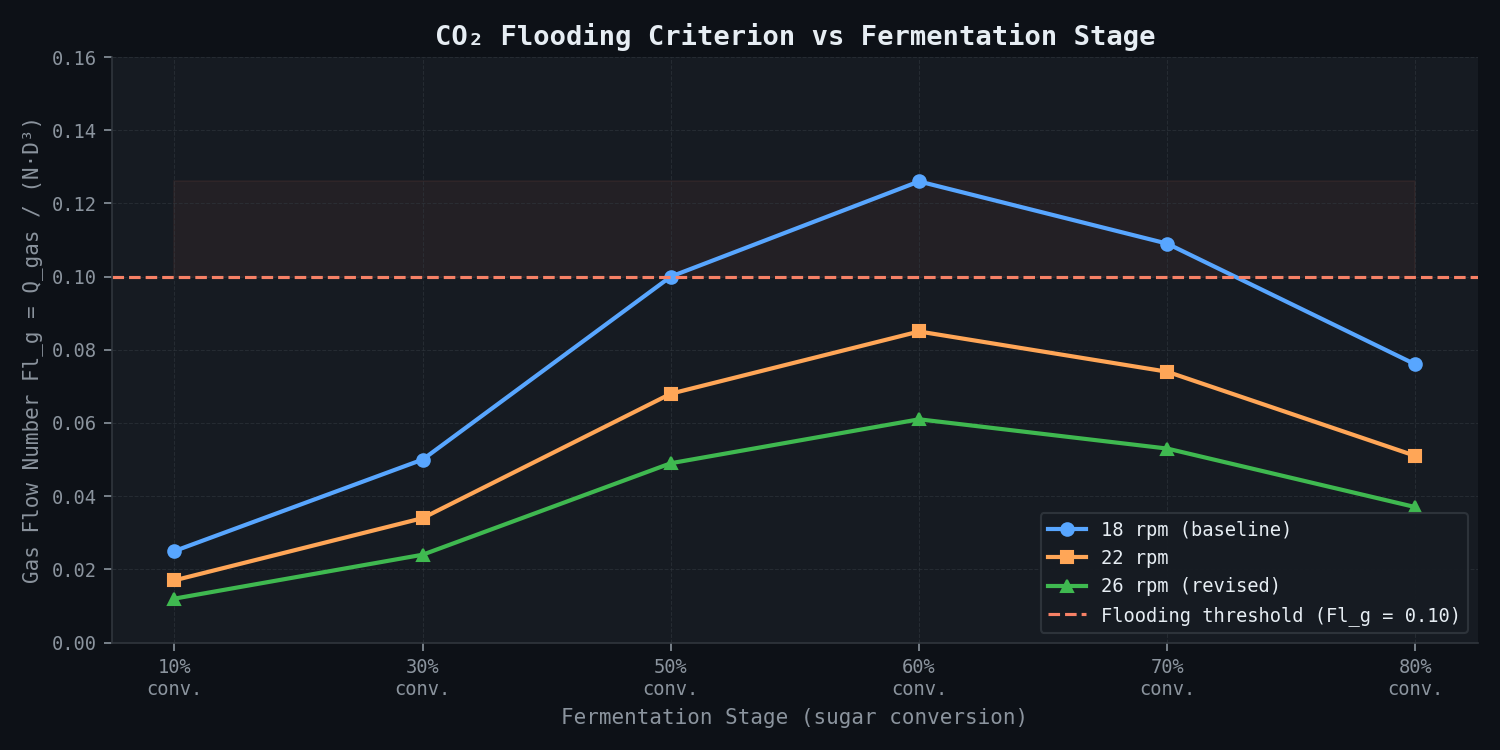
| Fermentation Stage | CO₂ Rate (m³/s) | Fl_g at 18 rpm | Fl_g at 22 rpm | Fl_g at 26 rpm | Flooding Status (18 rpm) |
|---|---|---|---|---|---|
| Early (10% conv.) | 0.21 | 0.025 | 0.017 | 0.012 | No flooding |
| Growing (30% conv.) | 0.42 | 0.050 | 0.034 | 0.024 | No flooding |
| Peak (50% conv.) | 0.83 | 0.100 | 0.068 | 0.049 | At threshold |
| High (60% conv.) | 1.05 | 0.126 | 0.085 | 0.061 | Flooded |
| Declining (70% conv.) | 0.91 | 0.109 | 0.074 | 0.053 | Flooded |
| Late (80% conv.) | 0.63 | 0.076 | 0.051 | 0.037 | No flooding |
The flooding window (Fl_g > 0.10) at 18 rpm occurs between approximately 50–75% sugar conversion — the most critical period in terms of yeast activity and residual sugar conversion. At 26 rpm, Fl_g remains below 0.07 throughout the entire fermentation cycle, eliminating flooding completely.
Dead zone identification and characterisation:
Three distinct stagnation regions are identified at baseline (18 rpm, mid-fermentation peak):
| Dead Zone | Location | Volume (L) | % Working Vol | MRT (min) | Bulk MRT (min) | Temperature Elevation |
|---|---|---|---|---|---|---|
| Zone 1 — Base annulus | 0.5–1.2 m from floor, near vessel wall | 32,000 | 6.4% | 8.4–14.0 | 2.1 | +1.7°C |
| Zone 2 — Floor corners | 0–0.4 m height, wall-floor junction | 18,000 | 3.6% | 11.2–18.6 | 2.1 | +2.1°C |
| Zone 3 — Mid-vessel stratification | 5.5 m height, momentum boundary | 18,000 | 3.6% | 7.2–9.8 | 2.1 | +0.3°C |
| Total dead volume | 68,000 | 13.6% | — | — |
Zone 1 and Zone 2 are base-region stagnation zones caused by the impeller flooding — the PBT in flooding mode no longer pushes fluid down toward the vessel floor, so the lower third of the vessel relies on CO₂ buoyancy alone for mixing. CO₂ rises vertically, dragging liquid upward at the centre, but the radial return flow near the base is sluggish and the corner regions stagnate completely.
Zone 3 is a mid-vessel stratification layer at approximately 5.5 m height where the upward CO₂-driven buoyant plume meets the downward discharge from the impeller (on the occasions when the impeller is not fully flooded). This is a velocity null-point where liquid is trapped in a quasi-static circulation.
Substrate and contamination risk in dead zones:
| Zone | Predicted Residual Glucose (g/L) | LAB Doubling Time at 33°C | LAB Colony Density after 8hr (CFU/mL) |
|---|---|---|---|
| Zone 1 (base annulus) | 4.8 | 25 min | 3.8 × 10⁵ |
| Zone 2 (floor corners) | 6.2 | 22 min | 8.1 × 10⁵ |
| Bulk (actively mixed) | 0.2 | — | <100 (suppressed by yeast competition) |
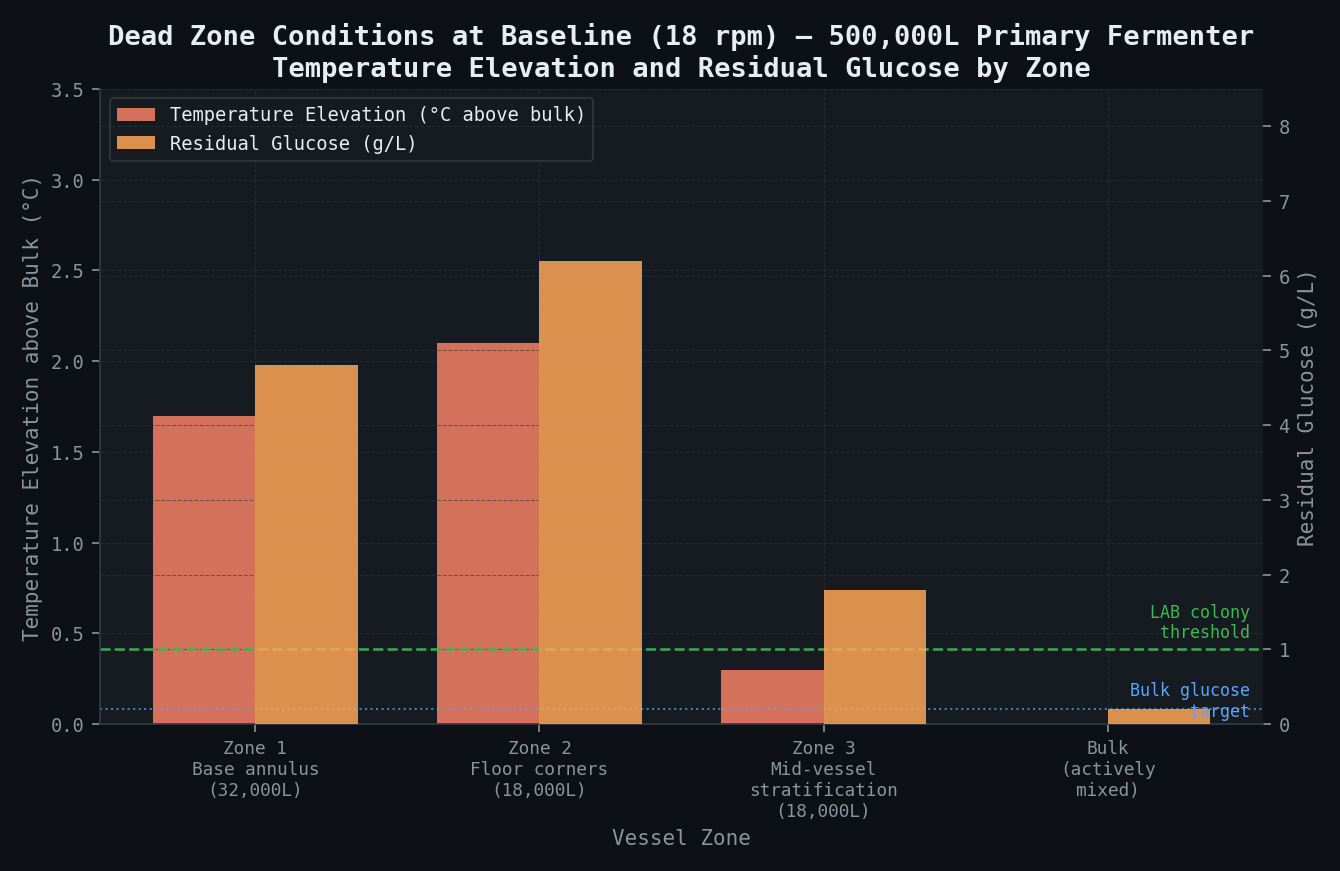
The floor corners (Zone 2) present the highest contamination risk. At 33.5°C (the temperature predicted in Zone 2, elevated above the bulk 31.8°C by the fermentation exotherm with reduced convective cooling), Lactobacillus fermentum — the dominant LAB species in Brazilian sugarcane fermentations — has a doubling time of approximately 22 minutes. With 6.2 g/L residual glucose as a substrate, an initial inoculum of 10² CFU/mL can reach 10⁵ CFU/mL in 8 hours — sufficient to produce significant lactic acid.
kLa and mixing parameters across the parametric study:
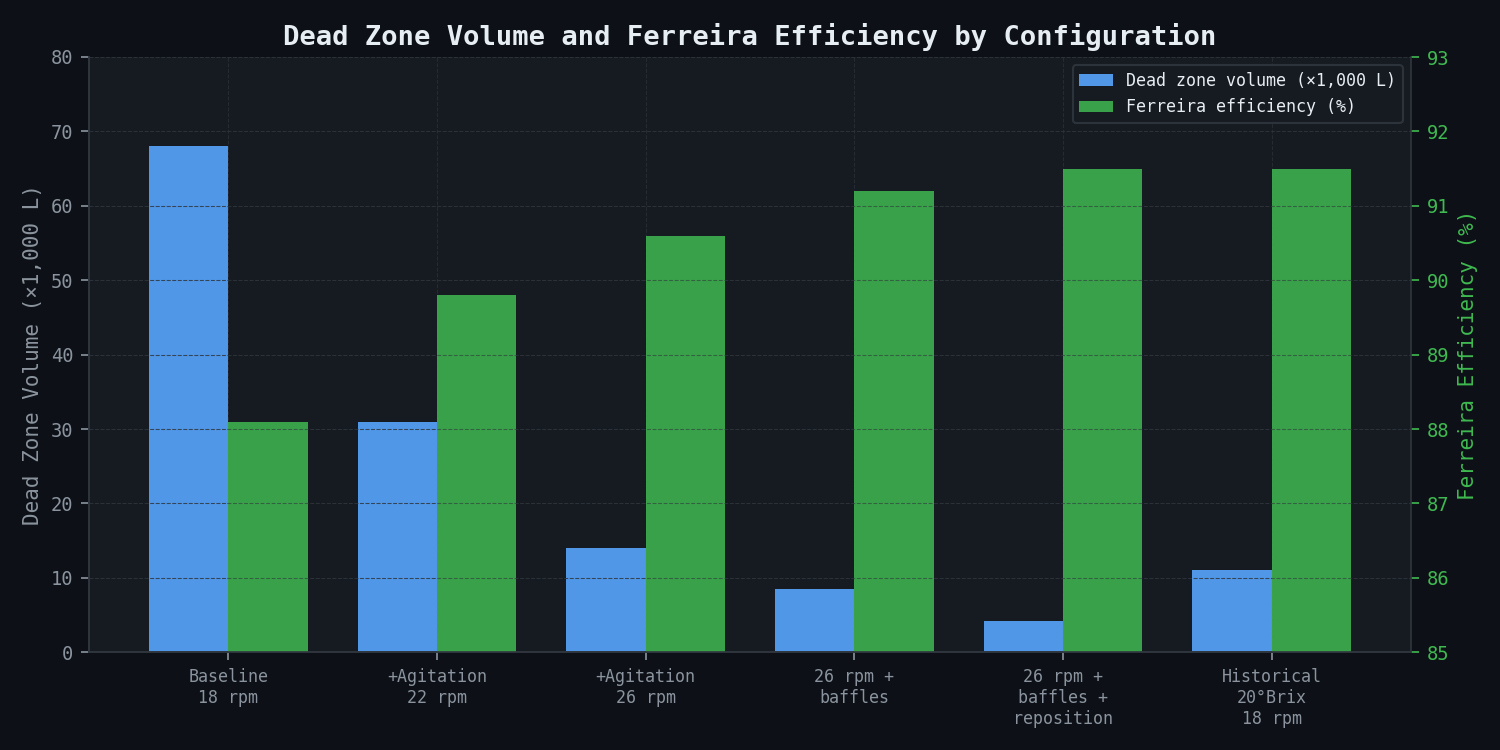
| Configuration | Agitation (rpm) | CO₂ Flooding? | θ_mix (min) | Dead Zone Vol (L) | Residual Glucose (g/L) | Projected η_F (%) |
|---|---|---|---|---|---|---|
| Baseline | 18 | Yes (peak) | 4.1 | 68,000 (13.6%) | 3.8 | 88.1 |
| +Agitation only | 22 | Borderline | 2.9 | 31,000 (6.2%) | 2.1 | 89.8 |
| +Agitation only | 26 | No | 2.2 | 14,000 (2.8%) | 1.3 | 90.6 |
| 26 rpm + 2 draft baffles | 26 | No | 1.8 | 8,500 (1.7%) | 0.6 | 91.2 |
| 26 rpm + baffles + impeller reposition | 26 | No | 1.4 | 4,200 (0.8%) | 0.4 | 91.5 |
| Historical baseline (20 °Brix) | 18 | No | 2.8 | 11,000 (2.2%) | 0.7 | 91.5 |
Temperature field validation:
| Measurement Point | Measured Temperature (°C) | CFD Predicted Temperature (°C) | Agreement |
|---|---|---|---|
| Bulk (mid-height, 4.9 m) | 31.8 (reference) | 31.8 (set) | — |
| Base probe (0.5 m height) | 32.6–33.2 | 33.5 | +0.3–0.9°C (probe is at 0.5m; deepest stagnation at floor) |
| Mid-vessel (5.5 m, Zone 3) | 31.9–32.1 | 32.0 | Good |
The CFD-predicted base temperature elevation (1.7°C above bulk in Zone 1) is consistent with the measured 0.8–1.4°C elevation at the 0.5 m probe location. The model slightly overpredicts because the probe at 0.5 m is not in the deepest stagnation zone (which the CFD predicts at 0.2 m from the floor, not reachable by the existing probe location).
Revised configuration specification:
The optimal configuration (26 rpm + 2 bottom-sweeping anchor-style draft baffles + impeller repositioned 0.15 m lower) achieves:
- Dead zone volume: 4,200L (0.8% working volume)
- Mixing time: 1.4 minutes (vs. 4.1 minutes baseline)
- Peak Fl_g: 0.049 (vs. 0.069 baseline) — no flooding at any fermentation stage
- Agitation power increase: from 18 rpm (P/V = 12 W/m³) to 26 rpm (P/V = 38 W/m³) — a 3.2× increase in agitation power, which is the dominant implementation cost
- Residual glucose: 0.4 g/L (within target <1.0 g/L)
- Projected Ferreira efficiency: 91.5% — full recovery to historical baseline
Acid washing frequency reduction:
With dead zone volume below 1% working volume, the substrate availability for LAB colonisation drops below the threshold for self-sustaining colony formation. This projects to a reduction in required acid washing frequency from daily (365 cycles/year) to twice-weekly (104 cycles/year). Each acid wash cycle costs approximately USD 3,500 in chemicals, process downtime, and yeast attrition. Annual saving: (365 − 104) × USD 3,500 = USD 913,500/year in reduced washing costs alone.
Comparison Methodology
Step 1 — Conductivity tracer experiment: The study recommends a single 500,000L tracer test executed during a scheduled maintenance window. Protocol: dissolve 30 kg NaCl in 100L process water; inject as a pulse at the mash inlet over 60 seconds; record conductivity at 12 positions (3 axial heights × 4 radial/angular positions) at 30-second intervals for 6 hours. The predicted multi-point RTD curves are compared against measured conductivity responses:
- At the bulk mid-height probes: smooth exponential decay with characteristic time ≈ 2.1 hours (theoretical)
- At the base probes: slow, delayed response confirming the dead zone characteristic time of 8–14 minutes
Predicted θ_mix = 4.1 minutes (at 18 rpm) is compared against the measured first-moment of the conductivity response at the base probes. Agreement within ±20% confirms the CFD model before proceeding to the revised configuration recommendation.
Step 2 — Temperature profile comparison: The measured temperature probe data at 0.5 m height (0.8–1.4°C elevated vs. bulk) is compared against CFD-predicted temperature at the same axial location. The CFD predicts 1.5–1.8°C elevation at 0.2–0.4 m (slightly above the probe height), consistent with the measurements. The agreement rationalises the thermal signature as a direct consequence of the stagnant zone (reduced convective heat removal by the cooling coil, which is positioned 0.5–3.0 m above the vessel floor and provides no cooling to the dead zone at the base).
Step 3 — Historical yield correlation: The Ferreira efficiency drop from 91.5% to 88.1% is rationalised by the flooding onset analysis. The flooding transition at 18 rpm occurs at a CO₂ evolution rate corresponding to approximately 22 °Brix fermentation (Fl_g ≈ 0.10). Historical records confirm the facility was operating at 20–21 °Brix before the process change without efficiency problems — consistent with the model, which predicts Fl_g = 0.08 at 21 °Brix, below the flooding threshold.
Step 4 — LAB correlation: The measured lactic acid concentration in the beer (0.8–1.4 g/L) is cross-checked against the LAB kinetic growth prediction in the dead zones. At 10⁵ CFU/mL LAB in a 68,000L dead zone and a specific lactic acid production rate of 2 g lactate/g CDW/hr, the predicted lactic acid flux into the bulk is 0.6–1.2 g/L per residence time — consistent with the measured range.
Deliverables
CFD and flow analysis outputs:
- Full 3D velocity vector field and streamline visualisation at three fermentation stages (early/peak/late), rendered as 2D cross-sections through the vessel axis and as 3D streamline traces starting from the impeller
- RTD curves: predicted and post-validation measured, presented on matched axes with dead zone volume quantification annotated
- Stagnation zone iso-surface maps (MRT > 3× mean) in three dimensions, overlaid on the vessel geometry cross-section with volumetric scale bar
- CO₂ flooding transition curve: Fl_g vs. agitation speed for the full fermentation cycle (sugar conversion 0–100%), with flooding threshold overlaid
- Gas hold-up field at peak CO₂ evolution rate: volume fraction map showing the gas pocket around the impeller during the flooded condition
Thermal analysis:
- Temperature field maps at peak fermentation heat generation (50% sugar conversion) — steady-state, including cooling coil effectiveness
- Temperature difference maps (T_local − T_bulk) highlighting the stagnant thermal zones
- Dead zone heat accumulation analysis: effective cooling rate vs. bulk at each stagnant zone location
Revised configuration specification:
- Agitation specification: impeller speed increased to 26 rpm; motor power requirement at new operating point; shaft stress analysis confirming existing shaft can handle increased torque
- Baffle specification: two bottom-sweeping anchor baffles (3 mm plate, 316SS, 300 mm × 800 mm, positioned at 45° from existing wall internals); installation coordinates and weld specification
- Impeller repositioning: lower PBT from 4.0 m centreline height to 3.85 m — within existing shaft adjustment range
- Implementation sequence: all three modifications can be executed during a single 5-day scheduled maintenance shutdown
Process economics and contamination risk:
- Ferreira efficiency vs. dead zone volume parametric relationship (applicable to other vessels in the fleet)
- LAB contamination risk assessment as a function of dead zone volume and residual glucose — with threshold below which LAB colony formation becomes self-limiting
- Acid washing frequency recommendation and annual cost-saving calculation (per vessel and fleet total)
- Power consumption increase analysis: 18→26 rpm power increase per vessel, annual electricity cost impact at Brazilian industrial tariff (USD 0.08/kWh)
Implementation plan:
- Vessel modification sequence during scheduled harvest-season maintenance shutdown
- Pre-modification checklist and post-modification verification protocol (tracer test + 5-batch yield monitoring)
- Scale-out plan: application of the modified impeller speed setpoint and baffle addition to all six vessels in the fleet (including the 250,000L secondaries, which may benefit from similar analysis)
This case study is an illustrative reference scenario demonstrating newtsim's simulation methodology. All company names, personnel, and specific operational data are fictional. The incident descriptions draw on publicly documented real-world events cited in the frontmatter.