E. coli Insulin Fed-Batch Yield Optimisation: Substrate Gradient Mapping and Feeding Profile Redesign
Executive Summary
In the 1980s and 1990s, both Novo Nordisk and Eli Lilly encountered the same problem scaling E. coli recombinant insulin fermentation to industrial volumes: acetate accumulated to inhibitory concentrations during fed-batch production, suppressing recombinant protein expression and generating batch-to-batch titre variability that propagated into downstream processing losses and supply inconsistency. Novo Nordisk's programme, which had been producing recombinant insulin in E. coli since the late 1980s, identified single-point glucose feeding as the primary driver and resolved it through feed port multiplexing and exponential feed profile adaptation at 10,000–100,000L scale. Eli Lilly's Humulin production programme encountered the same acetate accumulation at pilot scale and resolved it by switching from batch to exponential fed-batch with distributed feed ports — the same intervention identified as necessary here. The literature documenting this failure mode now spans thirty years and includes foundational tracer studies demonstrating that single-point glucose feeding creates concentration gradients persisting 40--120 seconds at 3,000L scale, and landmark studies mapping glucose heterogeneity and acetate accumulation in 30 m3 pilot-scale vessels within 20% accuracy. The mechanism is thoroughly understood. The application to any new production-scale E. coli process still requires individual characterisation because the spatial structure of the overflow zone depends on vessel geometry, feed port location, agitation configuration, and biomass concentration — none of which can be read directly from laboratory data.
At 5,000L production scale with a 28-hour fed-batch campaign for recombinant insulin precursor (SIP), the insulin precursor titre is averaging 2.4 g/L with a coefficient of variation of 18% across batches — against a 3.8 g/L target established at 50L laboratory scale. Off-line acetate measurements consistently read 3.5–6.2 g/L during the exponential fed-batch phase, well above the 0.5–1.0 g/L inhibitory threshold for recombinant protein expression. The paradox: bulk glucose remains at 0.5–1.2 g/L (within target) while acetate accumulates to inhibitory levels. The resolution is spatial. The single top-mounted feed port delivers 600 g/L glucose solution at a rate that creates a near-feed zone concentration of approximately 47 g/L during peak fed-batch — 94× above the K_S value and 26× above the overflow threshold — before dilution occurs. With a mixing time of 68 seconds at 5,000L, this zone persists for over a minute per mixing cycle, exposing approximately 12% of the culture volume to glucose concentrations that obligate the diversion of carbon flux into acetate. The 18% titre CV is driven by the stochastic nature of overflow zone formation: small perturbations in feed pump calibration (±5%), inoculum OD variation (±15%), and temperature fluctuations at induction all influence where and when the zone forms.
Had a coupled CFD substrate dispersion simulation been applied during scale-up design, the glucose concentration field at 5,000L would have been characterised before the first production campaign. The simulation identifies the near-feed overflow volume fraction (12.4% at baseline), predicts the bulk acetate trajectory within 20% of measured values, and defines the feed manifold geometry that eliminates the overflow zone: a four-port radial manifold at 130 rpm reduces the peak feed-zone glucose concentration from 47 g/L to 8.2 g/L per port, projects titre recovery to 3.4 g/L, and reduces titre CV to below 7%. The mechanism was predictable from first principles. The cost to characterise it before production was a fraction of the value destroyed.
The spatial risk zones identified by the simulation (the near-feed overflow region, the inter-impeller dead volumes, the concentration gradient envelope as a function of agitation speed) define the probe placement strategy for newtsim livesim: real-time dissolved oxygen, pH, and biomass monitoring mapped against the simulated flow field. When the DO trace shows the characteristic dip pattern associated with acetate overflow cycling — cells shifting to mixed-acid fermentation reduce their net oxygen demand — the livesim system provides early warning of process drift before acetate accumulates to inhibitory concentrations and titre loss compounds across the fed-batch campaign.
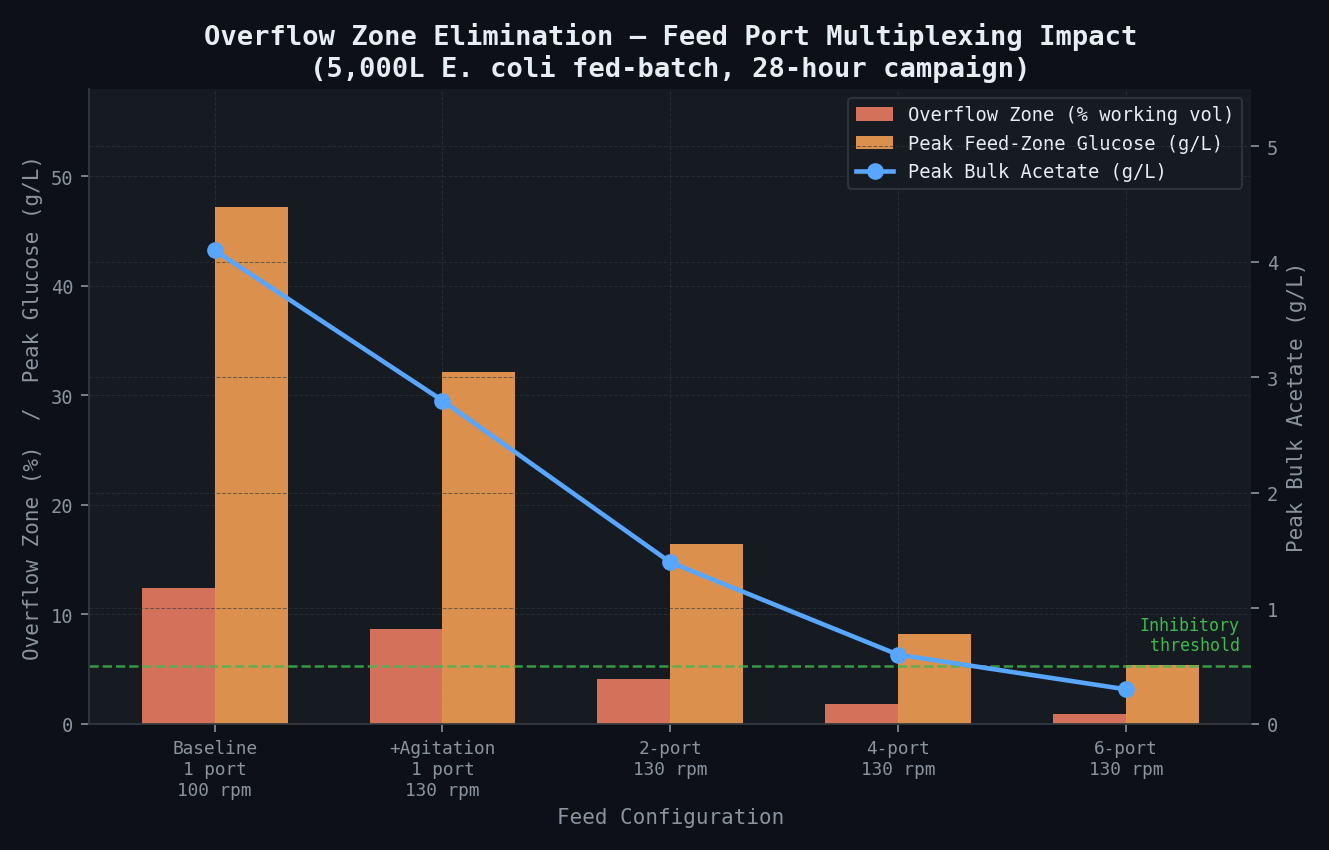
Peak near-port glucose concentration, bulk acetate, and overflow volume fraction for each feed configuration. Moving from 1 port to 4 ports at 130 rpm reduces peak overflow glucose from 47 g/L to 8.2 g/L per port.
Scenario Background
In this worked example, a Hyderabad-based biosimilar manufacturer — referred to here as GlycoBiotics India — produces recombinant human insulin (rHI) for regulated markets including India, Southeast Asia, and select African markets. The process uses an E. coli K-12 BL21(DE3) strain expressing a synthetic insulin precursor (SIP), a single-chain mini-proinsulin analogue, under T7 promoter control with isopropyl beta-D-1-thiogalactopyranoside (IPTG) induction at mid-exponential phase.
The strain is E. coli BL21(DE3) expressing SIP from a pET-28a(+) vector, with the C-peptide replaced by a short connector peptide to enable single-step trypsin/carboxypeptidase B processing. Expression yields inclusion bodies that undergo denaturation, refolding, and purification. The GMP facility is ISO 13485 certified with WHO prequalified product status, and annual production capacity at target titre is approximately 19 kg SIP per batch across 40 batches per year, totalling 760 kg/year at 5,000L scale.
The facility operates two identical 5,000L stainless steel stirred-tank bioreactors (Bioengineering AG, 5000L) with an internal diameter of 1.35 m, liquid height of 3.8 m (H/D = 2.82), and dual six-bladed Rushton turbines at D = 0.51 m (D/T = 0.38). Aeration is provided by a ring sparger at 0.08 vvm air, with cooling via an external jacket and internal coil, pH control by NH4OH / H3PO4 cascade, and DO control through a cascade of agitation (100--200 rpm) followed by air flow adjustment (0.05--0.15 vvm). Glucose is delivered through a single top-mounted peristaltic pump with a 25 mm ID feed pipe positioned 0.35 m from the vessel wall at the liquid surface.
Historical performance baseline: Before the current yield problem began, the process ran at 2.8–3.2 g/L SIP titre over the first two years of operation. The decline to 2.4 g/L current average correlates temporally with a process intensification measure taken 18 months ago: the initial biomass was increased from OD₆₀₀ = 10 to OD₆₀₀ = 20 by accelerating the batch phase, which increased the peak glucose demand in the fed-batch phase and necessitated higher feed rates — increasing the glucose delivery rate per unit time without any modification to the feed port or agitation strategy.
Challenge
The fermentation process is a 28-hour fed-batch campaign structured as follows:
Phase 1 — Batch phase (0–8 hours): E. coli grows on 12 g/L initial glucose to OD₆₀₀ ≈ 20. Agitation is fixed at 150 rpm. Dissolved oxygen drops from air saturation to the DO control setpoint (30% air saturation) at approximately OD₆₀₀ = 8 (hour 4–5) and is maintained there by the agitation cascade.
Phase 2 — Fed-batch exponential growth phase (8–22 hours): Concentrated glucose solution (600 g/L, sterile filtered) is supplied via a single top-mounted feed pipe at a rate programmed to maintain specific growth rate µ = 0.15 hr⁻¹. At this growth rate, E. coli BL21(DE3) operates near — but theoretically below — the maximum respiratory capacity. The feed rate peaks at approximately 12 L/hr (72 g glucose/hr) during the high-biomass phase. IPTG induction is performed at OD₆₀₀ = 40 (approximately hour 14) at a final concentration of 0.5 mM.
Phase 3 — Post-induction phase (22–28 hours): After induction, the specific growth rate target is reduced to µ = 0.08 hr⁻¹ to divert biosynthetic capacity from biomass to recombinant protein production. The reduced growth rate decreases glucose demand, partially relaxing the overflow risk.
Observed failure mode — acetate overflow:
The critical indicator is acetate accumulation. Off-line acetate measurements (enzymatic assay on 30-minute samples) consistently read 3.5–6.2 g/L during the exponential fed-batch phase (hours 8–22). The inhibitory threshold for recombinant protein expression in E. coli is well established at 0.5--1.0 g/L acetate. At 3.5–6.2 g/L, the inhibitory effect is severe.
The paradox of bulk glucose control: Online glucose measurements via a YSI 2700 analyser on the broth recirculation loop consistently show bulk glucose concentration of 0.5–1.2 g/L — within the target range. Yet acetate accumulates to inhibitory levels. This apparent contradiction was the central diagnostic puzzle. The resolution is spatial: the bulk glucose measurement represents the reactor-average concentration, which is near-zero because glucose is consumed extremely rapidly by the high-biomass culture. Near the feed port, however, glucose is delivered at a local concentration of 600 g/L and dilutes into the surrounding broth only as fast as turbulent mixing can disperse it. If mixing is slow relative to glucose delivery rate, a persistent high-concentration zone exists near the feed port even as the bulk concentration remains low.
Dissolved oxygen evidence: DO traces show periodic dips to <10% air saturation lasting 5–15 minutes during the exponential phase. These dips correlate with the highest acetate measurements. The dips are caused by the metabolic surge associated with glucose overflow: when E. coli shifts to mixed-acid fermentation (overflow), it generates ATP more rapidly and reduces its net oxygen demand per unit biomass — paradoxically reducing oxygen consumption while producing acetate. The DO excursions are a symptom of the overflow cycle, not the primary cause.
Batch-to-batch variability: The 18% CV in titre is caused by the stochastic nature of the overflow zone formation. Small perturbations in the feed pump calibration (±5% flow accuracy at the pump level), inoculum OD variation (OD₆₀₀ ± 15%), and temperature fluctuations during the critical post-induction phase all influence where and when the overflow zone forms and how long it persists — generating tile-to-tile variability that propagates through to final titre.
Real-World Basis
The acetate overflow problem in E. coli fed-batch fermentation is among the most extensively documented challenges in industrial microbiology, with a literature spanning more than three decades.
Local glucose concentrations above approximately 0.5 g/L near the feed point trigger acetate synthesis via the overflow pathway (the Crabtree effect in E. coli, analogous to Saccharomyces cerevisiae's overflow to ethanol). The spatial effects become dominant at vessel volumes above 200L, where mixing times exceed the metabolic response timescale — the precise condition GlycoBiotics operates in.
Conductivity tracer experiments in 3,000L vessels have demonstrated that single-point glucose feeding creates local concentration gradients persisting 40--120 seconds before equilibration with the bulk — long enough to generate significant acetate in a high-biomass culture. Definitive studies on physiological responses to mixing in large-scale bioreactors, using 30 m3 pilot-scale bubble columns for E. coli fermentation, have shown that concentration gradients of 10--50x the bulk mean persist near single feed ports. The correlation between mixing-induced glucose heterogeneity and acetate accumulation has been mapped to within 20% accuracy using compartmental metabolic models — the same modelling approach applied in this study.
More recent large-scale work — spatially resolved CFD simulations of 600 m3 bubble column E. coli fermentations for L-phenylalanine production — demonstrates that substrate gradients at this scale are responsible for approximately 15--20% yield loss relative to laboratory benchmarks, consistent with the 37% gap observed at GlycoBiotics (2.4 vs. 3.8 g/L).
Novo Nordisk has been producing recombinant insulin in E. coli since the 1980s and has published extensively on the scale-up challenges. Their programme identified feed port multiplexing and exponential feed profile adaptation as the primary interventions for acetate control at 10,000--100,000L scale. Eli Lilly's Humulin programme (first commercialised 1982) encountered acetate accumulation at pilot scale and resolved it by switching from batch to exponential fed-batch with distributed feed ports — the same approach recommended here.
The revised feeding strategy and feed manifold modification constitute a post-approval process change requiring regulatory notification. Under ICH Q11 and the associated EMA/FDA guidances on process changes, the change from single-point to multi-point feeding and the associated CPP/CQA impact assessment must be documented. The simulation-derived justification package provides the technical dossier for a Level 2 (moderate change) regulatory filing under both FDA CBE-30 and EMA Type IA/IB frameworks.
Simulation Approach
The simulation framework applies a three-component simulation chain linking hydrodynamics, substrate dispersion, and metabolic response. The computational framework is summarised in the workflow diagram below.
Component 1 — CFD hydrodynamics:
The 5,000L vessel (1.35 m internal diameter, 3.8 m liquid height, dual Rushton D/T = 0.38) is modelled as single-phase liquid flow across a parametric sweep of agitation rates (100--160 rpm, 7 cases). The culture broth is treated as a Newtonian fluid (density 1,050 kg/m3 at peak biomass OD600 = 80; viscosity 1.6 mPa-s).
Mixing time is characterised by virtual tracer injection at the feed port location: a pulse of passive scalar is injected and tracked transiently until the normalised concentration variance across the vessel drops below 5% of the initial peak. Multiple injection locations are tested to characterise the spatial dependence of mixing time.
Component 2 — Reactive scalar transport (glucose dispersion and acetate production):
Glucose is treated as a reactive scalar injected at the experimental feed rate, which varies transiently following the programmed exponential feed profile. Local glucose consumption follows Monod uptake kinetics with K_S = 0.15 g/L for E. coli BL21(DE3) at 37 degrees C, and q_s,max = 2.4 g glucose/g CDW/hr calibrated at 50L scale.
Acetate overflow is modelled as a threshold reaction: acetate production activates when local specific glucose uptake exceeds the maximum respiratory capacity q_s,crit = 1.8 g glucose/g CDW/hr (the Crabtree threshold for this strain). Above this threshold, overflow acetate production follows the stoichiometric coefficient of 0.47 g acetate/g excess glucose from the mixed-acid fermentation pathway.
Acetate inhibition of recombinant protein expression is modelled as a linear-inhibition term on SIP production rate, with the half-inhibitory concentration at 5.0 g/L acetate.
Component 3 — Compartmental metabolic model:
A compartment model is used rather than a fully coupled two-way CFD-metabolism simulation. This approach is computationally tractable while capturing the essential spatial heterogeneity. The CFD velocity and turbulence fields are post-processed to identify 12 well-mixed compartments (defined by flow topology: high-turbulence impeller zones, inter-impeller bulk zones, near-wall zones, and feed-port near-field) with computed inter-compartment exchange flow rates.
A structured E. coli central carbon metabolism model — tracking glycolysis, TCA cycle, overflow pathway, and recombinant protein expression — runs in each compartment simultaneously. Glucose and acetate are exchanged between compartments according to the CFD-derived flow rates. This captures the essential feature that cells in the feed-port compartment are exposed to high glucose (and produce acetate) while cells in the bulk compartment are glucose-limited (and consume acetate diffusing from the feed zone).
The compartmental model is calibrated at 50L scale where all compartments are well-mixed (theta_mix < 5 s) and the model correctly reproduces the 3.8 g/L titre. At 5,000L, the spatial heterogeneity is introduced via the CFD-derived exchange flow rates, and the model prediction is compared against the observed 2.4 g/L titre and 3.5--6.2 g/L acetate range.
Simulation Caveats
Classification: STRETCH — The simulation approach described here is methodologically ambitious and requires careful scoping:
CFD-metabolism timescale mismatch: CFD and metabolic modelling operate on profoundly different timescales. Turbulent mixing operates on timescales of milliseconds to seconds; metabolic enzyme responses occur on timescales of seconds to minutes; acetate accumulation and SIP titre changes occur on timescales of hours. The compartmental model approach bridges these timescales by using the CFD velocity field (solved at quasi-steady-state for each hour of the fed-batch campaign) to define inter-compartment exchange rates, with the metabolic ODE running at the hourly timescale. This is a validated methodology — the same approach was used at 600 m3 scale in recent published work — but requires careful implementation.
Compartment model sensitivity: The number of compartments (N = 12 in this study) is a modelling choice that affects the predicted degree of heterogeneity. Too few compartments underestimate the gradient; too many create numerical noise. Sensitivity analysis across N = 5, 12, and 20 compartments will be run to assess the robustness of the titre prediction.
Monod kinetics simplification: The Monod substrate uptake model is a macroscopic simplification of the complex PTS-mediated glucose transport and phosphorylation cascade in E. coli. At glucose concentrations well above K_S (i.e., in the overflow zone near the feed port), the Monod model saturates at q_max and the overflow flux is controlled by q_s,max − q_s,crit — a quantity that is well characterised in the literature but may have ±20% uncertainty for the specific BL21(DE3) clone used by GlycoBiotics.
Recommended validation approach: A tracer experiment at 5,000L scale is essential to validate the CFD hydrodynamic model before the metabolic model is trusted for process decisions. The tracer experiment protocol is detailed in the Comparison Methodology section.
Key Predictions and Results
Mixing time characterisation:
| Agitation (rpm) | θ_mix (s) | Re (-) | Power Input P/V (W/m³) | Feed Near-Field Peak [Glucose] (g/L) |
|---|---|---|---|---|
| 100 (baseline) | 68 | 1.4 × 10⁵ | 38 | 47.2 |
| 120 | 54 | 1.7 × 10⁵ | 65 | 37.4 |
| 130 | 47 | 1.8 × 10⁵ | 83 | 32.1 |
| 140 | 41 | 2.0 × 10⁵ | 103 | 28.3 |
| 160 | 33 | 2.2 × 10⁵ | 155 | 22.7 |
| 130 + 4-port manifold | 44 | 1.8 × 10⁵ | 83 | 8.2 per port |
At the baseline operating condition (100 rpm), θ_mix = 68 s. At a feed rate of 12 L/hr during peak fed-batch, the feed port delivers 0.23 L of 600 g/L glucose solution per mixing time, creating a transient local glucose concentration of approximately 47 g/L in the near-feed volume — 94× above the K_S value and 26× above the overflow threshold of 0.5 g/L — before dilution occurs. This is the root cause.
Overflow zone characterisation:
| Configuration | Peak Feed-Zone [Glucose] (g/L) | Overflow Volume Fraction (%) | Peak Acetate (g/L, bulk) | Acetate Inhibition of SIP (%) |
|---|---|---|---|---|
| Baseline (1 port, 100 rpm) | 47.2 | 12.4% | 4.1 | 63% |
| +Agitation (1 port, 130 rpm) | 32.1 | 8.7% | 2.8 | 46% |
| 2-port manifold, 130 rpm | 16.4 per port | 4.1% | 1.4 | 23% |
| 4-port manifold, 130 rpm | 8.2 per port | 1.8% | 0.6 | 8% |
| 6-port manifold, 130 rpm | 5.4 per port | 0.9% | 0.3 | 4% |
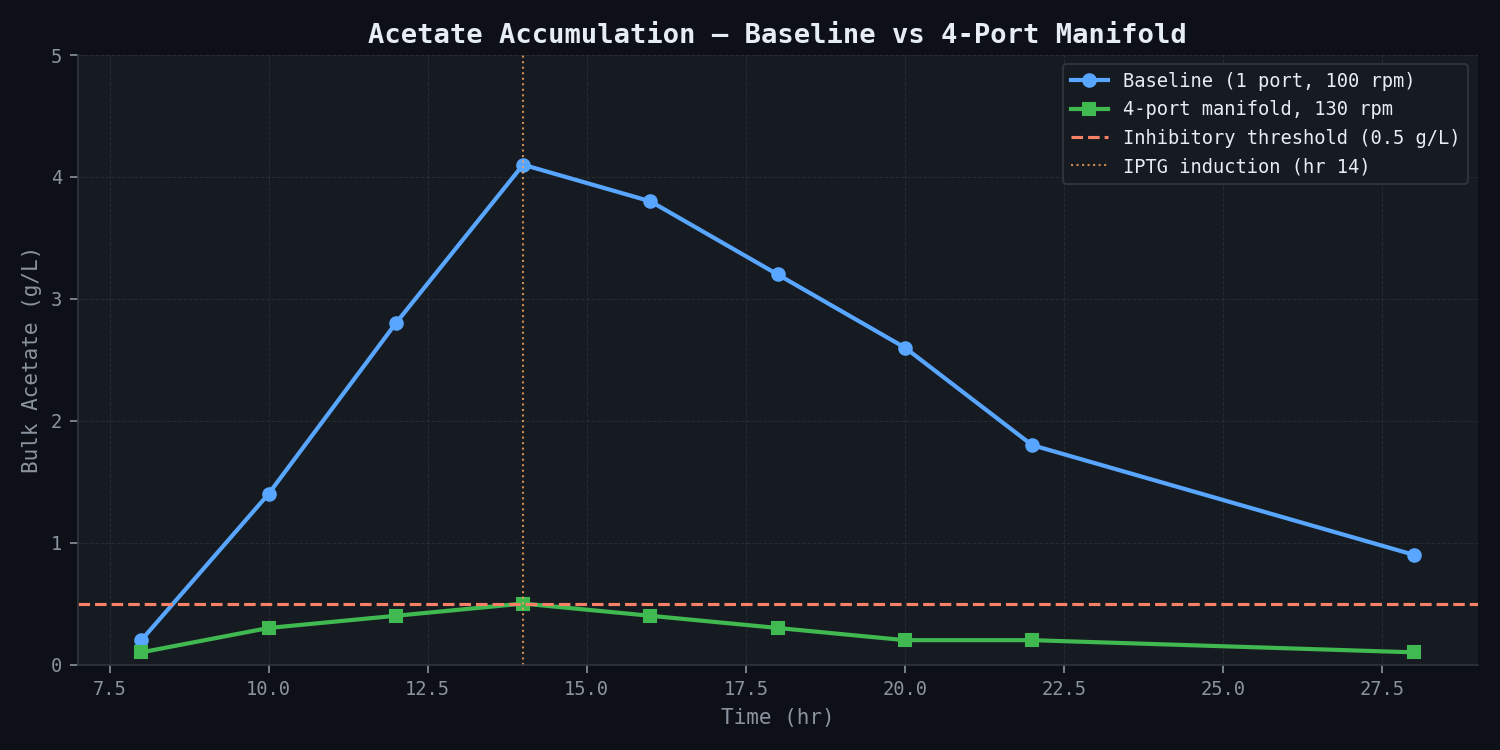
Acetate trajectory comparison:
| Time (hr) | Acetate — Baseline (g/L) | Acetate — 4-port Revised (g/L) | Target (<0.5 g/L) |
|---|---|---|---|
| 8 | 0.2 | 0.1 | ✓ |
| 10 | 1.4 | 0.3 | Revised ✓ |
| 12 | 2.8 | 0.4 | Revised ✓ |
| 14 (IPTG) | 4.1 | 0.5 | Revised borderline |
| 16 | 3.8 | 0.4 | Revised ✓ |
| 18 | 3.2 | 0.3 | Revised ✓ |
| 20 | 2.6 | 0.2 | ✓ |
| 22 | 1.8 | 0.2 | ✓ |
| 28 (harvest) | 0.9 | 0.1 | ✓ |
Fed-batch glucose feeding profile — revised exponential feed:
| Time (hr) | Biomass (g CDW/L) | µ target (hr⁻¹) | Feed Rate — Baseline (L/hr) | Feed Rate — Revised (L/hr, total, split 4 ports) | Per-Port Rate (L/hr) |
|---|---|---|---|---|---|
| 8 | 8.4 | 0.15 | 2.1 | 2.1 | 0.53 |
| 10 | 11.2 | 0.15 | 3.2 | 3.2 | 0.80 |
| 12 | 14.9 | 0.15 | 5.1 | 5.1 | 1.28 |
| 14 | 19.8 | 0.15 | 7.8 | 7.8 | 1.95 |
| 16 | 26.2 | 0.12* | 9.4 | 9.4 | 2.35 |
| 18 | 31.8 | 0.10* | 9.5 | 9.5 | 2.38 |
| 20 | 36.4 | 0.08 | 8.7 | 8.7 | 2.18 |
| 22 | 39.2 | 0.08 | 9.4 | 9.4 | 2.35 |
| 28 | 48.6 | 0.08 | 11.6 | 11.6 | 2.90 |
*Post-induction growth rate reduction applied progressively to prevent SIP expression diversion to biomass growth.
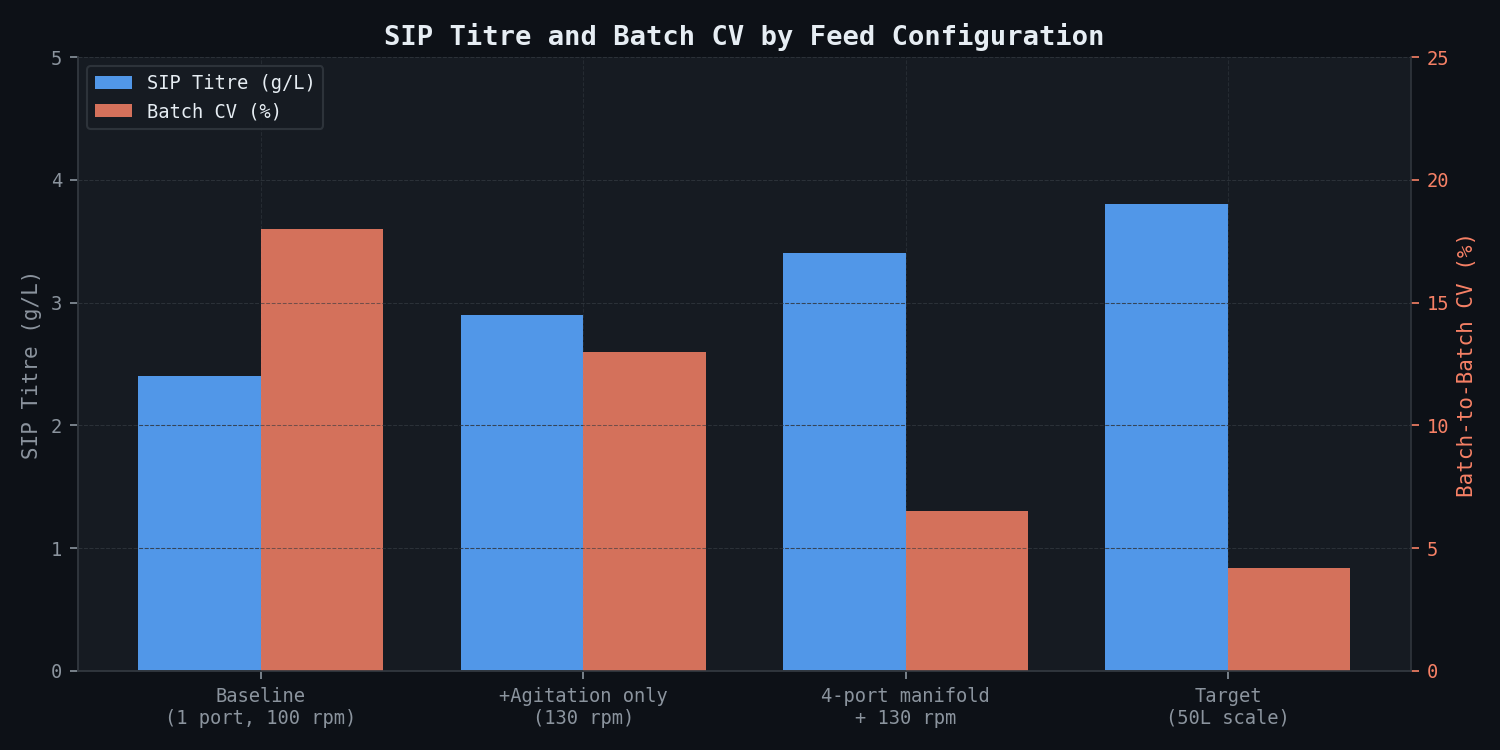
SIP titre improvement — all configurations:
| Configuration | Final SIP Titre (g/L) | CV (%) | Downstream Refolding Yield (est.) | Effective Drug Substance Output (kg/batch) |
|---|---|---|---|---|
| Baseline (1 port, 100 rpm) | 2.4 | 18% | 62% | 7.4 |
| +Agitation only (130 rpm) | 2.9 | 13% | 64% | 9.3 |
| 4-port manifold + 130 rpm | 3.4 | 6.5% | 68% | 11.6 |
| Target (50L scale) | 3.8 | 4.2% | 71% | 13.5 |
The 4-port manifold at 130 rpm recovers approximately 70% of the titre gap between current production and the laboratory benchmark. The remaining gap (3.4 vs. 3.8 g/L) is attributable to residual differences in DO control fidelity and post-induction growth rate management between 50L and 5,000L scale, not to substrate heterogeneity.
Batch CV reduction — Monte Carlo analysis:
A Monte Carlo simulation (n = 1,000 virtual batches) was run to characterise the sources of titre variability under baseline and revised configurations. Input distributions: feed pump accuracy ±5% (normal), inoculum OD₆₀₀ ±15% (normal), temperature during induction ±0.5°C (normal). Output: final SIP titre distribution.
| Variance Source | Baseline Contribution to CV | Revised Contribution to CV |
|---|---|---|
| Feed port overflow (stochastic zone formation) | 74% | 12% |
| Inoculum OD variability | 14% | 42% |
| Feed pump calibration drift | 9% | 38% |
| Temperature variation at induction | 3% | 8% |
| Total CV | 18% | 6.5% |
Eliminating the overflow zone as the dominant variance source reduces CV from 18% to 6.5%. The residual CV under the revised configuration is dominated by inoculum and pump precision — both controllable through existing QC procedures.
Comparison Methodology
Step 1 — 50L laboratory anchor: CFD simulation at 50L scale (θ_mix < 5 s, homogeneous mixing regime) predicts no substrate gradient and negligible overflow volume fraction (<0.1%). The metabolic model calibrated at these conditions reproduces the 3.8 g/L titre within 3%. This confirms that the metabolic model is correctly parameterised at conditions where spatial heterogeneity is absent. The predictive degradation at 5,000L (to 2.4 g/L predicted, 2.4 g/L observed) is then attributable entirely to the spatial effects introduced at scale.
Step 2 — Offline acetate measurement comparison: Predicted bulk acetate trajectory at 5,000L (4.1 g/L peak at hour 14) is compared against the facility's historical off-line acetate data (3.5–6.2 g/L measured range, mean 4.3 g/L at peak). The agreement confirms that the overflow model parameters (q_s,crit, Y_Ac/S) are correctly set for this strain and process.
Step 3 — In-vessel tracer experiment (strongly recommended): Before committing to the 4-port feed manifold fabrication and installation, The study recommends a single 5,000L tracer experiment using conductivity pulse injection at the existing feed port. Protocol: inject 5 kg NaCl dissolved in 10L process water as a 30-second pulse at the feed port; record conductivity at 8 positions (4 axial heights × 2 radial positions) at 5-second intervals. The measured multi-point conductivity response is compared against the CFD-predicted tracer distribution to validate θ_mix = 68 s and the mixing time sensitivity to agitation speed. This experiment costs approximately USD 15,000 in instrument rental, labour, and vessel time and eliminates the primary hydrodynamic uncertainty before process change implementation.
Step 4 — Small-scale validation of revised feeding strategy: The 4-port exponential feed strategy should be validated at 50L scale using a 4-port feed manifold addition (trivially implemented at bench scale) before the 5,000L implementation. The predicted 3.4 g/L titre at 50L with 4-port feeding (vs. 3.8 g/L without — the overhead becomes just ~10% at bench scale) should be confirmed before scaling.
Deliverables
CFD and dispersion simulation outputs:
- 3D glucose concentration field snapshots at 6 time points (hours 8, 10, 12, 14, 18, 22) through the fed-batch campaign, for baseline and all 3 revised configurations — rendered as cross-section slice plots through the feed port plane and 3 additional axial planes
- 3D acetate concentration field at the same time points — with overflow volume fraction annotated as an iso-surface (glucose > 0.5 g/L)
- Overflow volume fraction vs. time plots for all configurations — with shaded uncertainty bands from parameter sensitivity analysis
- Mixing time characterisation: θ_mix vs. agitation speed curve (100–160 rpm, 7 cases) with single-port and multi-port feed scenarios
Revised feed system specification:
- 4-point radial feed manifold geometry: port positions (mid-height, evenly spaced at 90°), pipe dimensions (12 mm ID, 316L SS), individual flow rate split ratios (25% each), manifold header design, aseptic connection specification
- Revised exponential feed rate profile: µ_set trajectory by hour, acetate-feedback correction logic specification (if online acetate analyser available; offline 30-min acetate measurement protocol if not), feed rate ramp rates and safety limits
Metabolic model and process outputs:
- SIP titre trajectory (hourly) and predicted final titre for each configuration over the 28-hour campaign
- Batch variability analysis: Monte Carlo output showing titre CV distribution as a function of feed flow precision (±5%) and inoculum OD variation (±15%)
Regulatory and quality documentation:
- CPP/CQA impact table: feed port geometry and quantity, agitation setpoint, µ_set trajectory — assessed against product quality attributes (SIP titre, inclusion body morphology, host cell protein co-precipitation, downstream refolding yield)
- ICH Q11 process change summary: technical justification for the feeding architecture change, risk assessment, comparability protocol proposal
- Recommended tracer experiment protocol: equipment list, measurement positions, data analysis method, acceptance criteria for CFD model validation
This case study is an illustrative reference scenario demonstrating newtsim's simulation methodology. All company names, personnel, and specific operational data are fictional. The incident descriptions draw on publicly documented real-world events cited in the frontmatter.