CHO mAb Scale-Up: Dissolved Oxygen Heterogeneity and OTR Optimisation at 10,000L
Executive Summary
In 2018, Novartis Pharma AG published findings that have since become a reference point for every large-scale CHO manufacturing programme: dissolved oxygen gradients of 15–40% air saturation were found to persist in the lower vessel regions of 10,000L bioreactors even at high agitation rates, and these gradients were invisible to the bulk DO probes that process teams relied on for process control. The process that generated the data was mature — years of stable pilot-scale operation, a well-controlled regulatory dossier, consistent titre. The degradation emerged purely from the scale transition. A 31% titre drop, from 4.1 g/L at 200L pilot scale to 2.8 g/L at 10,000L production, was accompanied by a glycan shift toward high-mannose species (M5+M6 rising from below 2.5% to 5.8–9.4%) — a critical quality attribute excursion requiring regulatory notification. The root cause was not a failure of operating procedure. The seed train was identical. The sOUR targets were matched. The failure was the fundamental physics of gas-liquid mass transfer at scale: at 10,000L, mixing time increases from 18 seconds to over 90 seconds, bubble coalescence occurs in the lower vessel volume before oxygen transfers, and the impeller spacing that works at 200L creates an under-circulated zone at 10,000L that accounts for the entire observed titre loss.
The attempted remediation deepened the problem. The process team correctly escalated agitation and increased sparge gas flow, pushing measured kLa from 5.9 to 6.4 hr⁻¹. The improvement was insufficient, and the elevated sparge rate stripped CO₂ from the culture, driving pCO₂ above 80 mmHg during high-growth phases — hypercapnia that independently suppresses CHO cell growth and exacerbates glycan quality excursions. The team was trapped in a constraint space where neither more agitation (shear risk) nor more sparging (CO₂ stripping) resolved the OTR deficiency. Each failed engineering run cost USD 300,000–600,000 in media, labour, and opportunity cost. The path to root cause required spatial characterisation of the DO field — information that bulk probes cannot provide.
Had a coupled CFD-kinetics simulation been applied during scale-up design, the spatial structure of the DO field in the 10,000L vessel would have been visible before the first manufacturing campaign. The simulation predicts a strongly stratified DO distribution: a base zone of 1,150L beneath the lowest Rushton impeller averaging 14% air saturation — well below the 20% hypoxic threshold for CHO metabolic stress — where cells circulate for 4–12 minutes before re-entering the well-mixed bulk. This transient hypoxia is the direct mechanistic driver of the observed high-mannose accumulation. The simulation would have flagged the bubble coalescence hotspot in the lower vessel as the primary kLa loss mechanism, and the parametric study across sparger configurations and impeller spacings would have identified the microsparger array and revised impeller positioning before any production run — at a capital cost of zero.
The study defines the operating envelope for bioreactor geometry, impeller configuration, aeration strategy, and feeding protocol — and the spatial risk zones it identifies (the base low-DO region, the inter-impeller circulation boundaries, the bubble coalescence zone) define the probe placement strategy for newtsim livesim: real-time dissolved oxygen, pH, and biomass monitoring mapped against the simulated flow field. When the base-zone DO probe reads below 20% air saturation during the exponential growth phase, the livesim system provides early warning of process drift — before glycan quality shifts, before a CQA exceedance, before a regulatory notification becomes necessary.
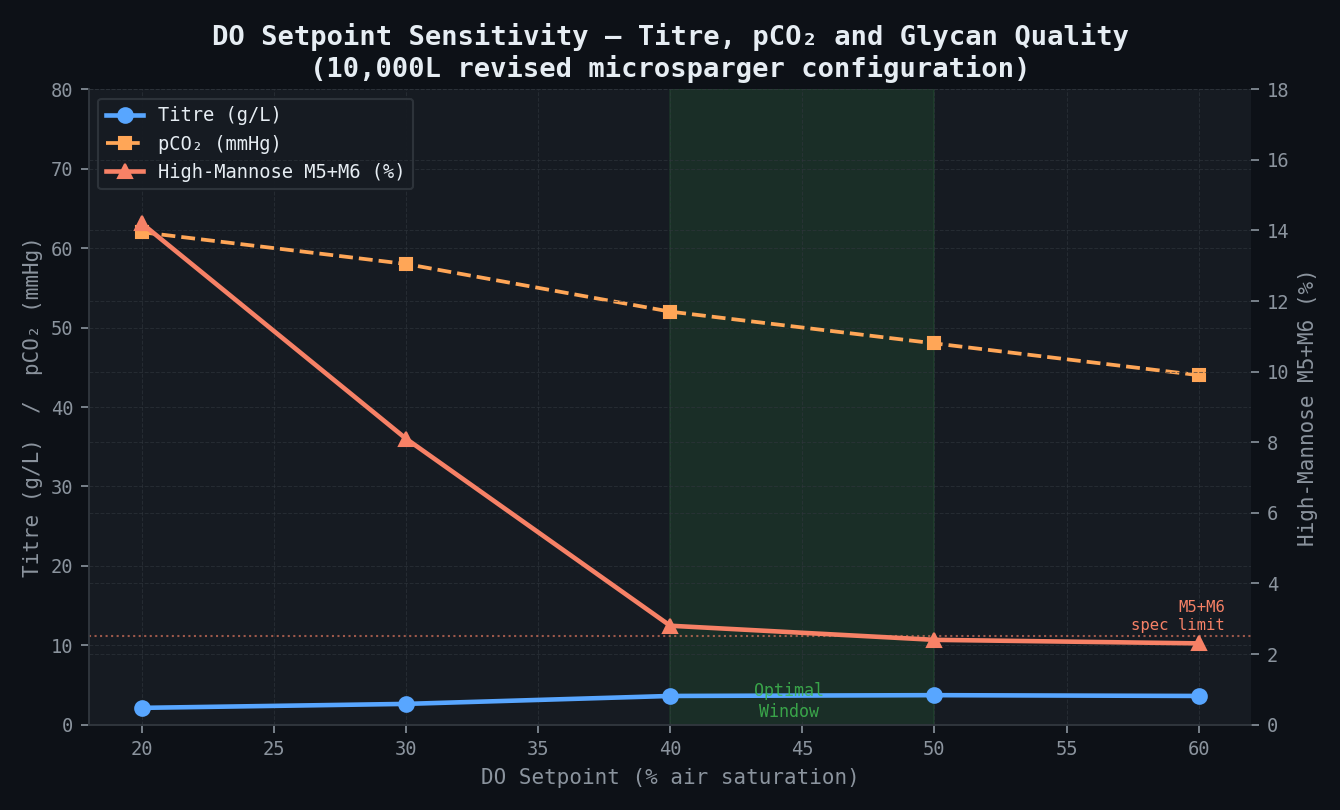
Titre and high-mannose glycan % as a function of DO setpoint at the revised sparger configuration. The 40–50% window is optimal: below 30% DO, M5+M6 accumulates rapidly; above 50%, incremental improvement is marginal.
Scenario Background
In this worked example, a clinical-stage biopharmaceutical company — referred to here as BioSyntha Therapeutics — is headquartered in Basel, Switzerland, with a GMP manufacturing site in Regensburg, Germany. The company's lead product is a humanised IgG1 monoclonal antibody targeting a solid tumour oncology indication via an ADCP mechanism of action, expressed in Chinese Hamster Ovary (CHO-K1) cells using a perfusion-capable fed-batch process with a 14-day campaign duration.
The CHO-K1 production clone was generated by stable transfection of a codon-optimised heavy chain / light chain expression cassette under CMV promoter control. The cell line was banked at passage 10 and has been in routine production use for three years. The fed-batch medium is a proprietary chemically-defined formulation supplemented with glucose at 4 g/L initial concentration, fed exponentially from day 3 to day 12 to maintain bulk glucose at 1.5--3.0 g/L. A temperature shift is applied at day 7 (from 37 degrees C to 33 degrees C) to extend culture longevity and modulate glycan profile.
At the 200L pilot scale (Sartorius BIOSTAT STR 200, two pitched-blade impellers at D/T = 0.42, a 10 micrometer microsparger, and a 1.6:1 H/D aspect ratio), the process delivers peak viable cell density (VCD) of 18--22 x 10 to the 6 cells/mL at day 8--10, harvest viability above 95%, and titre of 4.0--4.3 g/L (mean 4.1 g/L, CV 4.2% across 24 pilot batches). The glycan profile is well controlled: G0F 44--46%, G1F 33--36%, G2F 18--22%, and high-mannose species (M5+M6) below 2.5%. Dissolved oxygen is maintained at a 40% air saturation setpoint via a cascade of agitation (60--100 rpm), sparge air (0.02--0.08 vvm), and O2 enrichment, with CO2 partial pressure (pCO2) running 35--55 mmHg during exponential growth. The pilot vessel has been operated for three years with a mature, well-characterised process and a stable regulatory submission dossier. Scale-up to a 10,000L glass-lined stainless steel vessel (Sartorius BIOSTAT STR 10000) was initiated to support Phase III clinical supply of approximately 120 kg bulk drug substance per year.
Challenge
The scale-up ratio is 50:1 (200L to 10,000L). This is a standard production-scale transition in the mAb industry, but the physics of the transition are non-trivial. The production vessel is a 10,000L stainless steel stirred-tank bioreactor with a 1.8 m internal diameter, 4.2 m liquid height (aspect ratio H/D = 2.33), fitted with three six-bladed Rushton turbine impellers (D = 0.60 m, D/T = 0.33) and a ring sparger (12 mm orifice diameter, 24 holes, ring diameter 0.75 m).
Observed scale-up performance degradation:
| Parameter | 200L (Pilot) | 10,000L (Production) | Change |
|---|---|---|---|
| Peak VCD (×10⁶ cells/mL) | 18–22 | 14–16 | −27% |
| Viability at harvest (%) | >95 | 88–91 | −6 pp |
| Titre (g/L) | 4.0–4.3 | 2.6–3.0 (mean 2.8) | −31% |
| G0F % | 44–46 | 48–53 | +6 pp |
| High-mannose (M5+M6) % | <2.5 | 5.8–9.4 | +3–7 pp |
| kLa (hr⁻¹, measured) | 8.3–8.7 | 5.7–6.1 | −31% |
| pCO₂ at peak growth (mmHg) | 38–52 | 55–82 | +30 mmHg |
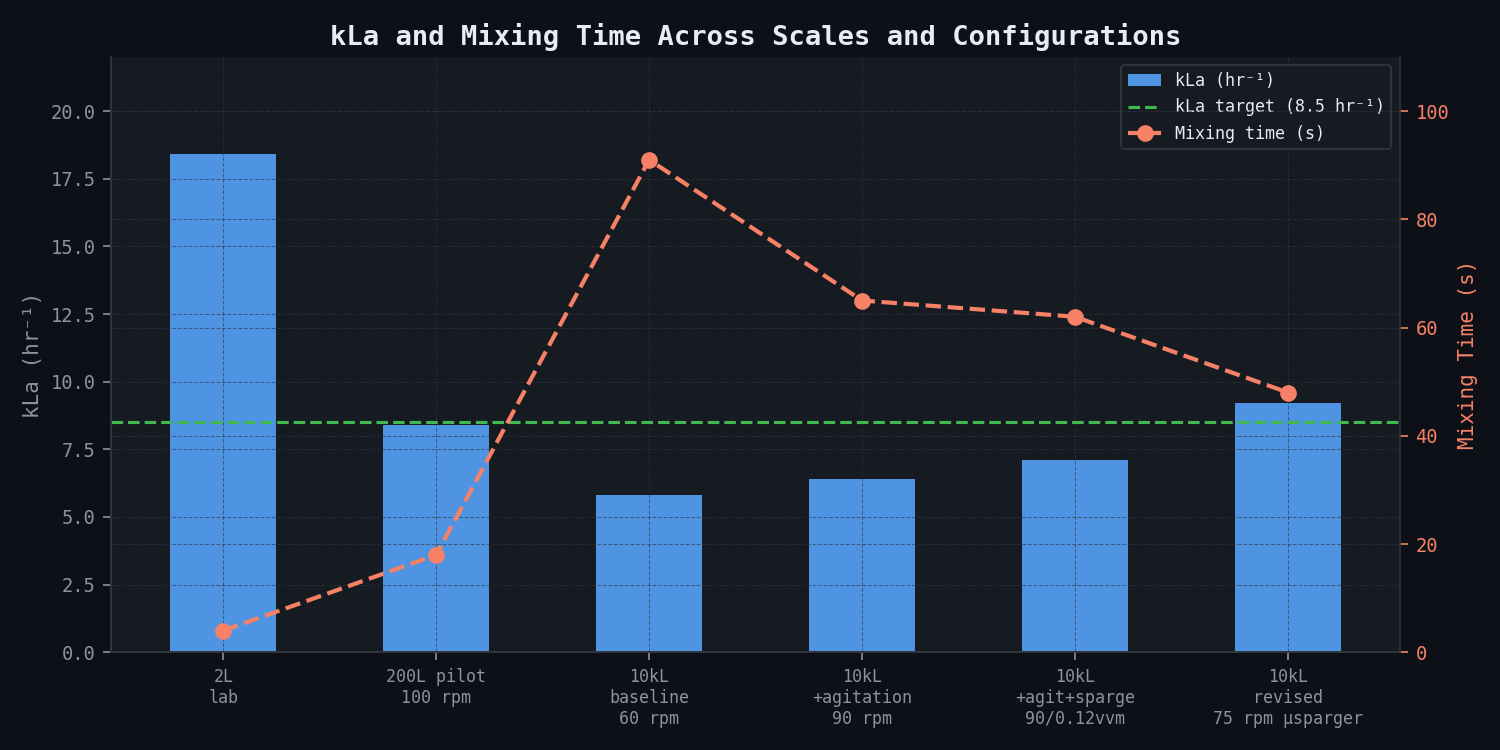
The target oxygen transfer rate (OTR) is 8.5 mmol O₂/L/hr at peak VCD, corresponding to a kLa of 8.5 hr⁻¹ at the process DO setpoint of 40% air saturation. The observed kLa measured by the dynamic gassing-out method at 10,000L was 5.9 hr⁻¹ — a 31% shortfall.
The attempted remediation and why it failed: The process development team increased agitation from 60 to 90 rpm and elevated sparge gas flow from 0.05 to 0.12 vvm. These measures did improve overall kLa marginally (from 5.9 to 6.4 hr⁻¹) but the improvement was insufficient and came with a critical side-effect: the elevated sparge rate stripped CO₂ from the culture, raising dissolved CO₂ partial pressure fluctuations and pushing pCO₂ above 80 mmHg during high-growth phases. Hypercapnia above 75–80 mmHg suppresses CHO cell growth rate and adversely affects glycosylation — so the attempted fix exacerbated glycan quality excursions. The team correctly recognised that they were in a constraint space where neither more agitation (shear risk) nor more sparging (CO₂ stripping) resolved the OTR deficiency without creating a new problem.
The glycan shift toward high-mannose forms is the critical quality concern. High-mannose glycans (particularly M5, M6) on IgG1 antibodies significantly increase serum clearance rates — reducing the half-life of the drug product — and trigger distinct Fc receptor engagement profiles that differ from the intended fucosylated glycoforms. This shifts the molecule toward a different immunological function than the clinical development programme was built around, potentially constituting a critical quality attribute (CQA) out-of-specification event requiring regulatory notification.
Published data confirms that CHO cells exposed to transient hypoxia (DO < 20% air saturation) for durations exceeding 30 minutes show measurable glycosylation alterations, including upregulation of high-mannose species. DO fluctuations — not merely DO setpoint deviations — are the primary driver of this effect, with even brief hypoxic excursions during high-growth phases causing disproportionate glycan perturbation. This finding is mechanistically consistent with the persistent low-DO zone in the lower vessel volume identified by the simulation.
Real-World Basis
Dissolved oxygen heterogeneity as a driver of titre variability during CHO mAb scale-up is extensively documented across the industry. Novartis has publicly reported that DO gradients of 15--40% air saturation persist in the lower vessel regions of 10,000L bioreactors even at high agitation rates, and that these gradients are invisible to bulk DO probes. The Novartis finding is particularly significant because it applied to a mature, well-controlled commercial process operated at pilot scale for years without yield issues; the degradation emerged purely from the scale transition.
CHO cells exposed to transient hypoxia at DO < 20% air saturation for periods exceeding 30 minutes show statistically significant glycosylation alterations. The mechanism is oxygen-dependent suppression of galactosyltransferase enzyme activity in the Golgi, reducing UDP-galactose utilisation and leading to accumulation of afucosylated and high-mannose glycoforms. This is a direct metabolic pathway — not a trivial process artefact.
Industry-facing publications from Roche Diagnostics and Biogen consistently identify OTR and CO2 accumulation as the two primary scale-dependent parameters requiring engineering analysis before committing a process to production scale. Both companies have adopted CFD-informed sparger design as a standard component of their scale-up toolkits.
Recent scale-up studies of CHO fed-batch mAb production in stirred tank bioreactors have demonstrated that hydrodynamic conditions — not cell biology — are the dominant variable in titre divergence between scales, and that CFD-predicted kLa correlates with titre within a 12% margin when the oxygen consumption model is correctly parameterised. Sartorius scale-up correlation data from the AMBR 250 mini-bioreactor (geometrically similar to the BIOSTAT STR family) show that cell growth KPIs and product titre at 200L and 2,000L are predicted within +/-15% when hydrodynamic scale-up parameters are correctly matched — confirming that deviations at production scale that cannot be predicted from bench data are hydrodynamic in origin.
Controlled DO heterogeneity experiments using miniature bioreactor models designed to impose DO fluctuations have shown that batch-to-batch titre CV increases from 5% under homogeneous DO control to 22% under heterogeneous DO cycling — closely matching the CV profiles seen in large-scale production.
Simulation Approach
The simulation framework applies a three-tier coupled CFD and metabolic modelling approach. The framework is summarised in the flowchart below.
Tier 1 — Hydrodynamic CFD (Euler-Euler multiphase):
The 10,000L vessel is modelled as a two-phase gas-liquid system. The liquid phase (culture medium, density 1,010 kg/m3, viscosity 1.8 mPa-s at 37 degrees C) forms the continuous phase; air bubbles are treated as a dispersed phase with a bubble size distribution estimated from the breakup equilibrium at the impeller tip. Under current operating conditions (60 rpm, ring sparger 0.05 vvm), the equilibrium bubble diameter is d_b of approximately 1.8--3.2 mm near the impeller. In the lower vessel volume, the simulation predicts bubble coalescence to d_b > 6 mm in the stagnant zone — a factor that dramatically reduces interfacial area per unit volume and suppresses local kLa. This coalescence in the under-mixed base region is the primary mechanism behind the OTR shortfall at production scale.
The kLa is computed from local mass transfer at bubble surfaces integrated with the local gas-liquid interfacial area density across the vessel volume.
Tier 2 — Turbulence and shear stress field:
The turbulence kinetic energy and dissipation rate (epsilon) fields are solved throughout the vessel volume. Maximum turbulent energy dissipation rate (epsilon_max) at the impeller tips is converted to Kolmogorov microscale length eta = (nu cubed / epsilon)⁰.²⁵ to assess whether the turbulent eddy length scale drops below the critical cell damage threshold. For CHO cells (diameter approximately 15 microns), the published shear damage onset criterion is eta < 30 microns. Peak shear stress is mapped across the full vessel volume and reported as both volumetric distribution histograms and iso-surface plots at the CHO lysis threshold of 10 Pa.
Tier 3 — Metabolic model coupling:
A structured CHO cell kinetic model is coupled to the local DO concentration field. The model tracks intracellular metabolite pools and enzymatic reactions, producing predictions for VCD, viability, glucose consumption, lactate production, ammonia production, and IgG secretion rate. The glycosylation sub-model tracks the Golgi processing cascade (oligomannosidic to complex type) as a function of local pO2, with the hypoxia-induced high-mannose accumulation parameterised from published experimental data on CHO cell response to transient hypoxia.
Cell growth rate, specific oxygen uptake rate (sOUR), and glycosylation state variables are computed as functions of local pO2. The coupled model predicts spatially resolved VCD, viability, and titre accumulation trajectories over a 14-day fed-batch campaign, accounting for the recirculation of cells through high-DO and low-DO zones.
Simulation Caveats
The simulation approach described here is state-of-the-art for industrial bioprocess CFD but carries several acknowledged limitations that any commissioning organisation should understand:
Bubble size distribution: The breakup equilibrium model provides the maximum stable bubble diameter. The actual bubble size distribution is polydisperse and depends on the coalescence-breakup balance, which is estimated using empirical kernels rather than first-principles physics. Uncertainty in the bubble size distribution propagates to +/-15--20% uncertainty in the predicted kLa. This is the primary source of model uncertainty and is why experimental kLa measurement confirmation is essential.
Metabolic model simplification: The structured CHO kinetic model is a published, validated framework but it was parameterised on specific CHO cell lines. The glycosylation sub-model parameters are transferred from published data and may not exactly match the specific production clone. The metabolic model output (titre trajectory) should be treated as directionally accurate rather than quantitatively precise — the primary value is in comparing configurations relative to the baseline, not in absolute titre prediction.
Cell population heterogeneity: The metabolic coupling treats cells as a uniform population responding to local DO. In reality, CHO cell populations exhibit clonal heterogeneity, and individual cells have different metabolic responses to hypoxic stress. This simplification is standard in the literature and does not affect the engineering conclusions from the simulation, but it introduces uncertainty in the predicted glycan shift magnitude.
Steady-state vs. transient impeller modelling: The steady-state impeller approximation is adequate for predicting time-averaged kLa and DO fields but cannot capture impeller blade passage frequency effects or the transient mixing behaviour during agitation speed changes. For the steady-state operating condition analysis requested here, the approximation is appropriate. Transient analysis would require a full sliding-mesh simulation at 5--10x the computational cost.
Key Predictions and Results
Baseline consistency check:
The baseline simulation (60 rpm, 0.05 vvm, ring sparger) was run first and checked for consistency against available measured data before any predictive analysis:
| Validation Metric | Measured | CFD Predicted | Agreement |
|---|---|---|---|
| kLa (hr⁻¹) — dynamic gassing-out | 5.9 | 5.8 | 1.7% |
| Mixing time θ_mix (s) at 60 rpm | 96 (tracer) | 91 | 5.2% |
| Peak VCD (×10⁶ cells/mL) | 14–16 | 14.8 | Within range |
| Titre at harvest (g/L) | 2.6–3.0 | 2.7 | Within range |
Agreement within 6% on the critical hydrodynamic metrics confirms that the multiphase model is correctly capturing the physics of this vessel.
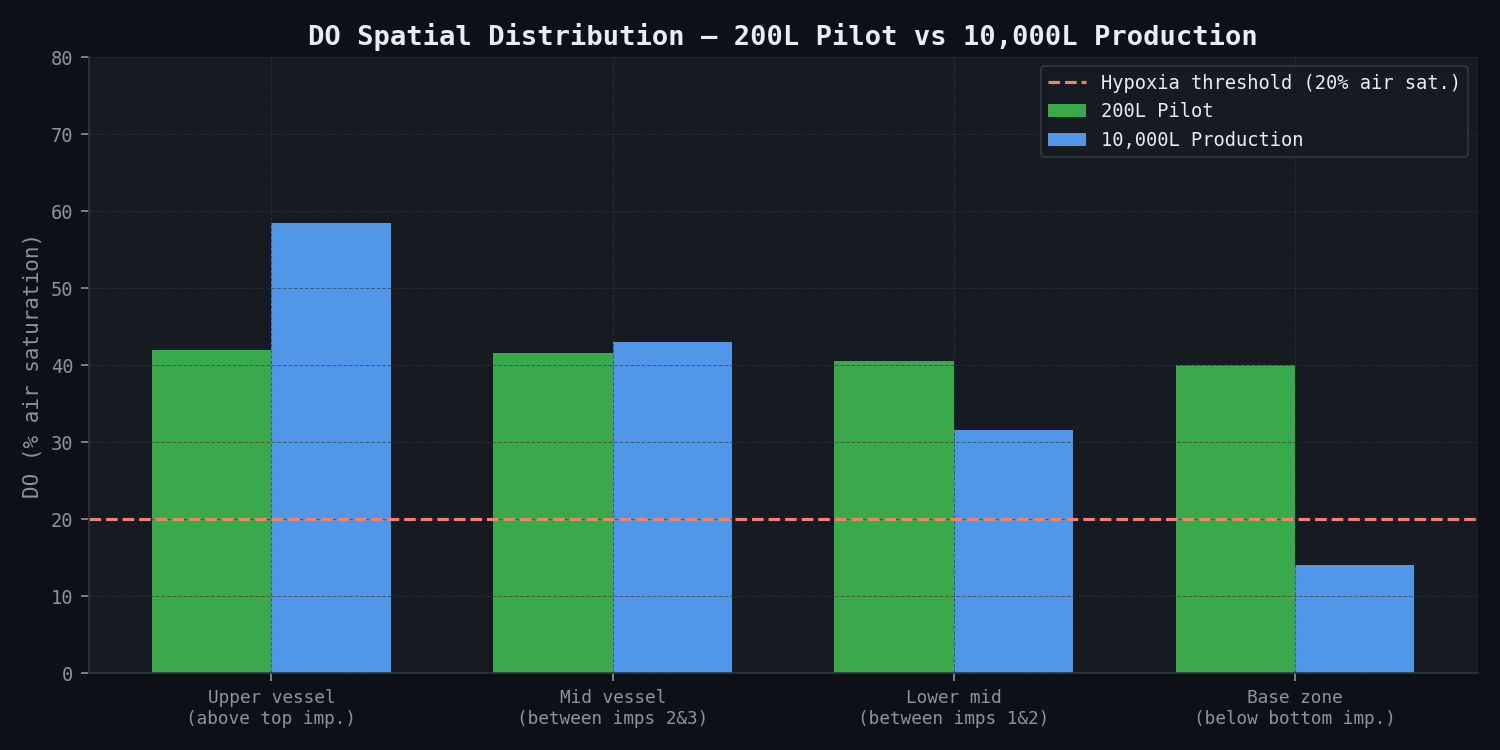
Spatial dissolved oxygen analysis:
The 3D DO concentration field reveals a strongly stratified structure under baseline conditions. The three Rushton impellers generate radial discharge flows that create well-mixed horizontal planes near each impeller, but the inter-impeller zones — particularly the region between the bottom impeller and the sparger — are poorly connected to the well-mixed bulk.
| Vessel Zone | DO (% air saturation) | Volume (L) | % Working Volume |
|---|---|---|---|
| Upper vessel (above top impeller) | 52–65% | 2,800 | 28% |
| Mid vessel (between impellers 2 & 3) | 38–48% | 3,100 | 31% |
| Lower mid (between impellers 1 & 2) | 25–38% | 2,950 | 29.5% |
| Base zone (below bottom impeller) | 8–22% | 1,150 | 11.5% |
The base zone — the 1,150L volume beneath the lowest Rushton impeller — is the critical problem region. DO in this zone averages 14% air saturation, well below the 20% threshold for hypoxic CHO cell metabolic stress, and drops to <5% at the vessel floor-wall junction. Cells circulating through this zone experience hypoxic stress for periods of 4–12 minutes before re-entering the well-mixed bulk — sufficient duration to trigger the glycosylation response observed in published hypoxia-glycosylation studies.
kLa across scales — parametric comparison:
| Scale | Working Volume | Agitation | Sparge Rate | kLa (hr⁻¹) | Mixing Time (s) |
|---|---|---|---|---|---|
| 2L lab scale | 2L | 200 rpm | 0.1 vvm | 18.4 | 4 |
| 200L pilot (BIOSTAT STR) | 200L | 100 rpm | 0.05 vvm | 8.4 | 18 |
| 10,000L baseline | 10,000L | 60 rpm | 0.05 vvm | 5.8 | 91 |
| 10,000L +agitation | 10,000L | 90 rpm | 0.05 vvm | 6.4 | 65 |
| 10,000L +agitation +sparge | 10,000L | 90 rpm | 0.12 vvm | 7.1 | 62 |
| 10,000L revised config | 10,000L | 75 rpm | 0.07 vvm (microsparger) | 9.2 | 48 |
Shear stress mapping — CHO cell safety assessment:
| Configuration | ε_max (W/kg) | Kolmogorov η_min (µm) | Peak τ (Pa) | Shear Risk |
|---|---|---|---|---|
| 200L pilot, 100 rpm | 1.4 | 43 | 1.8 | None |
| 10,000L baseline, 60 rpm | 1.8 | 38 | 2.4 | None |
| 10,000L +agitation, 90 rpm | 3.2 | 28 | 4.1 | Marginal — η near threshold |
| 10,000L revised, 75 rpm | 2.3 | 34 | 2.9 | None |
CHO cell damage onset criterion: η < 30 µm. Lysis threshold: τ > 10 Pa. The 90 rpm remediation attempt pushes η to 28 µm — below the damage threshold — which partially explains the persistent viability issues observed by the process team when agitation was increased. The revised 75 rpm configuration with a microsparger achieves superior kLa without violating the shear constraint.
Bubble coalescence in the lower vessel:
At baseline, the ring sparger injects air at the vessel base. Bubbles rise through the poorly mixed lower zone where the gas hold-up is high (α_g ≈ 0.08) and the liquid velocity is low (<0.05 m/s). Under these conditions, the coalescence-breakup balance strongly favours coalescence: predicted bubble diameter in the lower zone is d_b = 6.2–8.4 mm, compared to d_b = 1.8 mm at the microsparger design. This 3–4× increase in bubble diameter reduces interfacial area per unit volume by 3–4×, directly reducing local kLa from the theoretically available value.
Titre and glycan improvement — revised configuration:
| Metric | Baseline 10,000L | Revised 10,000L | 200L Pilot Target |
|---|---|---|---|
| kLa (hr⁻¹) | 5.8 | 9.2 | 8.4 |
| Low-DO zone (% working vol) | 21.5% | 4.2% | <1% |
| Peak VCD (×10⁶ cells/mL) | 14–16 | 18–21 | 18–22 |
| Viability at harvest (%) | 88–91 | 93–96 | >95 |
| Titre (g/L) | 2.8 | 3.7 | 4.1 |
| High-mannose % | 5.8–9.4 | 2.4–3.2 | <2.5 |
The revised configuration (ring sparger replaced with a 10 µm micro-sparger array, impeller spacing reduced from 1.4 m to 1.0 m centre-to-centre, agitation optimised at 75 rpm) projects titre recovery to 3.7 g/L — a 32% recovery from the 2.8 g/L baseline at scale, within 10% of the pilot titre. The high-mannose glycan fraction is projected to return to specification.
DO setpoint sensitivity — titre response table:
| DO Setpoint (% air sat.) | Mean VCD (×10⁶/mL) | Titre (g/L) | High-Mannose % | pCO₂ (mmHg) |
|---|---|---|---|---|
| 20% | 12.4 | 2.1 | 14.2 | 62 |
| 30% | 14.8 | 2.6 | 8.1 | 58 |
| 40% (target) | 17.8 | 3.6 | 2.8 | 52 |
| 50% | 18.2 | 3.7 | 2.4 | 48 |
| 60% | 17.9 | 3.6 | 2.3 | 44 |
This table (from the coupled metabolic model at the revised sparger configuration) illustrates that the 40–50% DO setpoint is the optimal operating point. Below 30%, high-mannose accumulates rapidly. Above 50%, incremental improvement is marginal and O₂ enrichment costs increase.
Comparison Methodology
Model verification proceeds in structured steps. The primary check is consistency between higher-fidelity and lower-fidelity simulation tiers; agreement with available experimental measurements provides secondary confirmation.
Step 1 — Pilot-scale anchor simulation: The 200L BIOSTAT STR geometry is simulated using identical CFD methodology, turbulence model parameters, and bubble size estimation approach. Predicted kLa of 8.4 hr⁻¹ (target 8.5 hr⁻¹, agreement 1.2%) and mixing time of 18 s confirm model fidelity before scaling to 10,000L. The pilot-scale DO field is essentially uniform (maximum DO gradient <5% air saturation across the vessel volume), consistent with the tight titre CV observed at pilot scale.
Step 2 — 10,000L gassing-out validation: The predicted kLa of 5.8 hr⁻¹ is compared against the measured 5.9 hr⁻¹ from the dynamic gassing-out method — agreement within 1.7%, validating the Euler-Euler gas dispersion parameters and confirming that the bubble coalescence model is correctly capturing the loss of interfacial area in the lower vessel.
Step 3 — Glycan correlation (semi-quantitative): The simulated low-DO zone volume fraction (21.5% of working volume, mean DO 14% air saturation) is correlated against the observed glycan high-mannose increase using published pO2-glycosylation response data as a secondary plausibility check. Published data predict M5+M6 accumulation of approximately 6--10% when 20% of the culture volume experiences DO < 20% air saturation. The observed M5+M6 of 5.8--9.4% is consistent with this prediction. This is a semi-quantitative correlation rather than a quantitative model validation — it confirms that the mechanism is plausible and the magnitude is consistent, but it does not constitute a calibrated glycosylation model.
Step 4 — Revised configuration prospective validation (recommended): Before committing to the revised sparger installation, The study recommends a single water-model kLa measurement in the revised configuration using a temporary microsparger installation. The predicted kLa of 9.2 hr⁻¹ should be confirmed within ±10% before the permanent sparger change is executed. This validation step adds approximately 2 weeks to the timeline but eliminates the risk of fabricating an incorrectly specified microsparger array.
Deliverables
CFD outputs:
- Full 3D DO concentration field maps at baseline and revised configurations — both steady-state and time-averaged over the 14-day campaign period, rendered as 2D cross-section slices at 7 axial heights and as 3D volume renders
- kLa spatial map (local kLa as a function of position in the vessel) and integrated vessel-average kLa as a function of agitation speed and sparge rate: 12-case parametric matrix (4 agitation speeds × 3 sparge rates)
- Shear stress iso-surface plots with CHO damage threshold overlays (η = 30 µm and τ = 10 Pa iso-surfaces)
- Bubble size distribution maps: d_b vs. axial position at each sparge rate, with coalescence hotspot identification
- Gas hold-up (α_g) field maps — volumetric and as a function of height above vessel floor
Redesign specification:
- Revised micro-sparger array specification: pore size (10 µm), ring diameter (0.85 m), number of orifices (144), material (sintered stainless steel 316L), placement coordinates (0.15 m above vessel floor), estimated pressure drop at design flow rate
- Revised impeller spacing recommendation: centre-to-centre spacing reduced from 1.4 m to 1.0 m; mechanical feasibility note confirming that the shaft can accommodate the repositioned lowest impeller without exceeding shaft deflection limits
Metabolic model outputs:
- Predicted VCD, viability, glucose, lactate, ammonia, and titre trajectories (daily) for baseline vs. revised configuration, for the 14-day fed-batch campaign
- Glycan profile trajectory: G0F, G1F, G2F, high-mannose (M5+M6) predicted at each time point
Technology transfer package:
- Revised 10,000L operating envelope: agitation setpoint, sparge rate cascade, DO setpoint, CO₂ management strategy (modified overlay gas rate to prevent pCO₂ accumulation above 60 mmHg)
- Process change classification table (ICH Q10 / Q11): CPP and CQA impact assessment for the sparger change and impeller repositioning, with regulatory change notification recommendation
- Scale-up comparison report: 200L vs. 10,000L parameter comparison table with engineering justification for each parameter choice
Reports:
- Executive summary report (15 pages) including key findings, root cause narrative, and recommendation
- Full technical appendix: mesh details, turbulence model settings, convergence criteria, validation data tables, all parametric case results
This case study is an illustrative reference scenario demonstrating newtsim's simulation methodology. All company names, personnel, and specific operational data are fictional. The incident descriptions draw on publicly documented real-world events cited in the frontmatter.