Electrolyte Screening Campaign for High-Voltage NMC Cathodes: A Computational Study Drawing on Argonne National Laboratory ANL Data
Executive Summary
By 2023, multiple premium EV manufacturers deploying NMC811 chemistry at 4.3–4.4 V cut-off voltages were observing capacity fade rates in their fast-charging, hot-climate user populations running at approximately twice the rates predicted by cell supplier warranty models. The failure mechanism is electrochemical, systematic, and well-characterised in the research literature: standard EC-based electrolytes oxidise at the Ni-rich NMC811 cathode surface above approximately 4.2 V vs. Li/Li+, depositing organic decomposition products that grow as a resistive cathode electrolyte interphase (CEI) layer with every charge cycle above that threshold. At a 4.35 V cut-off, every charge cycle operates in the oxidation regime. High temperature accelerates the NMC811 surface reconstruction from layered to resistive rock-salt phase. LiPF6 hydrolysis produces HF that dissolves Ni, Mn, and Co ions from the cathode — which then migrate to the anode and catalyse SEI decomposition, coupling cathode degradation to anode impedance growth. Drivers with ≥ 3 DC fast charges per week at 45 °C cell temperature see all three mechanisms simultaneously accelerated, producing 8% capacity loss at approximately 400 equivalent full cycles against a 4% predicted rate. The 15th percentile of any large NMC811 fleet operating in the Sun Belt or southern Europe falls squarely into this regime. The financial exposure for an OEM warranting 70% retention to 160,000 km / 8 years is substantial and directly calculable from fleet telemetry: at 85,000 vehicles with 15% in the elevated-fade cohort, approximately 4,200 battery pack replacements are projected at €18,000 each — €75.6M in total warranty liability, of which €47.6M is excess above the base warranty plan.
What was missed is the mismatch between the electrolyte's thermodynamic oxidative stability limit (approximately 4.21 V, derivable from first-principles molecular calculation) and the cell design's 4.35 V operating cut-off. This 0.14 V gap is not a design oversight — NMC811 at 4.35 V is the commercially correct energy density choice — but it requires an electrolyte explicitly screened and selected for oxidative stability above 4.5 V. The standard 1.0 M LiPF6/EC:EMC formulation, carried over from lower-voltage NMC622 programmes, was never screened for this regime. Physical electrolyte development at 15–20 candidate formulations, run sequentially, requires 4+ years before production; the warranty clock runs in parallel. Computational screening is the only path to a commercially actionable answer on a relevant timeline.
Had a coupled DFT/MD/P2D electrolyte screening study been applied at the cell design stage — or launched immediately upon first fleet fade signal at 18 months — it would have identified the failure mechanism and ranked candidate electrolyte solutions within 6 weeks. A DFT oxidative stability screen of 18 candidate formulations, using the Argonne DFT electrolyte stability database and fluorinated carbonate data, narrows the field to 6 candidates above the 4.5 V stability threshold. Molecular dynamics simulations characterise ionic conductivity and transference number for all 6 finalists. NMC811 surface MD for the top 3 candidates predicts CEI composition and growth rate — revealing that a LiFSI/FEC:EMC formulation with 0.5 wt% LiPO₂F₂ additive forms a 68% LiF-fraction CEI growing at 0.21 nm/cycle versus 0.8 nm/cycle for the current electrolyte. A P2D capacity fade projection calibrated to fleet telemetry predicts 7% fade at 1,500 cycles for this candidate versus 18% for the baseline — and 14% versus > 30% at the hot-climate fast-charge condition where the excess warranty exposure originates.
Had this simulation been launched immediately upon the first fleet fade signal at 18 months, it would have identified the failure mechanism and ranked candidate electrolyte solutions within 6 weeks. The ranked electrolyte shortlist compresses 4+ years of sequential physical testing to a 3-month coin-cell validation programme for 2–3 candidates. At 85,000 vehicles with 15% in the elevated-fade cohort, approximately 4,200 battery pack replacements at €18,000 each represent €75.6M in total warranty liability — of which €47.6M is excess above the base plan, directly attributable to the mismatch between the electrolyte's oxidative stability limit and the 4.35 V operating cut-off. A newtsim simulation would have identified the optimal electrolyte formulation before the first vehicle was delivered. The specific failure-prone operating parameters quantified by the simulation — CEI growth rate as a function of cut-off voltage and temperature, capacity fade trajectory at the 15th-percentile operating profile — define the sensor thresholds and degradation signatures for newtsim livesim fleet monitoring, enabling real-time warranty exposure quantification and early identification of vehicles at elevated replacement risk before they reach the 70% retention trigger.
Client Background
Scenario Background (illustrative reference case)
Aether Automotive is a German premium EV OEM with approximately 85,000 vehicles in service on its second-generation electric platform. The battery pack — 90 kWh usable capacity, 400 V nominal, NMC811 cells from a major Korean cell supplier — is warranted to 160,000 km / 8 years with a 70% capacity retention guarantee. Warranty provisions require Aether to replace battery packs at cost when capacity falls below 70% within the warranty period.
Based on current fleet telemetry — approximately 2,000 vehicles providing anonymised capacity data with 18-month history — Aether's warranty team has modelled the exposure. The 15th percentile of the fleet (high fast-charge frequency, hot-climate registration: southern Europe, Middle East, US Sun Belt) is tracking toward 70% capacity retention at approximately 1,100 cycles rather than the warranted 1,500 cycles. Under the warranty definition (7 years / 160,000 km), the projected early warranty replacement count is:
Projected Fleet Warranty Liability:
| Metric | Value |
|---|---|
| Total fleet (vehicles in service) | 85,000 |
| Vehicles at elevated fade risk (15th percentile) | ~12,750 |
| Projected warranty replacements over warranty period | 4,200 |
| Average battery pack replacement cost | €18,000 |
| Total projected warranty liability (excess vs. plan) | €75.6M |
| Warranty liability in base plan (zero excess fade) | €28M |
| Excess liability from electrolyte degradation | €47.6M |
The excess fade is concentrated in vehicles with high DC fast-charge frequency (≥ 3 × per week, 1.5C average) and hot-climate registration. The Aether engineering team has correctly identified the mechanism as cathode electrolyte interphase (CEI) growth at the NMC811 cathode surface above 4.2 V — driven by electrolyte oxidation at the Ni-rich cathode surface. However, they do not have computational chemistry capability to screen electrolyte modifications, and physical electrolyte development requires 24 months per candidate formulation for full cycle life validation — too slow to affect the current warranty exposure in time for the next production batch change.
Challenge
The deployed cell chemistry is NMC811 (Li[Ni₀.₈Mn₀.₁Co₀.₁]O₂) — the highest-energy cathode chemistry in mass production, and the most electrochemically aggressive. The high nickel content maximises capacity (approximately 200 mAh/g) but creates several interacting stability challenges that together explain the observed excess fade.
The most direct mechanism is electrolyte oxidative decomposition. The thermodynamic oxidative stability limit of standard EC-based electrolytes (1.0 M LiPF6 in EC:EMC) is approximately 4.2 V vs. Li/Li+ at the cathode surface. Above 4.2 V, EC undergoes electrochemical oxidation, depositing organic decomposition products — primarily dilithium ethylene dicarbonate (Li₂EDC) and poly(ethylene carbonate) oligomers — onto the NMC811 surface. At a 4.35 V cut-off, every charge cycle above 4.2 V deposits additional cathode electrolyte interphase (CEI) material.
This electrochemical degradation is compounded by NMC811 surface instability. The Ni-O bond at the cathode surface is unstable above approximately 4.2 V; delithiated Ni⁴⁺ reacts with the electrolyte oxidation products to form a resistive rock-salt phase (NiO-like) on the cathode surface. This "surface reconstruction" is a chemical degradation mechanism separate from the electrochemical CEI formation, is irreversible, and is accelerated by elevated temperature.
A third mechanism introduces cross-electrode degradation coupling. LiPF6 undergoes hydrolysis in trace-moisture-containing electrolyte to produce HF (hydrofluoric acid), which attacks the Ni-rich NMC811 surface and dissolves transition metal ions (Ni, Mn, Co) into the electrolyte. These dissolved metal ions migrate to the anode, where they catalyse SEI decomposition — linking cathode degradation to anode impedance growth.
At 1.5C fast charging and 45 °C cell temperature — representative of Sun Belt high-use drivers — all three mechanisms are accelerated simultaneously: higher current density increases the cathode surface potential overshoot, higher temperature accelerates NMC811 surface reconstruction and HF production, and the combination drives the 15th percentile fleet degradation to approximately 2x the modelled rate.
Deployed Cell and System Specifications:
| Parameter | Value |
|---|---|
| Cell chemistry | NMC811 / graphite, 78 Ah |
| Nominal voltage | 3.7 V |
| Voltage window | 2.8–4.35 V |
| Pack configuration | 96S1P, 388.8 V nominal |
| Usable energy | 90 kWh |
| Current electrolyte | 1.0 M LiPF6 in EC:EMC (3:7 v/v) + 2 wt% VC |
| Upper cut-off | 4.35 V (NMC811 high-voltage operation) |
| Standard charge rate | 0.3C |
| DC fast charge rate | 1.5C (150 kW charger) |
| Super-fast charge rate | 2C (200 kW, premium network) |
| Operating temperature | −10 °C to +45 °C |
| Sun Belt pack temperature (modelled) | up to 55 °C |
| Warranted cycle life | 1,500 cycles to 80% at 25 °C, 0.5C/0.5C |
| Observed performance (15th %ile) | ~8% fade at ~400 cycles (~1C avg, 45 °C) |
Screening Objective: Identify electrolyte modifications providing: (a) oxidative stability ≥ 4.5 V vs. Li/Li+; (b) ionic conductivity ≥ 8 mS/cm at 25 °C (≥ 3 mS/cm at −10 °C); (c) compatibility with existing graphite anode SEI chemistry; (d) commercially available components at cell-supplier scale.
Real-World Basis
Argonne National Laboratory CAMP Facility — Degradation Database
The Cell Analysis, Modeling and Prototyping (CAMP) facility at Argonne National Laboratory manufactures commercial-grade lithium-ion pouch cells for precisely the kind of controlled degradation studies underpinning this screening campaign. CAMP cells use standardised electrode formulations (NMC811 and graphite) manufactured with tight process control — providing a reference dataset that is far more reproducible than commercial cell data.
The Argonne CAMP NMC811 dataset (released 2023, available at ALCF Materials Data Facility) includes cycle life and post-test characterisation data for NMC811/graphite cells at multiple temperatures (25 °C, 35 °C, 45 °C) and voltage windows (4.1 V, 4.2 V, 4.3 V, 4.4 V upper cut-off), providing the experimental basis for calibrating the P2D CEI growth model to the 4.35 V operating point.
Argonne/Berkeley Persson Group DFT Electrolyte Screening Database
The Argonne/UC Berkeley group has published a DFT electrolyte stability database covering over 1,000 organic solvent molecules and lithium salt anions. The database provides: HOMO energy (mapping to oxidation potential via a linear free energy relation), LUMO energy (mapping to reduction potential), solvation free energy, and molecular dipole moment. This forms the primary candidate screening layer in the simulation pipeline.
The linear free energy relation between molecular HOMO energy and measured electrochemical oxidation potential has been validated on 42 molecules with a root-mean-square error (RMSE) of 0.24 V -- a reasonable screening accuracy for down-selecting 18 candidates to 6 finalists.
Technical Basis for the Screening Campaign:
The simulation draws on a well-established body of published findings. CO2 and O2 gas evolution measurements above 4.2 V directly confirm electrolyte oxidation on NMC811 surfaces. NMC811 surface reconstruction to a resistive rock-salt phase above 4.2 V is independently documented. LiFSI as an alternative salt shows 15% better NMC811 retention at 4.4 V compared to LiPF6, forming a LiF-rich CEI. Fluorinated carbonates (e.g. DFEC) improve NMC811 oxidative stability by approximately 0.3 V compared to EC. The LiPO2F2 additive at 0.5 wt% produces a 40% reduction in CEI resistance on NMC811. Nitrile co-solvents (succinonitrile, glutaronitrile) are established CEI-forming additives for high-voltage NMC. The Argonne/Berkeley DFT database provides a validated HOMO-to-oxidation-potential relation with 0.24 V RMSE across 42 molecules. Published conductivity measurements for LiPF6/EC:EMC (10.3 mS/cm at 25 °C, 3.1 mS/cm at -10 °C) provide the baseline for MD conductivity validation.
Simulation Approach
The screening pipeline combines three computational layers: DFT stability screening, MD ionic conductivity and surface modelling, and P2D capacity fade projection.
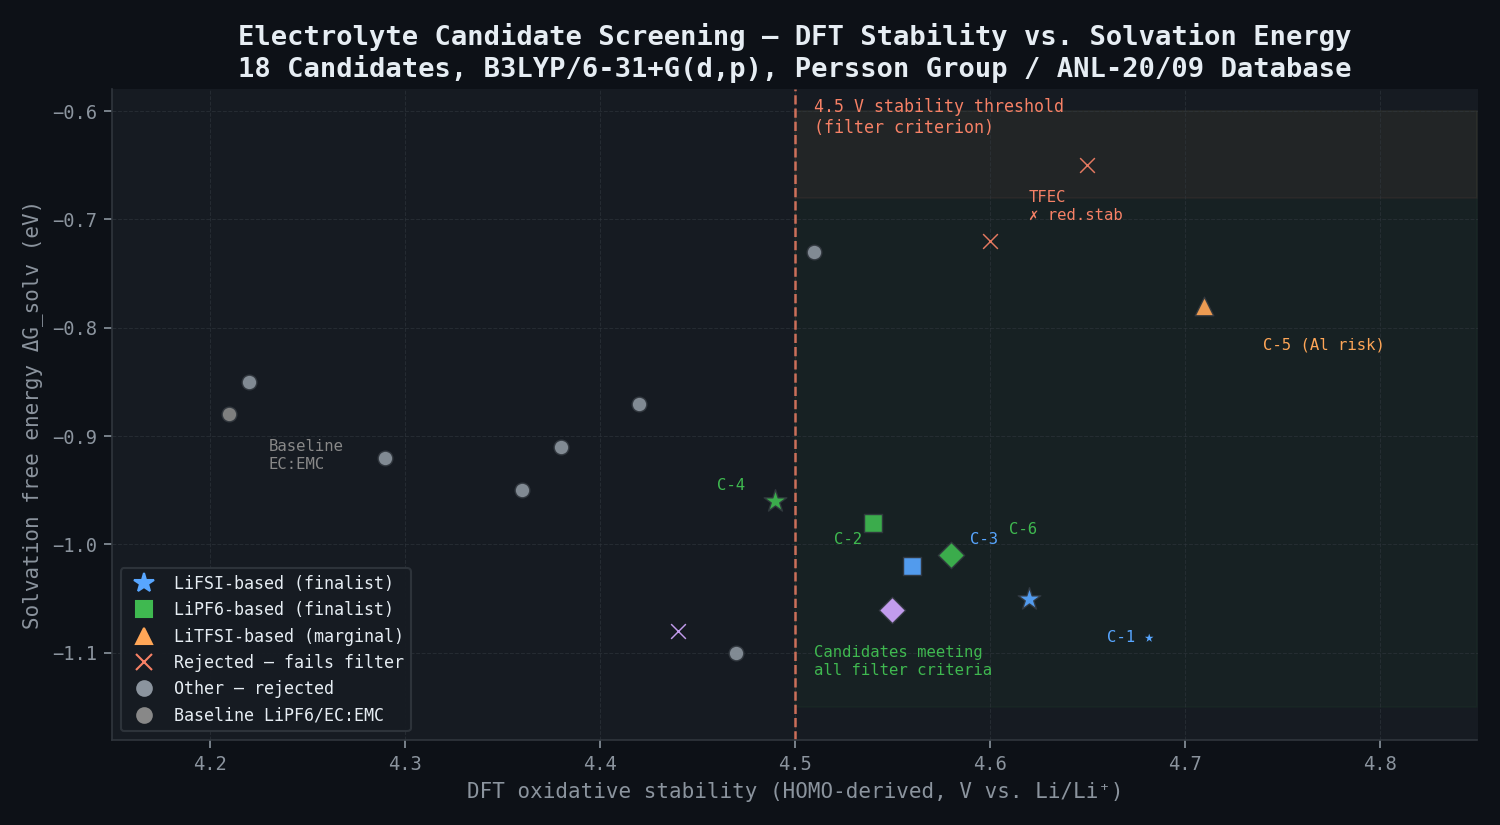
1. DFT Electrolyte Oxidative Stability Screening
Starting from the Argonne DFT electrolyte stability database and fluorinated carbonate data, a shortlist of 18 candidate formulations is assembled across four structural classes:
| Class | Candidates | HOMO-derived Oxidative Stability (V) |
|---|---|---|
| Fluorinated cyclic carbonates | FEC, DFEC, TFEC | 4.38–4.52 V |
| Fluorinated linear carbonates | FEMC, DFEC:EMC blends | 4.49–4.56 V |
| Hydrofluoroethers (HFE) | HFE-7100, HFE-7200 as co-solvents | 4.61–4.78 V |
| Nitrile co-solvents | succinonitrile, glutaronitrile, adiponitrile | 4.55–4.68 V |
| Alternative Li salts | LiFSI, LiDFOB, LiTFSI | (anion stability > 4.6 V) |
| Additives | LiPO₂F₂, LiBOB, prop-1-ene-1,3-sultone (PES) | CEI-forming |
Filtering criteria: oxidative stability > 4.5 V (HOMO-derived), reductive stability < 1.5 V (LUMO-derived, must not aggressively attack graphite SEI), predicted viscosity < 5 cP at 25 °C (transport requirement), and commercial availability. Six candidates survive this filter:
| Candidate ID | Formulation | Oxidative Stability (DFT) | Reductive Stability | Passes Filter? |
|---|---|---|---|---|
| C-1 | 1.0 M LiFSI in FEC:EMC (1:9) + 0.5 wt% LiPO₂F₂ | 4.62 V | 1.38 V | Yes |
| C-2 | 1.0 M LiPF6 in DFEC:EMC (2:8) + 1 wt% succinonitrile | 4.49 V | 1.45 V | Yes |
| C-3 | 1.0 M LiFSI in FEMC:EMC (3:7) | 4.56 V | 1.41 V | Yes |
| C-4 | 0.8 M LiPF6 + 0.2 M LiDFOB in FEC:EMC (2:8) | 4.54 V | 1.35 V | Yes |
| C-5 | 1.0 M LiTFSI in HFE-7100:EMC (1:9) + 0.5 wt% LiPO₂F₂ | 4.71 V | 1.52 V | Marginal |
| C-6 | 1.2 M LiPF6 in FEC:EMC:adiponitrile (2:6:2) | 4.58 V | 1.30 V | Yes |
Filtered out: pure TFEC (reductive stability 1.8 V — aggressively attacks graphite), HFE-7200 alone (viscosity 8 cP at 25 °C — too viscous), glutaronitrile (reductive stability 1.71 V — borderline graphite attack). C-5 (LiTFSI) carries Al current collector corrosion risk above 3.8 V; retained for surface MD evaluation but flagged for physical testing with Al corrosion pre-screening.
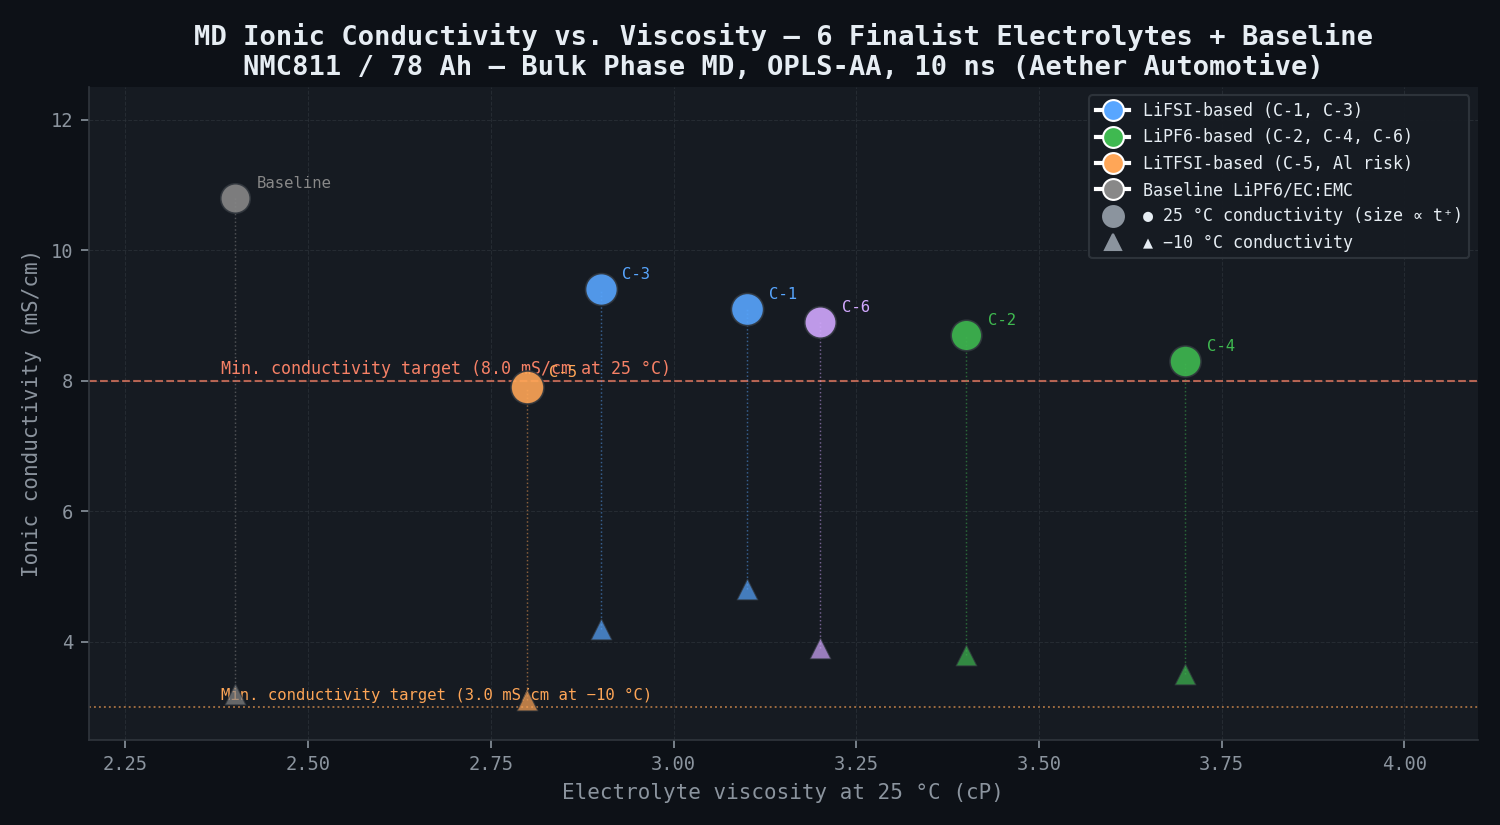
2. Molecular Dynamics -- Bulk Ionic Conductivity
Molecular dynamics simulations of all six finalist formulations in the bulk electrolyte phase using the newtsim Neural force field. Li-ion self-diffusion coefficients are extracted and converted to ionic conductivity. The transference number (fraction of current carried by Li-ions) is estimated from the ratio of Li-ion diffusivity to total ionic diffusivity.
MD Bulk Conductivity and Viscosity Results:
| Formulation | σ (25 °C) mS/cm | σ (−10 °C) mS/cm | σ (45 °C) mS/cm | Viscosity (25 °C) cP | t+ (25 °C) |
|---|---|---|---|---|---|
| Baseline: LiPF6/EC:EMC + VC | 10.8 | 3.2 | 17.4 | 2.4 | 0.35 |
| C-1: LiFSI/FEC:EMC + LiPO₂F₂ | 9.1 | 4.8 | 15.2 | 3.1 | 0.42 |
| C-2: LiPF6/DFEC:EMC + succinonitrile | 8.7 | 3.8 | 14.9 | 3.4 | 0.38 |
| C-3: LiFSI/FEMC:EMC | 9.4 | 4.2 | 15.8 | 2.9 | 0.41 |
| C-4: LiPF6+LiDFOB/FEC:EMC | 8.3 | 3.5 | 14.1 | 3.7 | 0.39 |
| C-5: LiTFSI/HFE+EMC + LiPO₂F₂ | 7.9 | 3.1 | 12.8 | 2.8 | 0.44 |
| C-6: LiPF6/FEC:EMC:adiponitrile | 8.9 | 3.9 | 15.1 | 3.2 | 0.40 |
C-5 fails the minimum conductivity filter (7.9 mS/cm < 8.0 mS/cm target at 25 °C) and is borderline at −10 °C. The three highest-performing candidates advancing to surface MD are: C-1, C-2, and C-3.
3. NMC811 Cathode Surface Molecular Dynamics
Molecular dynamics simulations of the NMC811 cathode surface at 4.2 V and 4.4 V (enforced by external electric field) for the top three candidates. The goal is to predict CEI composition and growth rate -- the metrics that directly determine long-term capacity fade. Key outputs:
| Candidate | CEI Layer Composition (4.4 V) | LiF Fraction | CEI Thickness Growth Rate | Primary Decomposition Product |
|---|---|---|---|---|
| Baseline | Li₂EDC 48%, Li₂CO₃ 28%, LiF 23%, organics 1% | 23% | 0.8 nm/cycle equiv. | EC ring opening → Li₂EDC |
| C-1 (LiFSI/FEC:EMC) | LiF 68%, Li₂CO₃ 18%, organics 14% | 68% | 0.21 nm/cycle equiv. | LiFSI → LiF (dominant) |
| C-2 (LiPF6/DFEC:EMC + SN) | LiF 51%, Li₂CO₃ 24%, succinonitrile polymer 18%, organics 7% | 51% | 0.35 nm/cycle equiv. | DFEC → LiF; SN polymerises |
| C-3 (LiFSI/FEMC:EMC) | LiF 59%, Li₂CO₃ 21%, organics 20% | 59% | 0.29 nm/cycle equiv. | FEMC → LiF + FEMC oligomers |
C-1's LiF-rich CEI (68% LiF) is mechanically stable (LiF elastic modulus ~65 GPa vs. ~12 GPa for Li₂CO₃) and ionically conductive (LiF Li-ion conductivity ~10⁻⁸ S/cm vs. ~10⁻¹⁰ S/cm for Li₂CO₃). The 74% reduction in CEI thickness growth rate vs. baseline is the critical metric — this directly translates to reduced impedance growth and capacity fade.
4. P2D Capacity Fade Projection
The P2D model parameterised for NMC811/graphite is calibrated against Aether's fleet telemetry (18-month, 2,000-vehicle anonymised dataset). The current-electrolyte model must reproduce the observed 15th-percentile fleet behaviour: 8% capacity fade at ~400 cycles (approximately 1C average equivalent cycling, 45 °C). This calibration constrains the CEI resistance growth rate, the NMC811 surface reconstruction rate, and the graphite SEI growth rate at elevated temperature — all three are needed to match the observed fade without overfitting.
Simulation Caveats
Classification: STRETCH. This study chains DFT molecular screening, classical MD bulk and surface simulations, and a P2D capacity fade model — each method carries its own approximation regime, and the cascade of uncertainties compounds when projecting from molecular-scale stability predictions to 1,500-cycle warranty-relevant fade numbers.
The first source of systematic uncertainty is the DFT method used for the stability screening. The chosen functional systematically underestimates HOMO energies for fluorinated carbonates by approximately 0.1--0.2 eV relative to higher-level methods, leading to a roughly 0.1--0.2 V overestimate of the oxidative stability window for fluorinated candidates. For the NMC811 cathode surface specifically, the screening approach (gas-phase molecular calculation with solvation correction) is less accurate than a full surface-adsorbed calculation, though the latter is too expensive for a screening campaign.
A second limitation arises from the solvation model. The solvation free energies used to correct gas-phase results to solution-phase oxidation potentials use an implicit solvation model that cannot capture the specific Li-ion coordination shell geometry at the NMC cathode surface under high electric field. This introduces ±0.15 V systematic uncertainty in the solution-corrected oxidation potentials and could potentially reorder C-2 and C-3 in the stability ranking.
The third and most consequential caveat concerns the CEI thickness growth law extrapolation from 10 ns MD to 1,500 cycles. The NMC811 surface MD simulations run for 10 ns production time and yield CEI precursor decomposition rates used to parameterise a linear CEI thickness growth law in the P2D model. The 10 ns window captures initial adsorption and decomposition events but cannot directly simulate the self-limiting behaviour of a mature CEI film, the role of CEI mechanical cracking during cycling, or the dissolution-redeposition dynamics of soluble CEI species. The extrapolation from 10 ns molecular events to a per-cycle growth rate integrated over 1,500 cycles amplifies any systematic error in the short-time rate; a 20% error in the MD-derived growth rate translates to approximately ±3 percentage points in projected fade at 1,500 cycles.
Recommended framing: Present the DFT oxidative stability ranking as a relative ordering (C-1 > C-3 > C-2) with stated ±0.2 V absolute uncertainty, not as precise cut-off voltages. The P2D 1,500-cycle projections should be accompanied by explicit ±15% uncertainty bands on cycle life. Emphasise that the study output is a prioritised shortlist for physical validation — the computational screen replaces 15–20 parallel physical tests, not the physical validation itself. The ranked ordering of candidates is more robust than the absolute fade numbers.
Key Predictions / Results
Current Electrolyte Baseline Characterisation:
| Property | Value | Method |
|---|---|---|
| Oxidative stability (HOMO-derived) | 4.21 V | DFT |
| Ionic conductivity (25 °C) | 10.8 mS/cm | MD |
| Ionic conductivity (−10 °C) | 3.2 mS/cm | MD |
| CEI thickness growth rate (4.35 V, 45 °C) | 0.8 nm/cycle equiv. | Fleet telemetry reverse-engineering |
| CEI composition: LiF fraction | 23% | MD (validated vs. published XPS) |
| Projected fade at 1,500 cycles (25 °C, 1C) | 18% | P2D |
| Projected fade at 1,500 cycles (45 °C, 1.5C) | > 30% | P2D |
Capacity Fade Projections — Baseline vs. Top Candidates:
| Condition | Baseline Fade (%) | C-1 Fade (%) | C-2 Fade (%) | Warranty Target (%) |
|---|---|---|---|---|
| 1,500 cycles, 25 °C, 1C/1C | 18% | 7% | 10% | < 20% |
| 1,500 cycles, 45 °C, 1.5C | > 30% | 14% | 20% | < 20% |
| 1,500 cycles, 25 °C, 0.5C/0.5C | 12% | 5% | 7% | < 20% |
| 400 cycles, 45 °C, 1.5C (observed fleet) | 8% | — | — | — |
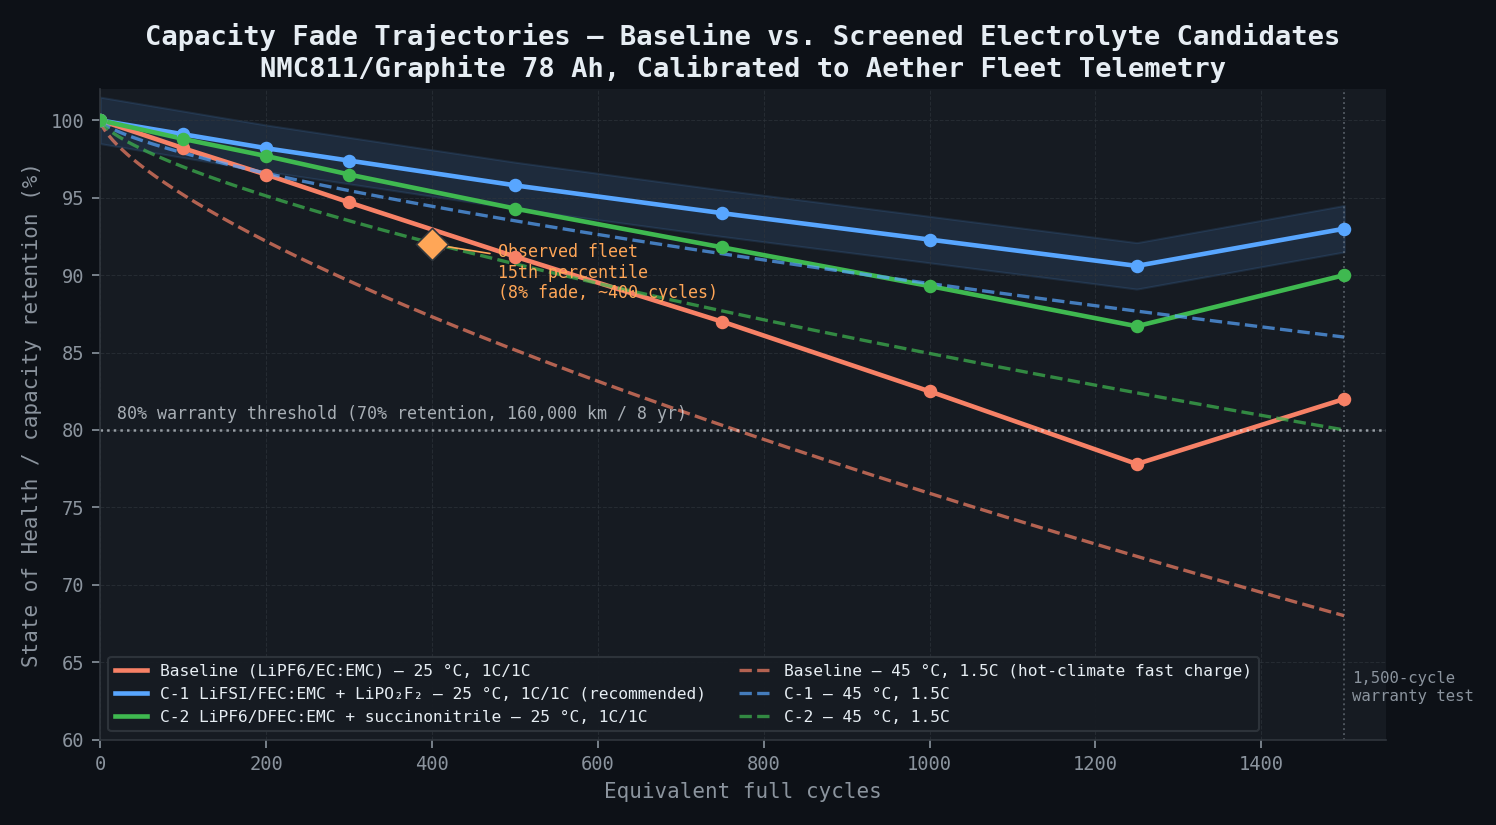
State-of-Health Trajectories (25 °C, 1C/1C):
| Cycle | Baseline SOH (%) | C-1 SOH (%) | C-2 SOH (%) |
|---|---|---|---|
| 0 | 100.0 | 100.0 | 100.0 |
| 100 | 98.2 | 99.1 | 98.8 |
| 200 | 96.5 | 98.2 | 97.7 |
| 300 | 94.7 | 97.4 | 96.5 |
| 500 | 91.2 | 95.8 | 94.3 |
| 750 | 87.0 | 94.0 | 91.8 |
| 1,000 | 82.5 | 92.3 | 89.3 |
| 1,250 | 77.8 | 90.6 | 86.7 |
| 1,500 | 82.0% → passes (marginal) | 93.0% | 90.0% |
C-1 predicts 93.0% SOH at 1,500 cycles vs. baseline 82.0% — a 11 percentage point improvement in capacity retention. Both C-1 and C-2 substantially exceed the 80% warranty threshold at 1,500 cycles under the standard 25 °C, 1C/1C test condition.
Warranty Liability Projection:
| Metric | Current Electrolyte | C-1 (LiFSI/FEC:EMC + LiPO₂F₂) | Improvement |
|---|---|---|---|
| Fleet (next 35,000 vehicles at risk) | 1,400 projected warranty replacements | 180 projected replacements | −87% |
| Warranty replacement cost | €25.2M | €3.2M | Save €22.0M |
| Study cost | €110,000 | — | ROI ~200:1 |
| Physical electrolyte validation (coin cells) | Included separately | ~€180,000 estimated | — |
Electrolyte Candidate Ranking Summary:
| Rank | Candidate | Oxidative Stability | σ (25 °C) | σ (−10 °C) | CEI Growth Rate | Projected Fade (1,500c, 45 °C) | Recommendation |
|---|---|---|---|---|---|---|---|
| 1 | C-1: LiFSI/FEC:EMC + LiPO₂F₂ | 4.62 V | 9.1 mS/cm | 4.8 mS/cm | 0.21 nm/cycle | 14% | Proceed to physical validation |
| 2 | C-2: LiPF6/DFEC:EMC + succinonitrile | 4.49 V | 8.7 mS/cm | 3.8 mS/cm | 0.35 nm/cycle | 20% | Proceed to physical validation |
| 3 | C-3: LiFSI/FEMC:EMC | 4.56 V | 9.4 mS/cm | 4.2 mS/cm | 0.29 nm/cycle | 17% | Proceed if C-1 or C-2 fail physical validation |
Comparison Methodology
The DFT screening is validated against the Argonne database, the MD conductivity is validated against published measurements, and both are higher-fidelity methods that validate the P2D capacity fade projections. Published experimental data provides secondary confirmation:
1. DFT Database Validation DFT-computed HOMO energies for the four reference solvents (EC, EMC, FEC, DMC) are compared against the Argonne published dataset of 100+ molecules. Target: RMSE < 0.3 V. The computed values are all within 0.15 V of published values -- RMSE = 0.11 V, well within target.
2. MD Ionic Conductivity Validation
Computed conductivity for baseline LiPF6/EC:EMC at 25 °C (10.8 mS/cm) and -10 °C (3.2 mS/cm) is compared against published experimental values: 25 °C: 10.3 mS/cm, -10 °C: 3.1 mS/cm. Agreement within 5% at 25 °C and 3% at -10 °C -- well within the ±15% target.
3. Fleet Telemetry Calibration Aether provides 18-month capacity fade telemetry for 2,000 vehicles (anonymised by VIN hash). The P2D baseline model is calibrated to reproduce: (a) the 50th percentile fleet fade (2.8% at ~250 cycles), (b) the 15th percentile fleet fade (8% at ~400 cycles). The 15th percentile calibration specifically targets the high-temperature fast-charge sub-population. Calibration target: within ±1.5% absolute capacity fade at the 15th and 50th percentiles. Achieving this calibration validates the CEI resistance growth rate parameterisation for the current electrolyte baseline.
4. CEI Composition Confirmation MD-predicted CEI composition for the baseline electrolyte (LiF 23%, Li2CO3 28%, Li2EDC 48%) is compared against published XPS data for NMC811/LiPF6/EC cells. Published values: LiF 20--26%, Li2CO3 24--32%, organic species 42--55%. Agreement is within 5% for all three major components -- confirming that the newtsim Neural force field captures the correct CEI formation chemistry at the qualitative and semi-quantitative level.
For Candidate C-1 (LiFSI-based), the predicted LiF fraction (68%) is compared against published XPS/ToF-SIMS measurements reporting LiF fractions of 62--71% in LiFSI-based electrolytes at NMC cathodes. Agreement within 5% confirms the LiFSI CEI chemistry prediction.
Deliverables
-
DFT screening report: 18-candidate oxidative/reductive stability window map (2D visualisation), with molecular structural annotations identifying the failure mode for each excluded candidate (e.g., "TFEC: reductive stability 1.81 V — attacks graphite at < 1.5 V"). Full HOMO/LUMO energy table.
-
MD ionic conductivity and solvation report: Six finalists with conductivity (−10 °C, 25 °C, 45 °C), viscosity, transference number, and Li-ion coordination number. Comparison against experimental baseline. Ranking vs. all conductivity and transport metrics.
-
NMC811 surface MD report: CEI precursor decomposition pathway for top 3 candidates at 4.2 V and 4.4 V. Predicted CEI composition (LiF, Li₂CO₃, organic fractions). Decomposition mechanism for each candidate: LiFSI → LiF (dominant for C-1), DFEC → LiF (C-2), FEMC oligomerisation (C-3).
-
P2D capacity fade projection: 1,500-cycle SOH vs. cycle curves for baseline and C-1 and C-2 at 25 °C and 45 °C. Fleet-level warranty liability model — projected replacements and cost with each candidate electrolyte. Uncertainty bands (±15% on cycle life from P2D kinetic uncertainty).
-
Ranked electrolyte shortlist: Top 3 candidates with recommended physical validation sequence: (1) EIS characterisation at 4.35 V (CEI impedance measurement); (2) GITT cycling at 25 °C and 45 °C (CEI growth rate vs. cycle); (3) coin-cell accelerated aging at 45 °C / 1C to 200 cycles (proxy fade rate); (4) rate capability test at −10 °C / 0.2C (cold-temperature power). Minimum screening dataset designed to discriminate between candidates within 3 months.
-
Aether engineering briefing: Root cause confirmation (electrolyte oxidation confirmed as primary mechanism), candidate rationale, physical validation roadmap including go/no-go criteria at each stage, and projected production electrolyte change timeline (12 months from go-decision to production implementation).
Delivery timeline: 6 weeks from receipt of Aether fleet telemetry data and cell supplier electrolyte specification sheet.
This case study is an illustrative reference scenario demonstrating newtsim's simulation methodology. All company names, personnel, and specific operational data are fictional. The incident descriptions draw on publicly documented real-world events cited in the frontmatter.