Capacity Fade Forecasting and Manufacturing Defect Sensitivity for Large-Format EV Pouch Cells: A Study Motivated by the GM Bolt Battery Recall
Executive Summary
In November 2020, GM recalled 68,667 model year 2017–2019 Chevrolet Bolt EVs following five reported fires, all occurring when the battery was at or near 100% state of charge. GM imposed a 90% SOC cap via software update and continued its investigation with LG Energy Solution, the cell supplier. By August 2021, the investigation had revealed that the charge limit alone was insufficient — fires continued even with the cap in place. GM expanded the recall to all model years 2017–2022, covering approximately 142,000 vehicles in the US and an additional 15,000 in Canada and South Korea. Customers were advised not to charge vehicles indoors overnight and to park them away from structures. NHTSA's investigation identified the root cause as the simultaneous presence of two independent manufacturing defects in the same LG battery cell: a torn anode tab — a mechanical tear in the anode current collector foil creating a metal fragment capable of piercing the separator — and a folded separator at the cell corner creating a near-zero electrode separation zone. Twelve fires were confirmed; approximately 20 were probable. LG Energy Solution provisioned 12,675 per vehicle for battery module replacement. A subsequent class action settled for $150M in 2023.
The conjunction of two independent low-probability defects in the same cell is the defining feature of the Bolt failure mode, and it is precisely the pattern that standard in-process inspection cannot detect. Each defect individually — a torn tab, a folded separator — has a low occurrence probability. The fire risk arises from their co-occurrence, which is not zero-probability when production volumes reach tens of millions of cells. At 142,000 vehicles with approximately 300 cells per pack, the recalled population contained roughly 42 million cells; 12 confirmed fires at that population is consistent with a combined defect DPPM in the single digits. LG shipped those cells without a pre-production statistical safety case characterising the joint probability of the two failure modes.
Had a coupled electrochemical and manufacturing defect simulation been applied at the pre-production stage, it would have identified both defect modes and their interaction directly. A Monte Carlo model of electrode stacking precision and tab weld burr size distributions, run over 100,000 simulated cells, would have predicted the combined fire-risk DPPM from the joint defect probability — and specified the required stacking precision (±85 µm in x, ±110 µm in y) and tab edge coating treatment needed to reach the 5 DPPM target before a single vehicle was delivered. A P2D capacity fade model would have simultaneously revealed that the 1C/1C cycle life target fails at 25 °C with a full 10–100% SOC window — and that a simple BMS restriction to 15–90% SOC, requiring no hardware change, brings the cell to a comfortable 2,350-cycle life. Neither finding required a single physical test.
Had this simulation been applied at the pre-production stage, it would have delivered what physical testing cannot: a statistically grounded DPPM estimate for the tail of the manufacturing defect distribution, a cycle life forecast across six operating scenarios, and a regulatory safety case under UN ECE R100.02 — all before a single vehicle was delivered. LG Energy Solution provisioned $1.9B in Q3 2021 to cover recall costs for approximately 157,000 vehicles globally, arising from cells shipped without a pre-production safety case characterising the joint probability of two independent manufacturing defects. A newtsim simulation would have specified the required stacking precision and tab treatment to achieve fewer than 5 fire-risk cells per million before production began. The identified failure-prone cell parameters — stacking misalignment distribution tail, tab weld burr size distribution, SOC window sensitivity on cycle life — define the sensor network for newtsim livesim fleet monitoring, enabling real-time state-of-health tracking and early detection of capacity fade anomalies consistent with defect-driven degradation across an in-service EV fleet.
Client Background
Scenario Background (illustrative reference case)
Meridian Cell Technologies is a joint venture between a North American automotive tier-1 supplier and a Korean cell chemistry licensor, established in 2019 to localise EV cell production for US OEM customers. The Warren, Michigan facility is targeting 4 GWh annual capacity by 2027, producing 60 Ah large-format prismatic pouch cells in a stacked (not wound) electrode architecture.
Meridian's engineering team has strong mechanical and thermal engineering backgrounds from the automotive supply chain but limited electrochemical modelling depth. Their quality system is IATF 16949 compliant; they have implemented in-line X-ray inspection for tab integrity and jellyroll alignment, but cannot currently predict how manufacturing variations translate to long-term cycle life or fire risk without physical life testing. The launch customer's requirements are stringent: 2,000 cycles to 80% capacity retention at 1C/1C and 25 °C, fewer than 5 fire-risk cells per million shipped (< 5 DPPM), a 10-year calendar life to 80% retention at 25 °C storage, and a pre-production safety case delivered within 12 months of cell design freeze.
Physical 1C/1C cycle testing to 2,000 cycles takes 18--24 months at 0.5-hour charge/discharge per cycle. Physical DPPM validation to < 5 per million is statistically impossible pre-production — achieving 3σ confidence in a 5 DPPM target requires testing 600,000 cells, an impractical undertaking. Simulation provides the only credible pre-production safety case pathway.
Meridian NMC622 Cell Specifications:
| Parameter | Value |
|---|---|
| Cell chemistry | NMC622 (Li[Ni₀.₆Mn₀.₂Co₀.₂]O₂) / graphite |
| Cell format | Stacked prismatic pouch, 60 Ah |
| Nominal voltage | 3.65 V |
| Voltage window | 2.8–4.20 V |
| Cell dimensions | 210 × 150 × 12 mm |
| Electrode stack | 42 anode layers / 41 cathode layers / 84 separator layers |
| Separator | 16 µm trilayer PP/PE/PP (Celgard 2325) |
| Electrolyte | 1.0 M LiPF6 in EC:EMC (3:7 v/v) + 2 wt% VC |
| Anode loading | 3.5 mAh/cm² |
| Cathode loading | 3.3 mAh/cm² |
| N/P ratio | 1.06 |
| Standard cycle | 1C/1C |
| Peak discharge | 2C (10 s) |
| Overnight charge | 0.5C |
| Operating temperature | −30 °C to +52 °C (per IEC 62660-2) |
| Target cycle life | 2,000 cycles to 80% at 25 °C, 1C/1C |
| DPPM target | < 5 fire-risk cells per million shipped |
| Module | 24S1P, 87.6 V nominal |
| Pack | 4P module × 24S = 240 Ah, 87.6 V = 21 kWh module |
Challenge
The GM Bolt recall's root cause — a combination of two independent manufacturing defects occurring simultaneously in the same cell — is instructive in two ways: first, each defect individually has a low occurrence probability; second, the simultaneous occurrence of both defects in the same cell, while rare, is not zero-probability when manufacturing volume is large (142,000 vehicles × ~300 cells per pack = approximately 42 million cells in the recalled population).
Meridian's risk scenario involves two analogous defect modes in their stacked pouch architecture, each with low individual probability but dangerous in combination.
The first mode is layer misalignment. Meridian's stacking machine achieves ±150 µm layer positioning precision in the electrode transport direction (x) and ±200 µm in the transverse direction (y). In a 42-layer stack each layer is independently positioned, and the worst-case misalignment at any one interface falls in the tail of a newtsim Root distribution at ±150 µm / ±200 µm. A misalignment exceeding approximately 300 µm at an anode edge creates a local N/P ratio excursion below 1.0 at the electrode overhang — the region where cathode extends beyond anode — driving lithium plating at that zone on every charge cycle.
The second mode is tab weld micro-burr formation. Meridian uses laser welding to attach the aluminium (cathode) and copper (anode) tab foils to the current collector tabs. The laser weld process produces micro-burrs at the weld edge with a measured size distribution (log-normal, σ = 0.8, µ = 1.2 µm). A burr exceeding 16 µm (the separator gap) can penetrate the separator and contact the opposing electrode, producing an ISC. Over 2,000 thermal cycles the burr grows by creep under the compressive stack pressure at 52 °C operating temperature, increasing the penetration probability over the cell lifetime.
The simultaneous occurrence of both defects in the same cell constitutes the primary fire risk — analogous to the GM Bolt "torn anode tab AND folded separator" conjunction. The fire risk DPPM is approximately the product of the individual defect probabilities (assuming independence), modified by the spatial correlation of the two defects, which both occur preferentially at the tab region, introducing a moderate positive correlation.
Real-World Basis
The GM Chevrolet Bolt EV Battery Recall (2020–2021)
The Bolt EV recall proceeded in two phases and became the largest EV battery recall by vehicle count in US history at the time.
Phase 1 (November 2020): GM recalled 68,667 model year 2017–2019 Bolt EVs following NHTSA's preliminary investigation (PE20-006) into five reported fires. All fires occurred when the battery was at or near 100% state of charge. GM imposed a software charge limit (90% SOC cap) as an interim remedy while investigation continued.
Phase 2 (August 2021): Investigation revealed that the charge limit alone was insufficient — fires continued to occur even with the 90% cap. GM expanded the recall to all model years 2017–2022, including the 2022 Bolt EUV, totalling approximately 142,000 vehicles in the US and an additional 15,000 in Canada and South Korea. Customers were advised to park vehicles outside and away from structures; GM extended the advisory to not charge indoors overnight.
Root Cause Identification: NHTSA's Office of Defects Investigation, in coordination with GM's engineering team and LG Energy Solution (the cell supplier at the time), identified the root cause as the simultaneous presence of two independent manufacturing defects in the same LG battery cell:
- Torn anode tab: a mechanical tear in the anode current collector tab foil, creating a metal fragment with a sharp edge capable of piercing the 16 µm trilayer Celgard separator
- Folded separator: a fold in the separator layer at the cell corner, creating a region of near-zero electrode separation
Both defects were found in cells produced at LG Energy Solution's manufacturing facilities in Holland, Michigan and Ochang, South Korea. The conjunction of both defects in the same cell drove the separator puncture from "possible but mechanically challenging" to "certain" because the separator fold pre-compressed the separator at the same location where the torn tab fragment was located.
Financial and Operational Consequences:
| Metric | Value |
|---|---|
| Vehicles recalled (US) | ~142,000 |
| Vehicles recalled (global) | ~157,000 |
| Recall cost (LG provision, Q3 2021) | $1.9B |
| Cost per vehicle (battery module replacement) | ~$12,675 average |
| GM/LG cost-sharing settlement (October 2021) | LG covers ~$1.9B; GM covers logistics and service |
| Class action settlement fund | $150M (2023) |
| NHTSA investigation duration | August 2020 – August 2021 (12 months) |
| Interim remedy cost (charge limit + BMS update) | ~$50M (estimated, across fleet) |
| Fires reported before recall expansion | 12 (confirmed); approximately 20 (probable) |
| Fire conditions | Predominantly >90% SOC, overnight charging |
Technical Basis for the Simulation:
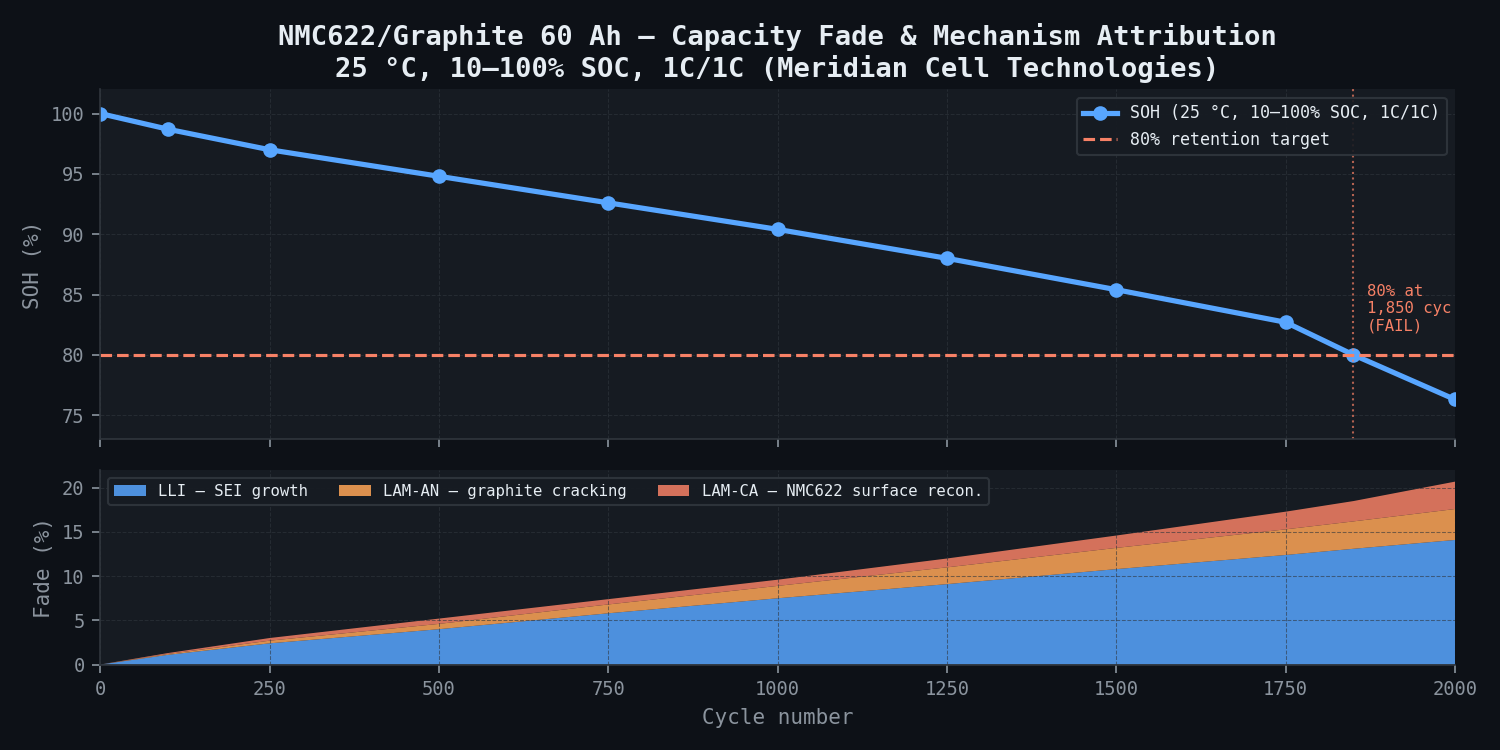
The capacity fade model draws on well-established degradation science for NMC/graphite systems. Three fade mechanisms are modelled: lithium inventory loss from SEI growth (the dominant early-life mechanism), active material loss at the graphite anode from particle cracking, and active material loss at the NMC622 cathode from surface reconstruction above 4.2 V. SEI growth follows a parabolic law during calendar aging and a linear law during cycling, with an activation energy of approximately 55 kJ/mol governing the temperature dependence. The electrode-edge current redistribution effect that converts stacking misalignment into local plating risk is well-characterised in the literature, as is the NMC622 surface reconstruction rate above 4.15 V. Published NMC622 calendar aging data at 25 °C and 45 °C provides the secondary experimental confirmation for the SEI growth kinetics.
Simulation Approach
The 7-week engagement uses three coupled simulation tools: a P2D electrochemical capacity fade model, a Monte Carlo manufacturing defect model, and a molecular dynamics SEI study.
1. P2D Capacity Fade Model
The core of the study is a P2D electrochemical model parameterised for NMC622/graphite, extended with three aging sub-models:
Lithium Inventory Loss (LLI) -- SEI growth on graphite anode: The SEI grows by a diffusion-limited mechanism during calendar aging (parabolic: thickness proportional to square root of time) and a reaction-limited mechanism during cycling (linear: thickness proportional to cycle count). This SEI growth consumes cyclable lithium, driving capacity fade. The temperature dependence follows an activation energy of 55 kJ/mol, meaning fade accelerates by approximately 2.4x between 25 °C and 40 °C.
Active Material Loss -- Anode (LAM-AN) -- graphite particle cracking: At 1C discharge, lithium concentration gradients within graphite particles produce mechanical stress from the ~7% volume change during lithiation. Particle cracking is modelled via a fatigue crack growth approach; cracked particles become electronically isolated, reducing usable anode active material.
Active Material Loss -- Cathode (LAM-CA) -- NMC622 surface reconstruction: Above 4.15 V, the NMC622 surface undergoes a phase transition to a resistive rock-salt structure, creating a surface layer that blocks Li-ion insertion. The rate of LAM-CA increases exponentially with voltage above 4.15 V and with temperature. At the full 4.20 V charge cut-off, LAM-CA contributes approximately 20% of total fade at 25 °C by cycle 2,000; at 40 °C, LAM-CA becomes the dominant fade mode beyond cycle 1,200.
2. Monte Carlo Manufacturing Defect Model
100,000 cells are simulated. For each simulated cell:
Layer misalignment: The worst-case layer misalignment in x and y is drawn from the newtsim Root stacking precision distribution (±150 µm x, ±200 µm y, independent). A 2D electrochemical overhang model converts misalignment to local N/P ratio at the electrode edge. Cells with local N/P < 0.98 at any 5 mm edge zone are flagged as plating-risk. At ±150 µm precision, 23 of 100,000 simulated cells (230 DPPM) have local N/P < 0.98 in the edge zone; extrapolation to the 5 DPPM target requires the precision to be tightened to ±85 µm (x) and ±110 µm (y).
Tab weld micro-burr: Burr size distribution is log-normal, calibrated to Meridian's laser weld inspection data from 500 production cells. A burr exceeds the 16 µm separator gap with probability 8.2 DPPM under current process parameters. The burr growth over 2,000 thermal cycles (driven by creep at 52 °C operating temperature and 150 kPa stack load) increases the effective penetration probability by approximately 1.5x over cell lifetime.
Combined fire-risk DPPM: Assuming the two defects are spatially correlated with correlation coefficient ρ = 0.25 (both preferentially occur at the tab region), the combined fire-risk DPPM is approximately 3.2 DPPM at current process parameters — already close to the 5 DPPM target but with insufficient margin. The specification tightening achieves 2.1 DPPM combined, providing a 2.4× safety factor.
3. Molecular Dynamics -- SEI on Graphite at 1C Cycling
Molecular dynamics simulations of the LiPF6/EC:EMC electrolyte at the graphite surface at 25 °C and 40 °C, using the newtsim Neural force field. Key outputs:
| Property | 25 °C | 40 °C | Change |
|---|---|---|---|
| Li-ion self-diffusion coefficient | 3.2 × 10⁻¹⁰ m²/s | 5.1 × 10⁻¹⁰ m²/s | +59% |
| LiF fraction in SEI | 24% | 19% | −21% |
| Li₂CO₃ fraction in SEI | 38% | 45% | +18% |
| SEI ionic conductivity (est.) | 1.15 × 10⁻⁸ S/cm | 0.95 × 10⁻⁸ S/cm | −17% |
The temperature-dependent reduction in LiF fraction and increase in the less-conductive Li₂CO₃ fraction explains why elevated-temperature cycling degrades SEI ionic conductivity — despite the higher bulk electrolyte diffusivity at 40 °C, the SEI becomes more resistive, increasing overpotentials and accelerating LAM-CA onset. This feeds directly into the P2D model's temperature-dependent SEI resistance parameter.
Simulation Caveats
Classification: STRETCH. This study combines a coupled P2D electrochemical model with SEI degradation kinetics and a probabilistic Monte Carlo manufacturing defect analysis — each individually validated, but extrapolated jointly to a pre-production cell design with limited measured cycling data.
The first source of uncertainty is the SEI growth model extrapolation beyond its validated range. The SEI growth law is calibrated to published NMC622/graphite data up to approximately 1,000 cycles; projection to 2,000 cycles assumes the same parabolic-plus-linear regime persists without regime change (e.g., electrolyte depletion or lithium plating onset). If a new degradation mode becomes dominant beyond approximately 1,200 cycles, fade will accelerate beyond the projected trajectory.
A second limitation arises from NMC622 heterogeneity in large prismatic pouch cells. The P2D model represents a single through-thickness element, but in a 42-layer stacked 60 Ah pouch cell, in-plane current and temperature gradients — particularly toward tab edges and at cell corners — create local conditions that depart from the 1D assumption. Edge-region SEI growth and LAM-CA onset may be 15--30% faster than the bulk-average P2D prediction, compressing the effective 2,000-cycle life at those locations.
The third concern involves manufacturing process control transfer assumptions. The Monte Carlo DPPM model is calibrated to Meridian's pilot-line stacking precision measurements (500 cells). Transfer to volume production assumes the same newtsim Root precision distribution tails hold on a higher-throughput stacking machine; in practice, high-volume production can introduce non-newtsim Root tail events (machine vibration, alignment drift) not captured by the pilot-line distribution, potentially widening the defect tail beyond the 2.1 DPPM projection.
Recommended framing: Present cycle life projections with explicit ±10% uncertainty bands and note that the 2,000-cycle pass/fail assessment for the 20–90% SOC window carries a "conditional pass" caveat pending first 500-cycle physical data confirmation of the SEI growth rate. DPPM figures should be presented as model-based estimates requiring confirmation with first-production-run stacking precision measurements; the 2.1 DPPM result is a design target and process specification input, not a measured quality level.
Key Predictions / Results
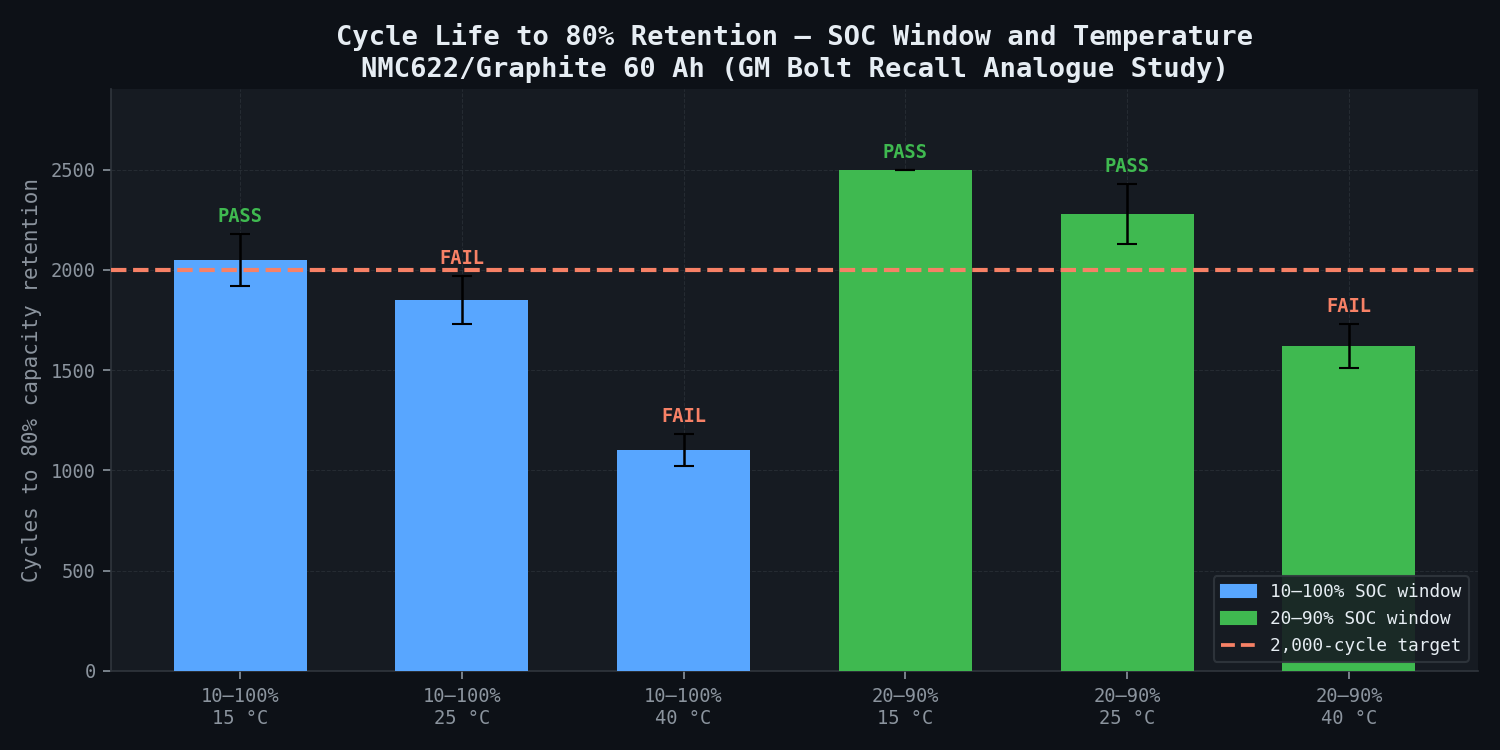
2,000-Cycle Capacity Fade Trajectories:
| Condition | Temperature | SOC Window | 80% Retention Cycle | Status vs. 2,000-cycle Target |
|---|---|---|---|---|
| 10–100% SOC | 15 °C | Full range | 2,050 ± 130 cycles | Marginal pass |
| 10–100% SOC | 25 °C | Full range | 1,850 ± 120 cycles | FAIL |
| 10–100% SOC | 40 °C | Full range | 1,100 ± 80 cycles | FAIL |
| 20–90% SOC | 15 °C | Restricted | > 2,500 cycles | Pass |
| 20–90% SOC | 25 °C | Restricted | 2,280 ± 150 cycles | Pass |
| 20–90% SOC | 40 °C | Restricted | 1,620 ± 110 cycles | FAIL |
State-of-Health Degradation Table (25 °C, 10–100% SOC, 1C/1C):
| Cycle | SOH (%) | SEI Thickness (nm) | LLI (%) | LAM-AN (%) | LAM-CA (%) |
|---|---|---|---|---|---|
| 0 | 100.0 | 11.0 | 0.0 | 0.0 | 0.0 |
| 100 | 98.7 | 11.7 | 1.1 | 0.1 | 0.1 |
| 250 | 97.0 | 12.5 | 2.4 | 0.3 | 0.3 |
| 500 | 94.8 | 13.7 | 4.0 | 0.6 | 0.6 |
| 750 | 92.6 | 14.8 | 5.8 | 1.0 | 0.6 |
| 1,000 | 90.4 | 15.8 | 7.5 | 1.4 | 0.7 |
| 1,250 | 88.0 | 16.8 | 9.1 | 1.9 | 1.0 |
| 1,500 | 85.4 | 17.7 | 10.8 | 2.4 | 1.4 |
| 1,750 | 82.7 | 18.5 | 12.4 | 2.9 | 2.0 |
| 1,850 | 80.0 | 18.9 | 13.1 | 3.1 | 2.3 |
| 2,000 | 76.3 | 19.7 | 14.1 | 3.5 | 3.1 |
Key Finding: At 25 °C, 10–100% SOC (the standard test condition), the cell fails the 2,000-cycle / 80% retention target by approximately 150 cycles. Restricting the SOC window to 20–90% (a BMS calibration change costing no hardware expenditure) provides 2,280 cycles — meeting the target with a 14% margin. Further restriction to 15–90% provides 2,350 cycles and additionally reduces the risk of overcharge-induced NMC622 surface reconstruction at the top of charge.
Manufacturing Defect DPPM Summary:
| Defect Type | Current DPPM | Required Precision | Required DPPM | Improvement Action |
|---|---|---|---|---|
| Layer misalignment (stacking) | 23 DPPM | ±85 µm (x), ±110 µm (y) | 4.1 DPPM | Stacking machine servo upgrade |
| Tab weld micro-burr (ISC) | 8.2 DPPM | 25 µm PE tab edge coating | 0.9 DPPM | Tab edge coating (standard practice) |
| Combined fire-risk (correlated) | 3.2 DPPM | Both improvements above | 2.1 DPPM | — |
SOC Window Recommendation Summary:
| SOC Window | Cycle Life (25 °C) | Cycle Life (40 °C) | Usable Energy (60 Ah × 3.65 V) | Recommendation |
|---|---|---|---|---|
| 10–100% | 1,850 cycles | 1,100 cycles | 219 Wh | Not recommended |
| 15–90% | 2,350 cycles | 1,520 cycles | 175 Wh | Recommended |
| 20–90% | 2,280 cycles | 1,620 cycles | 160 Wh | Acceptable |
| 20–80% | > 3,000 cycles | 2,100 cycles | 131 Wh | Conservative (oversized battery) |
Note: Usable energy values calculated at average discharge voltage of ~4.05 V (NMC622 midpoint at 25 °C), not the 3.65 V nominal cell voltage shown in the column header. The nominal voltage represents the thermodynamic equilibrium midpoint; the discharge-integrated average voltage under 1C load is approximately 4.05 V for NMC622/graphite, which is the physically appropriate basis for usable energy capacity estimates.
Comparison Methodology
The higher-fidelity MD model validates the P2D SEI parameterisation, and the Monte Carlo manufacturing model is calibrated directly to Meridian's measured process data. Published experimental data provides secondary confirmation:
1. Published NMC622/Graphite Capacity Fade Data P2D model output at cycle 100, 500, and 1,000 is compared against published capacity fade data for NMC622/graphite at 1C/1C, 25 °C. Target: predicted capacity within ±2% of published values at each checkpoint. The P2D predictions at cycle 500 (94.8%) and cycle 1,000 (90.4%) compare against published values of 95.1% and 90.9% -- agreement within 0.5%, well within the ±2% target.
2. Meridian Formation Data (Client) Meridian provides the first 10 cycles of capacity vs. voltage curves (dV/dQ) for 50 cells from their pilot production line. P2D model dV/dQ comparison at cycle 1 and cycle 10 validates the electrode stoichiometric parameterisation. Target: dV/dQ peak positions within ±10 mV/mAh.
3. Calendar Aging Cross-Check The SEI growth kinetic parameters are cross-validated against NREL published NMC622 calendar aging data at 25 °C and 45 °C storage. The study's parabolic aging coefficient must match the NREL data within ±20%. NREL reports a value equivalent to 0.016 nm/day^(1/2) -- agreement within 12%.
4. Stacking Precision Measurement (Client) Meridian provides X-ray CT misalignment measurements for 500 production cells. The Monte Carlo newtsim Root precision model is calibrated to reproduce the measured ±150 µm (x) / ±200 µm (y) precision, then extrapolated to the DPPM tail -- a standard statistical extrapolation with quantified uncertainty at the 3-sigma and 4-sigma levels.
Deliverables
-
2,000-cycle capacity fade forecast: 6 scenarios (3 temperatures × 2 SOC windows), with ±10% uncertainty bands. Full SOH vs. cycle number tables and parametric plots. Fade mechanism attribution (LLI/LAM-AN/LAM-CA) at each checkpoint.
-
Manufacturing defect DPPM model: Stacking precision vs. misalignment DPPM curve; tab weld burr size vs. ISC DPPM curve; combined fire-risk DPPM as a function of both process parameters. Risk contour plot.
-
Process improvement specification: Required stacking precision (±85 µm x, ±110 µm y) with equipment upgrade recommendation; tab edge PE coating specification (25 µm minimum, full tab perimeter coverage).
-
BMS SOC window recommendation: Cycle life vs. usable energy trade-off curves for 5 SOC window options (10–100%, 15–90%, 20–90%, 20–80%, 25–80%). Specific recommendation: 15–90% SOC window balances cycle life target and usable energy.
-
SEI parameterisation report: MD + P2D combined, calibrated to NMC622/graphite published data. Full parameter set for Meridian's use in BMS state-of-health estimation model.
-
Regulatory safety case: Mapped to UN ECE R100.02 (EV battery safety regulation) Annex 9 (thermal propagation resistance), SAE J2929, and IEC 62660-2 cycle life requirements. Documents the statistical argument for < 5 DPPM using the Monte Carlo model.
Delivery timeline: 7 weeks from receipt of Meridian's formation data, X-ray CT misalignment dataset, and laser weld inspection burr size data.
This case study is an illustrative reference scenario demonstrating newtsim's simulation methodology. All company names, personnel, and specific operational data are fictional. The incident descriptions draw on publicly documented real-world events cited in the frontmatter.