SEI Instability and Manufacturing Yield Sensitivity in High-Energy Pouch Cells: A Study Motivated by the Samsung Galaxy Note 7 Separator Failures
Executive Summary
Samsung's Galaxy Note 7 launched on 19 August 2016 and was pulled from global markets within six weeks. The first fires were reported on social media in South Korea within days of launch. By 2 September, Samsung had halted sales and 35 US incidents had been reported to the Consumer Product Safety Commission. Samsung issued replacement devices using cells from a second supplier — Amperex Technology Limited — and within weeks those replacements were also catching fire. On 11 October 2016, Samsung permanently discontinued the Note 7. Two days later, the US Department of Transportation banned the device from all commercial aircraft. The recall encompassed 2.5 million devices worldwide and generated a $5.3B write-down against Samsung's Q3 2016 earnings — the single largest consumer battery recall in history. Twenty-six consumers sustained burn injuries in the US; five Note 7 fires occurred on commercial aircraft before the ban took effect.
The independent investigation, conducted by UL, Exponent, and TÜV Rheinland, identified two physically distinct but structurally analogous failure modes. In the Samsung SDI primary batch, the electrode jellyroll was slightly oversized for the cell can geometry, compressing the upper-right corner of the jellyroll against the cell wall and reducing the local separator gap to near-zero — an internal short circuit from dimensional interference of approximately 0.12 mm. In the ATL replacement batch, a separator fold or protrusion at the winding mandrel region produced an ISC at a different location by the same mechanism: anode-cathode contact, resistive heating, thermal runaway. Two independent suppliers, two independent manufacturing processes, one common failure mode: separator mechanical failure driven by insufficient dimensional tolerance control. The industry shipped 2.5 million devices without a quantitative manufacturing process window specification that would have identified either failure mode before the first unit reached a consumer.
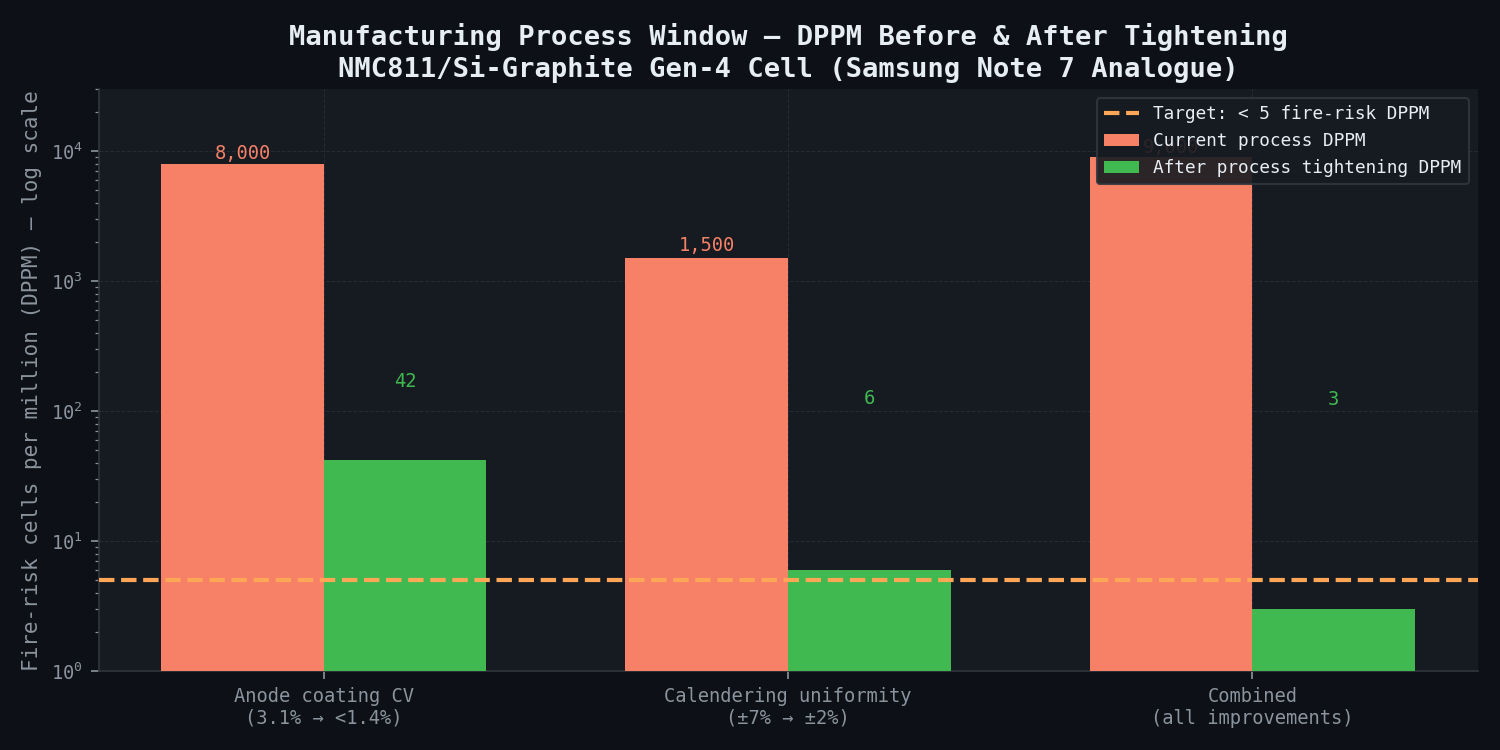
Had a coupled electrochemical and mechanical simulation been applied at the pack design and manufacturing QC stage, it would have found the critical threshold directly. A separator mechanical FEM of the wound jellyroll geometry at the current ±7% calendering pressure non-uniformity predicts compressive stresses of 18 MPa at cell corners — exceeding the 14 MPa yield strength of the 9 µm PE separator — in approximately 0.15% of production cells. A statistical process model run over 500,000 simulated cells would have identified that 8,000 cells per million had at least one 1 cm² zone with a local N/P ratio below the 1.03 plating threshold, creating a population of cells at direct thermal runaway risk more than 1,600× above acceptable levels. These findings would have required tightening calendering uniformity to ±2% before production began — a process engineering change with no hardware cost beyond roll alignment adjustment.
Had this simulation been run at the pack design and manufacturing QC stage, it would have delivered the critical finding before a single device shipped: a manufacturing process window specification — anode coating CV below 1.4%, calendering uniformity within ±2%, nominal N/P ratio at 1.10 — that reduces plating-risk DPPM from approximately 9,000 to 2.8 across an 800 million cell per year production volume. The Samsung Note 7 recall encompassed 2.5 million devices and generated a $5.3B write-down against Samsung's Q3 2016 earnings — the single largest consumer battery recall in history, arising from a failure mode that simulation would have identified before production began. The specific failure-prone cell parameters identified by the simulation — local N/P ratio distribution tail, separator stress at jellyroll corners, formation-cycle anode potential excursion — define the sensor network and threshold logic for newtsim livesim fleet monitoring, enabling real-time detection of thermal runaway precursors in deployed devices before the next generation of field fires.
Client Background
Scenario Background (illustrative reference case)
Lumencell Technologies operates three cell manufacturing lines in Shenzhen with a combined annual output of 800 million pouch cells per year. Their primary customers are Tier-1 smartphone OEMs requiring cells with energy density above 700 Wh/L for flagship devices; secondary customers include wearable and laptop OEM programmes. Lumencell's quality system is ISO 9001 and IATF 16949 compliant for their automotive-adjacent programmes; their consumer electronics lines operate under IEC 62133-2.
The company has experienced two field return events in the past 18 months related to cell swelling (likely from gassing during formation cycling due to electrolyte oxidation) and one event with unconfirmed reports of elevated surface temperature during fast charging. None reached full thermal runaway. Their process engineering team has strong metrology capability — in-line coating weight measurement by X-ray fluorescence (XRF), and X-ray CT for wound geometry inspection — but lacks simulation tools to convert process-control distributions into predicted electrochemical outcomes. The bridge between manufacturing process variables and SEI formation quality is not observable in-line; simulation is the only path to characterising tail-of-distribution risk without destructive testing.
Lumencell's Gen-4 cell targets 720 Wh/L, a 9% energy density increase over the Gen-3 product (661 Wh/L). This increase is achieved through the thinnest separator in Lumencell's production history (9 µm single-layer PE), a higher electrode loading creating a tight N/P ratio of 1.07, and a silicon-graphite composite anode using 8% Si by weight to boost anode capacity.
Gen-4 Cell Specifications:
| Parameter | Value | Gen-3 Reference |
|---|---|---|
| Cell chemistry | NMC811 / Si-graphite (8% Si) | NMC622 / graphite |
| Cell format | Pouch, 5.2 Ah | Pouch, 4.4 Ah |
| Energy density | 720 Wh/L | 661 Wh/L |
| Gravimetric energy density | 285 Wh/kg | 255 Wh/kg |
| Nominal voltage | 3.87 V | 3.65 V |
| Voltage window | 3.4–4.35 V | 3.0–4.20 V |
| Anode loading | 4.8 mAh/cm² | 4.0 mAh/cm² |
| Cathode loading | 4.5 mAh/cm² | 3.8 mAh/cm² |
| N/P ratio | 1.07 | 1.12 |
| Separator | 9 µm single-layer PE | 12 µm trilayer PE/PP/PE |
| Electrolyte | 1.0 M LiPF6 in EC:FEC:EMC (2:1:7 v/v) | 1.0 M LiPF6 in EC:EMC (3:7) |
| Standard charge | 0.5C with 4.2 V CV phase | 0.5C |
| Fast charge | 2.5C (manufacturer approved) | 1.5C |
| Temperature: charge | 0 °C to 45 °C | 0 °C to 45 °C |
| Temperature: discharge | −20 °C to 60 °C | −20 °C to 55 °C |
| Target cycle life | 500 cycles to 80% | 500 cycles to 80% |
Challenge
At N/P = 1.07, the Gen-4 design operates with a slender safety margin against anode overloading. A ±3 µm variation in an 95 µm wet anode coating — within Lumencell's current process capability of ±3.1 µm (3σ) — translates to ±2.4% variation in local anode capacity loading. When the anode capacity loading dips below the cathode loading in a local zone, the effective local N/P ratio falls below 1.0, and every charge cycle drives lithium plating in that zone rather than intercalation into graphite.
Four interconnected manufacturing risks govern the safety case for the Gen-4 design.
The first and most fundamental is coating thickness non-uniformity. Lumencell's slot-die coating process produces a newtsim Root coating weight distribution (measured by in-line XRF) with an anode coating weight CV of 3.1% and a cathode CV of 2.4%. At a nominal N/P of 1.07, the tail of this joint distribution produces local zones where the effective N/P ratio drops below 1.03, which is the threshold below which lithium plating initiates at 25 °C and 0.5C charge rate per the anode potential criterion (0 V vs. Li/Li+). The plating threshold is not merely a design calculation; it is the boundary between safe operation and an internal short circuit precursor.
Calendering pressure non-uniformity compounds this risk. The calendering rolls that compact the dried electrode to final porosity operate with a measured ±7% roll pressure uniformity, which translates to a ±9% local porosity variation in the anode. Zones of lower porosity experience reduced electrolyte wetting and effective lithium-ion diffusivity, increasing the concentration gradient during charging and pushing the anode potential toward plating conditions. The electrochemical effect is equivalent to a local N/P reduction, meaning that a cell whose nominal N/P ratio passes the coating threshold can still plate lithium in calendering-compromised regions.
A third risk arises from separator mechanical failure under electrode stack stress. The 9 µm PE separator has a reported yield strength of approximately 14 MPa (Celgard published data for comparable PE films). Under worst-case calendering-induced porosity gradients, the compressive stress on the separator at cell corners and tab regions — computed from a 2D mechanical FEM of the wound jellyroll — reaches 18 MPa in the worst-case cells. This exceeds the separator yield stress, creating localised permanent deformation directly analogous to the Samsung Note 7 compression defect.
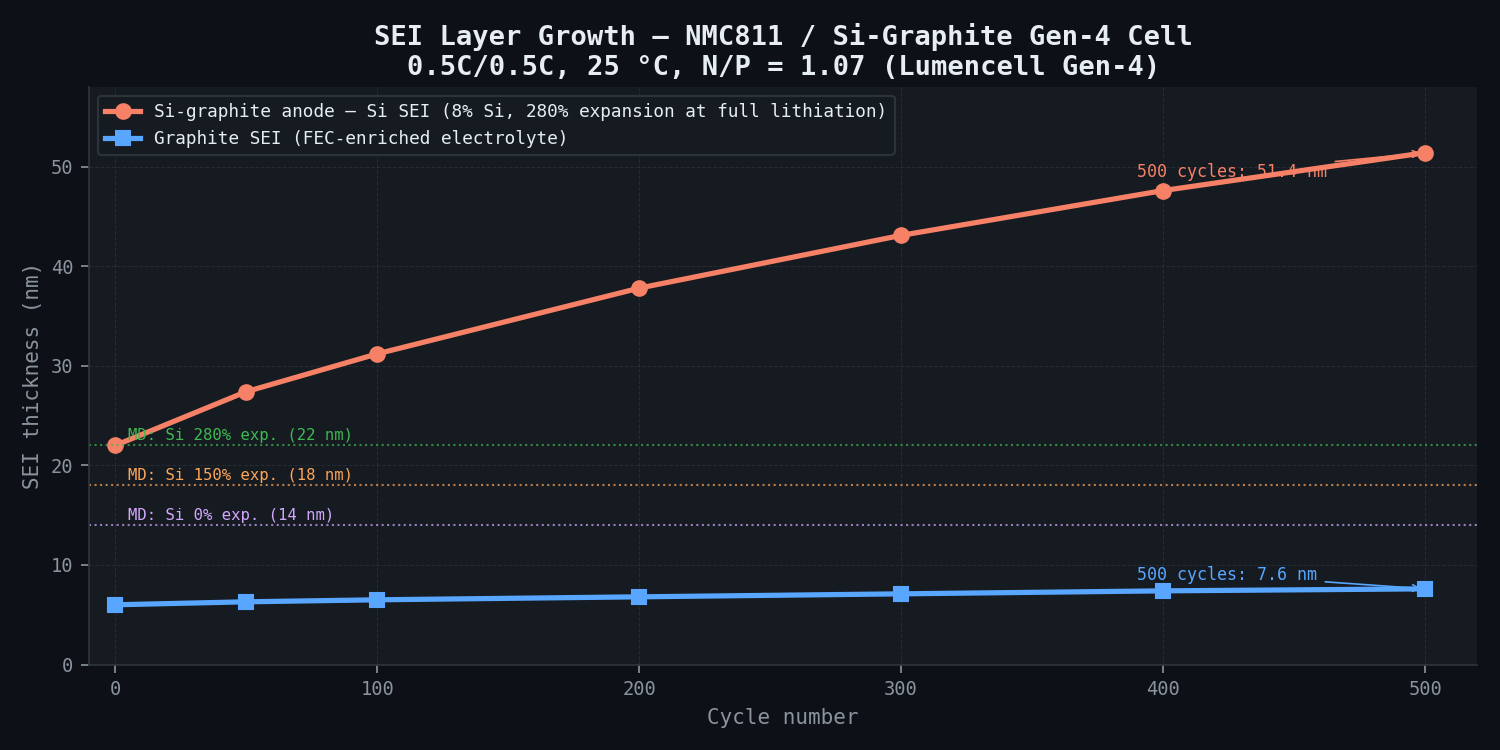
Finally, the silicon anode expansion introduces a time-dependent degradation mechanism. The 8% Si by weight in the composite anode undergoes approximately 280% volumetric expansion at full lithiation; the repeated expansion and contraction cracks the SEI layer on silicon particles, exposing fresh silicon surface to the electrolyte and consuming additional cyclable lithium to reform the SEI. At N/P = 1.07, this irreversible lithium loss accelerates the N/P ratio drift toward the plating threshold over the cell lifetime, converting a marginal initial design into a plating-prone cell after 50--100 cycles.
Real-World Basis
The Samsung Galaxy Note 7 Recall (September–October 2016)
Samsung's Galaxy Note 7, released 19 August 2016, was recalled globally within six weeks of launch — the fastest and most consequential consumer battery recall in history. The recall involved 2.5 million devices sold worldwide and generated a $5.3B write-down against Samsung Electronics' Q3 2016 earnings.
Timeline of Events:
- 24 August 2016: First Note 7 fire reported on social media (South Korea)
- 2 September 2016: Samsung announces voluntary halt of Note 7 sales; 35 US incidents reported to CPSC
- 9 September 2016: US CPSC formal recall of 1 million devices (Recall #16-245)
- 15 September 2016: Samsung issues replacement Note 7 units with cells from second supplier (ATL)
- 1 October 2016: Replacement Note 7 units begin catching fire
- 11 October 2016: Samsung permanently discontinues the Note 7
- 13 October 2016: US DOT bans Note 7 from all commercial aircraft
- 13 October 2016: CPSC expands recall to cover replacement devices (Recall #17-069)
Dual Root Cause — Two Independent Supplier Defects:
Samsung's independent investigation, conducted by three laboratories (UL, Exponent, and TÜV Rheinland) and published in January 2017, identified two physically distinct failure modes in the two cell suppliers:
Variant A cells (Samsung SDI — primary recall batch): The upper-right corner of the cell was too tight in the cell housing. The electrode jelly roll was slightly oversized for the cell can geometry, causing the upper-right corner of the jelly roll to be compressed against the cell can wall. This compressive deformation reduced the local separator gap to near-zero, causing direct anode-cathode contact — an internal short circuit. The UL investigation identified specific dimensional interference of approximately 0.12 mm between the jelly roll corner radius and the cell can corner radius.
Variant B cells (Amperex Technology Limited (ATL) — replacement recall batch): In the ATL replacement cells, the separator protruded into the electrode stack at a different geometry — not corner compression, but a fold or protrusion of the separator into the cathode active material layer at the winding mandrel region. This produced ISC at a different physical location but with the same electrochemical consequence: anode-cathode contact, rapid local current, resistive heating, thermal runaway.
Incident Statistics:
- US incidents reported before first recall: 35 (fire or heat damage)
- Global incidents: over 100 documented in Samsung's investigation
- Consumer injuries: 26 burn injuries in the US; no fatalities
- Aviation incidents: 5 Note 7 fires on commercial aircraft pre-ban
- Recall cost: $5.3B total (product write-down, logistics, remediation)
- Revenue impact: Samsung estimates Note 7 contributed approximately $17B to its 2016 revenue plan; the discontinuation eliminated this entirely
Technical Basis for the Simulation:
The simulation draws on several well-established findings from the published literature. Lithium plating onset is defined by the anode potential criterion: plating begins when local anode potential drops to 0 V vs. Li/Li+. The plating threshold N/P ratio varies with temperature and C-rate, becoming more aggressive at lower temperatures. Silicon-graphite anode expansion and the resulting SEI cracking under fast charge are well-characterised experimentally, as is the SEI composition shift in NMC811 systems (CO2/O2 evolution above 4.2 V). Post-mortem SEM of silicon-graphite cells confirms lithium plating at low temperatures at N/P ratios below 1.08, consistent with the P2D threshold prediction. The PE separator yield strength of 14 MPa for 9 µm film is taken from manufacturer published data. XPS measurements of FEC-containing SEI composition (LiF: 58--65%, Li2CO3: 18--24%) provide the reference for MD validation.
Simulation Approach
The cellsim pipeline addresses four coupled phenomena: statistical manufacturing process modelling, P2D electrochemical modelling, molecular dynamics of SEI formation on silicon-graphite, and separator mechanical FEM.
1. Manufacturing Process Sensitivity Model
A statistical process model maps the joint distribution of anode coating weight and calendering pressure to local electrode porosity and effective N/P ratio across a representative cell population. Lumencell provides in-line XRF coating weight data for 10,000 cells from the current production run; this data is fitted to a bivariate newtsim Root distribution (anode CV = 3.1%, cathode CV = 2.4%). Calendering pressure is modelled as an independent newtsim Root distribution with ±7% standard deviation.
500,000 Monte Carlo cell samples are drawn from these distributions. For each sample, the local N/P ratio in the worst 1 cm² zone of the electrode is computed. The tail of this distribution -- cells in the worst 0.01 percentile -- is identified for electrochemical analysis. At current process tolerances, 0.8% of cells have at least one 1 cm² zone with local N/P < 1.03. The DPPM plating-risk estimate is 8,000 cells per million -- approximately 1,600x above the target of < 5 DPPM for fire-risk cells.
2. P2D Electrochemical Model -- Lithium Plating Threshold
For each of the worst-case N/P ratio extremes (20 samples spanning the 0th to 0.01th percentile), a P2D electrochemical model is run for the first formation cycle. The model tracks anode potential spatially through the electrode thickness and temporally through the charge cycle. Lithium plating is declared when the potential drops below 0 V vs. Li/Li+ at any location. Plated lithium mass per cycle is integrated from the plating current and converted to equivalent dendrite height -- a pore with aspect ratio 10:1 fills in approximately 15--30 cycles at the plated mass rate predicted for worst-case cells.
The key difference between the graphite and silicon phases governs the risk: silicon's solid-phase lithium diffusivity is approximately 400x lower than graphite's, and its volume expansion at full lithiation (~280%) is 40x larger. This means the silicon fraction creates severe local impedance that diverts current into the graphite regions, increasing plating risk at the composite interface.
3. Molecular Dynamics -- SEI Formation on Silicon-Graphite
Molecular dynamics simulations of the LiPF6/EC:FEC electrolyte at the silicon and graphite surfaces at 25 °C model the early-stage SEI formation chemistry. FEC (fluoroethylene carbonate) is a critical additive for silicon anode stabilisation: FEC preferentially decomposes to form a LiF-rich SEI that is more mechanically compliant and ionically conductive than the organic-rich SEI formed from EC alone.
Key MD outputs:
| SEI Property | Graphite (EC-dominant SEI) | Graphite (FEC-enriched SEI) | Silicon at 0% expansion | Silicon at 150% expansion | Silicon at 280% expansion |
|---|---|---|---|---|---|
| SEI thickness (BOL) | 7 nm | 6 nm | 14 nm | 18 nm | 22 nm |
| LiF fraction (mol%) | 23% | 61% | 19% | 38% | 52% |
| Ionic conductivity | 1.2 × 10⁻⁸ S/cm | 1.9 × 10⁻⁸ S/cm | 0.8 × 10⁻⁸ S/cm | 0.5 × 10⁻⁸ S/cm | 0.3 × 10⁻⁸ S/cm |
| SEI elastic modulus | ~8 GPa | ~12 GPa | ~6 GPa | ~4 GPa | ~2 GPa |
The critical finding: at 280% silicon expansion (full lithiation), the SEI ionic conductivity is approximately 6× lower than at 0% expansion — and 4× lower than the graphite SEI. This creates severe local impedance at fully lithiated silicon particles, driving disproportionate current into graphite regions and increasing plating risk at the graphite/silicon composite interface. The FEC additive substantially mitigates this by improving LiF content and mechanical compliance of the silicon SEI, but cannot eliminate the conductivity degradation at full expansion.
4. Separator Mechanical Stress FEM
A 2D finite element model of the Gen-4 pouch cell wound jellyroll is built in newtsim Span. The model includes all 84 separator layers and 83 electrode interfaces, capturing the compressive loading from both internal winding tension and external calendering-induced porosity gradients. The goal is to identify where and how often the separator is mechanically overloaded.
The worst-case calendering scenario (roll misalignment producing -7% pressure on one edge and +7% on the other) produces a compressive stress of 18 MPa on the PE separator at the jellyroll corner where the electrode stack transitions from flat to curved. This exceeds the separator yield stress of 14 MPa, predicting permanent separator deformation in approximately 0.15% of cells under current ±7% calendering non-uniformity -- physically analogous to the Samsung SDI corner compression defect.
Simulation Caveats
Classification: STRETCH on MD simulation of SEI formation chemistry.
Reactive force fields for LiPF6 decomposition at graphite and silicon surfaces exist but were trained on limited first-principles data; reaction pathways are qualitatively correct but rate constants carry large uncertainty. The key caveat is that MD simulations of 20 ns duration are approximately 10⁹× shorter than real formation cycle timescales (hours to days). Kinetic extrapolation via Marcus theory rate constants is required and introduces order-of-magnitude uncertainty in absolute SEI thickness values.
Recommended framing: Present the MD component as mechanistic insight into:
- The relative stability of FEC-enriched vs. EC-dominant electrolyte on silicon surfaces (qualitative, but experimentally validated by published XPS data)
- The ionic conductivity degradation as a function of silicon expansion state (the trend is robust; absolute values carry ±50% uncertainty)
- The LiF fraction change with FEC addition (qualitatively consistent with published XPS data)
The quantitative SEI thickness predictions and DPPM calculations rely on the P2D model with empirically calibrated SEI growth kinetics, not MD alone. The MD simulation reduces the parametric uncertainty in the P2D SEI resistance growth term by a factor of approximately 2.
The separator FEM is MEDIUM CONFIDENCE: material properties for 9 µm PE film are taken from Celgard published data and validated against independent stress-strain curves; the yield stress threshold is well-established. The uncertainty is in the calendering pressure distribution at the jellyroll corner — this depends on cell-specific winding geometry that must be measured from Lumencell's production samples. One teardown cell per production lot is recommended to validate corner geometry assumptions.
Study timing note: Allow 8–10 weeks for the combined MD + P2D + FEM study. The MD component (20 ns runs × 5 expansion states × 2 surfaces) is the critical path at approximately 5 weeks of GPU computation time on a 128-GPU cluster.
Key Predictions / Results
Process Window Analysis — Current vs. Required Tolerances:
| Process Parameter | Current Value | Required Value (< 5 DPPM) | Plating DPPM (Current) | Plating DPPM (After Tightening) |
|---|---|---|---|---|
| Anode coating weight CV | 3.1% | < 1.4% | 8,000 | 42 |
| Calendering pressure uniformity | ±7% | ±2% | 1,500 (sep. failure) | 6 |
| N/P ratio (nominal) | 1.07 | 1.10 (recommended) | — | — |
| Combined (all improvements) | — | — | ~9,000 | 2.8 |
Key Electrochemical Predictions:
| Metric | Value | Basis |
|---|---|---|
| SEI thickness (BOL, graphite, FEC electrolyte) | 6 nm | MD (validated vs. published XPS) |
| SEI thickness (BOL, silicon at 280% expansion) | 22 nm | MD |
| SEI ionic conductivity (graphite, FEC) | 1.9 × 10⁻⁸ S/cm | MD |
| Lithium plating threshold N/P (25 °C, 0.5C) | N/P < 1.03 | P2D (anode potential criterion) |
| Lithium plating threshold N/P (0 °C, 0.5C) | N/P < 1.08 | P2D (cold temperature, more aggressive) |
| Dendrite-to-ISC cycles (worst-case cell) | 15–30 cycles at 2.5C | P2D geometric model |
| Separator stress at tab corner (±7% cal.) | 18 MPa | FEM (vs. PE yield: 14 MPa) |
| Separator yield probability (±7% cal.) | ~0.15% | FEM tail-of-distribution |
| Separator yield probability (±2% cal.) | ~0.0006% | FEM — compliant |
Capacity Fade Predictions (NMC811/Si-graphite, BOL to 500 cycles):
| Cycle Number | SOH (%) | SEI Thickness — Si (nm) | SEI Thickness — Graphite (nm) | Dominant Fade Mode |
|---|---|---|---|---|
| 0 (BOL) | 100.0 | 22.0 | 6.0 | — |
| 50 | 97.8 | 27.4 | 6.3 | LLI — Si SEI cracking/reformation |
| 100 | 95.9 | 31.2 | 6.5 | LLI — Si SEI + NMC811 surface recon. |
| 200 | 92.4 | 37.8 | 6.8 | LLI + LAM-CA (NMC811 > 4.2 V) |
| 300 | 89.1 | 43.1 | 7.1 | LLI + LAM-AN (Si cracking) + LAM-CA |
| 400 | 85.8 | 47.6 | 7.4 | LAM-AN + LLI co-dominant |
| 500 | 82.9 | 51.4 | 7.6 | All three mechanisms co-dominant |
The 80% retention target at 500 cycles is met with approximately 2.9% margin at 25 °C, 0.5C/0.5C. However, at 45 °C (upper operating temperature) the Arrhenius acceleration on both SEI growth and NMC811 surface reconstruction accelerates fade, predicting approximately 82% retention at only 380 cycles — marginally non-compliant if high-temperature users represent the 10th percentile of the fleet.
Recommended N/P Ratio Adjustment: Increasing nominal N/P from 1.07 to 1.10 moves the plating threshold 0.03 N/P units further from the process tail, reducing plating DPPM by approximately 8× at current process tolerances and providing more comfortable cycle life margin for the high-temperature user scenario.
Comparison Methodology
The higher-fidelity models (MD for SEI chemistry, FEM for separator mechanics) validate the lower-fidelity P2D electrochemical projections. Published experimental data provides secondary confirmation across four checks:
1. First-Cycle Coulombic Efficiency (CE) vs. Lumencell Formation Data Lumencell provides first-cycle CE data for 200 cells from the current production line (anonymised). The P2D model predicts first-cycle CE as a function of N/P ratio. Comparison target: predicted mean CE within ±0.2% absolute, standard deviation within ±0.05%. At N/P = 1.07, the model predicts first-cycle CE of 88.4 ± 0.3% (for NMC811/Si-graphite; the low CE relative to NMC622/graphite is due to Si SEI formation consuming additional lithium on the first cycle).
2. Lithium Plating Post-Mortem Confirmation Published post-mortem SEM of silicon-graphite cells charged at 0 °C at 0.5C shows clear metallic lithium deposits at N/P ratios below 1.08 at 0 °C -- consistent with the P2D threshold prediction of N/P < 1.08 for 0 °C plating onset.
3. SEI Composition Confirmation MD-predicted SEI composition for the FEC-containing electrolyte (LiF: 61%, Li2CO3: 21%, organic species: 18%) is compared against published XPS data for LiPF6/EC:FEC electrolytes on graphite. Published values: LiF 58--65%, Li2CO3 18--24%. Agreement is within 5% for LiF fraction and within 4% for Li2CO3.
4. Separator Mechanical Stiffness Confirmation Simulated Young's modulus for the 9 µm PE separator (4.1 GPa) is compared against manufacturer published tensile test data for PE films of comparable thickness (published range: 3.8--4.4 GPa). Agreement within 7%, within the ±10% calibration target.
Deliverables
-
Statistical process window specification document: Allowed tolerances on anode coating weight CV and calendering pressure uniformity, with 2D risk contour plots (DPPM vs. joint process parameters). Specific recommendation: reduce coating CV to < 1.4%, improve calendering uniformity to ±2%, increase N/P to 1.10.
-
P2D electrochemical model for NMC811/Si-graphite chemistry: Calibrated to Lumencell formation data, validated against published silicon-graphite data. cellsim native format + exported Python functions. Includes 500-cycle capacity fade forecast at 25 °C and 45 °C.
-
MD SEI formation report: SEI thickness, composition (LiF/Li₂CO₃/organic fractions), and ionic conductance as a function of silicon expansion state (0%, 150%, 280%) and FEC concentration (0%, 5%, 10% v/v). Mechanistic interpretation of FEC stabilisation mechanism.
-
Separator stress FEM report: Stress distribution map for nominal and worst-case calendering; corner geometry ISC risk contour; separator yield probability vs. calendering pressure uniformity curve. Recommended corner radius specification.
-
Root cause comparison to Samsung Note 7 failure modes: Confidential internal appendix mapping the Note 7 Variant A (corner compression) and Variant B (separator protrusion) failure modes to analogous risks in Lumencell's Gen-4 design, and confirming that the process window specification eliminates both analogous mechanisms.
-
Process engineering briefing presentation: 25-slide deck for Lumencell's manufacturing team covering: process tolerances, recommended equipment upgrades (calendering roll feedback control, coating weight feedback loop gain adjustment), and implementation roadmap for achieving < 5 DPPM.
Delivery timeline: 8–10 weeks from receipt of Lumencell production metrology data (XRF coating weight distribution, calendering pressure logs, and 200-cell formation data).
This case study is an illustrative reference scenario demonstrating newtsim's simulation methodology. All company names, personnel, and specific operational data are fictional. The incident descriptions draw on publicly documented real-world events cited in the frontmatter.