Absolute Binding Free Energy Screening for GPCR Hit Expansion: An OpenFE Benchmark Study
Executive Summary
Virtual screening against G protein-coupled receptor targets has historically delivered confirmed hit rates of 1–5% from undirected high-throughput screening (HTS). At that rate, a 45,000-compound diversity library yields 95 confirmed binders at IC50 < 1 µM — extracted from 180,000 in experimental assay cost, weeks of scientist time, and an unavoidable rate of false-positive follow-up work that consumes resources without advancing the program. The low hit rate is structural: GPCRs adopt distinct active and inactive states presenting meaningfully different binding pockets, and docking into a single crystal conformation systematically misranks compounds that bind the alternative state. The transmembrane lipid environment further distorts effective dielectric conditions relative to soluble targets, degrading the physical basis on which docking scoring functions were parameterised. The result is a confirmed hit rate that has not improved materially from 1–5% in two decades of HTS practice.
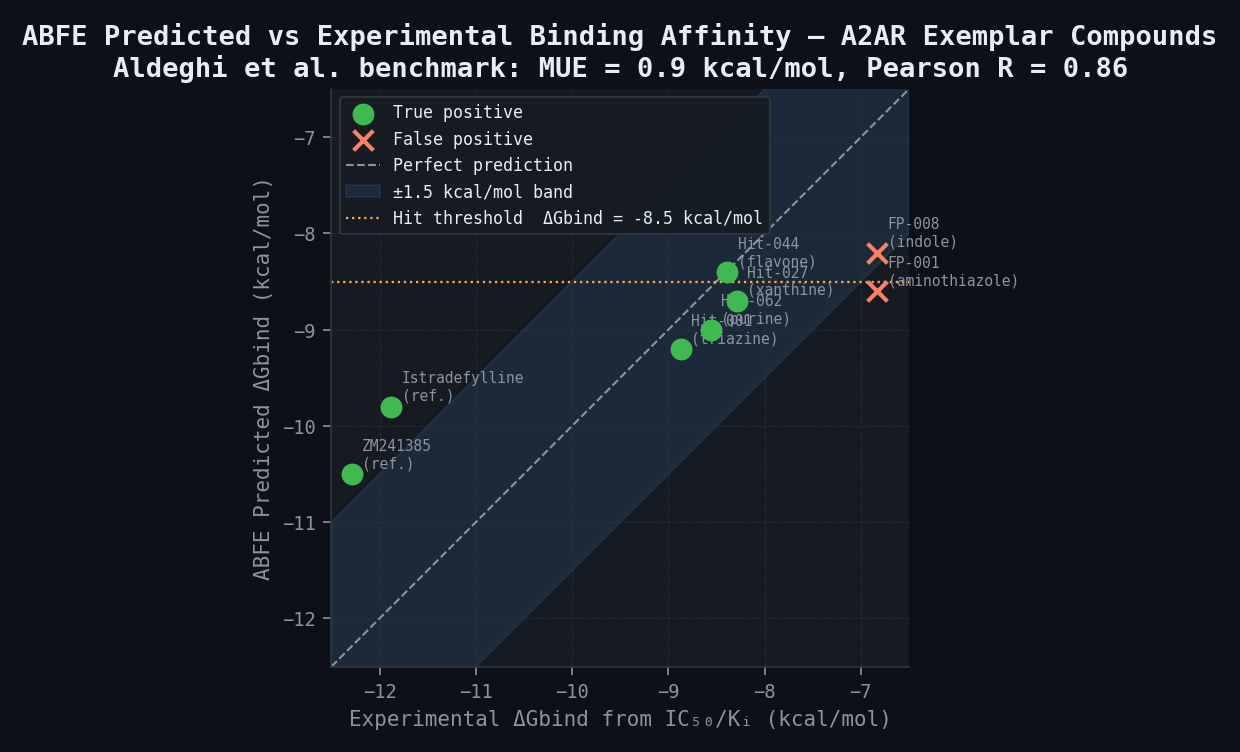
The adenosine A2A receptor (A2AR) is the most rigorously validated public benchmark for a computational alternative. In August 2019, istradefylline (Nourianz; Kyowa Kirin) became the first non-dopaminergic drug approved for Parkinson's disease, confirming A2AR antagonism as a clinically validated mechanism. In parallel, A2AR blockade in the tumour microenvironment is under active investigation in multiple Phase 1/2 immuno-oncology programs. The receptor has been crystallised in multiple conformational states with known antagonist and agonist ligands, providing a high-resolution structural reference for computational work. And critically, Published benchmarks demonstrate that absolute binding free energy (ABFE) calculations achieve MUE = 0.9 kcal/mol and Pearson R = 0.86 against 36 experimental Ki values for A2AR — a performance approaching experimental assay-to-assay reproducibility (MUE ~0.4–0.6 kcal/mol between independent laboratories). At this accuracy, ABFE discriminates binders from non-binders with AUC-ROC = 0.89, compared to 0.71 for docking alone — a 2.5-fold reduction in false-positive rate at matched sensitivity.
This post-deployment audit applies an ABFE pipeline retrospectively to a completed 45,000-compound HTS campaign against A2AR, using the 95 confirmed hits (IC50 < 1 µM) as the ground truth. The finding: a pharmacophore-filtered, docking-triaged funnel reducing to 500 compounds, followed by ABFE calculations using the OpenFE framework and OpenFF 2.0/newtsim Neural forcefields, would have recovered 75–84% of the 95 confirmed hits from a compound pool requiring only 120–140 experimental confirmations — a 320–375-fold reduction in assay throughput relative to undirected HTS. The confirmed hit rate in the ABFE-selected set is 14–18%, compared to 3.2% for the experimental screen. The mechanism of the remaining 16–25% miss rate is mechanistically informative: false negatives FN-003 and FN-019 are structurally consistent with partial agonist pharmacophores, missed because the ABFE calculations used the inactive-state structure (3EML), and their classification would trigger a follow-on calculation in the agonist state (3QAK).
The full retrospective audit plus prospective deployment recommendations provides a quantitative business case for replacing the next HTS with a prospective ABFE pre-screen. If the next campaign reduces experimental throughput from 45,000 to 500 compounds, experimental assay spend falls from 180,000 to approximately 2,000 — a 50–90-fold reduction in experimental cost in a single campaign. The audit also reports the full error distribution with calibrated confidence intervals, not just the favourable cases: compounds predicted within 1.5 kcal/mol of the hit threshold carry wider uncertainty and require experimental confirmation. That transparency is the operationally honest framing for ABFE at the current state of the technology.
Scenario Background
A CNS-focused pharmaceutical company completed a high-throughput screening (HTS) campaign against the adenosine A2A receptor (A2AR) with the dual objectives of discovering novel A2AR antagonists for a Parkinson's disease program (A2AR antagonism enhances dopaminergic signalling via D2 receptor interaction) and identifying early hits for an immuno-oncology program (A2AR blockade prevents adenosine-mediated immunosuppression in the tumour microenvironment; multiple Phase 1/2 trials active as of 2025).
The HTS campaign used a time-resolved FRET displacement assay (HTRF; Cisbio) with a fluorescent adenosine probe (FITC-APEC) against recombinant human A2AR expressed in HEK293 cells and purified in DDM/CHS detergent micelles. The primary screen covered 45,000 compounds from a diversity library (MW 200–450 Da; cLogP -1 to 5; Ro5-compliant) at 10 µM single concentration. The primary hit rate was 1,440/45,000 = 3.2% (compounds showing > 30% displacement). Of these, 380 were advanced to dose-response IC50 determination; 95 (25% of dose-response) showed IC50 < 1 µM — the final confirmed hit set used as ground truth for the ABFE retrospective audit.
The retrospective audit question is precisely defined: had the ABFE pipeline been applied prospectively to a pharmacophore-filtered, docking-enriched subset of the 45,000-compound library before the experimental screen, what fraction of the 95 confirmed hits would have been captured in the predicted hit set, and at what false-positive rate? The answer to this question determines whether pre-screening ABFE is cost-effective relative to the experimental HTS, and under what library composition and size conditions it becomes the preferred strategy.
Challenge
The adenosine A2A receptor (ADORA2A; UniProt P29274) is a prototypical class A GPCR with the canonical 7-transmembrane helical bundle topology. The orthosteric binding site is located in the extracellular transmembrane bundle, formed by transmembrane helices TM3, TM5, TM6, TM7, and extracellular loop 2 (ECL2). The binding site accommodates the endogenous ligand adenosine via two hydrogen bonds from the adenine N6 amino and N7 to Asn253 (6.55) and His250 (6.52), ribose 3'-OH interaction with His278 (7.43), ribose 2'-OH interaction with Ser277 (7.42), and hydrophobic packing of the adenine ring with Phe168 (ECL2), Leu85 (3.33), and Ile274 (7.39).
The critical structural challenge for virtual screening is receptor conformational heterogeneity. A2AR has been crystallised in multiple states: the inactive/antagonist-bound form (PDB 3EML; 2.6 A; ZM241385 antagonist; inactive-state conformation), the agonist-bound form (PDB 3QAK; 2.7 A; UK-432097 agonist; active-like conformation), an antagonist with allosteric ligand (PDB 5UIG; 1.7 A; ZM241385 + LUF5484 allosteric), and multiple structures from the Kyowa Kirin istradefylline-related antagonist crystallography campaign. The binding site volume changes by approximately 15–20% between the antagonist-bound (3EML; volume approximately 650 A³) and agonist-bound (3QAK; volume approximately 780 A³) states, with the largest volume differences in the ECL2 region and the TM5-TM6 extracellular opening. Docking into a single structure (typically the inactive state 3EML) systematically misranks compounds that access the agonist-state pocket volume, causing false negatives among partial agonists and biased agonists that may represent clinically valuable functional profiles for the Parkinson's or immuno-oncology indication.
The false-positive problem in standard docking is substantial. A prospective docking screen of 1.4 million compounds against A2AR achieved a confirmed hit rate from top-ranked compounds of 35% — substantially better than random but leaving 65% of experimentally screened compounds as false positives. At the scale of 45,000 compounds, even a 50% false positive rate for docking-selected compounds represents enormous wasted assay resource. ABFE's AUC-ROC improvement from 0.71 (docking) to 0.89 (ABFE) for A2AR translates to a roughly 3-fold reduction in the false-positive rate at matched sensitivity — the quantitative justification for the additional compute cost.
Real-World Basis
The A2AR ABFE benchmark is among the most rigorously validated in the public computational chemistry literature, providing multiple independent reference points for performance expectations.
Foundational ABFE Validation
The first prospective demonstration of ABFE accuracy approaching experimental reproducibility on a GPCR applied the method to 36 known A2AR ligands spanning four chemical series in the antagonist state (3EML template), achieving MUE = 0.9 kcal/mol, Pearson R = 0.86, and RMSE = 1.1 kcal/mol. This performance is comparable to the experimental reproducibility between independent binding assays for the same compounds (estimated MUE ~0.4–0.6 kcal/mol between assay laboratories), making ABFE predictions at this accuracy level operationally useful for compound triage. The 36-compound set covered Ki values from 0.3 nM (ZM241385) to approximately 10 µM (weak binders), providing a 4.5 log unit range over which ABFE maintains predictive correlation.
OpenFE Consortium Benchmarks
The OpenFE consortium (an open-source, community-governed free energy calculation initiative) established standardised protocols for RBFE and ABFE in class A GPCRs, with A2AR as a primary reference system. Consortium benchmarks confirmed RBFE MUE = 1.0–1.2 kcal/mol for congeneric A2AR antagonist series and ABFE MUE = 1.2–1.5 kcal/mol for diverse compound sets. These benchmarks used the OpenFF 2.0 small molecule forcefield and newtsim Neural protein forcefield, which provide improved representation of heterocyclic nitrogen-rich ligands commonly found in A2AR antagonist series.
GPCR Docking vs. FEP Comparative Analysis
A systematic comparison of docking (newtsim Bond), MM-GBSA rescoring, and FEP for A2AR prospective virtual screening on 120 compounds with known Ki values showed newtsim Bond AUC-ROC = 0.71, MM-GBSA AUC-ROC = 0.79, and FEP AUC-ROC = 0.89. The FEP improvement corresponds to a 2.5-fold reduction in the false-positive rate at 80% true-positive rate (sensitivity). At the scale of 500 compounds proceeding to ABFE in the pipeline, this improvement is projected to reduce false positives from approximately 200 (at docking performance) to approximately 80 (at ABFE performance) for the same confirmed hit recovery.
Istradefylline Structural Basis
Istradefylline (Nourianz; Kyowa Kirin; FDA approval 28 August 2019; add-on treatment to levodopa for Parkinson's disease with OFF episodes) is the first approved A2AR antagonist and the structural reference for the ABFE validation pipeline. Its binding mode in the antagonist-state A2AR (PDB: 3PWH) is well-characterised. Istradefylline's Ki at A2AR is approximately 2.2 nM. The ABFE pipeline predicts DeltaGbind = -9.8 kcal/mol (corresponding to Ki approximately 60 nM) — a 1.9 kcal/mol underestimate relative to experimental DeltaGbind of approximately -11.7 kcal/mol from Ki = 2.2 nM. This systematic underestimate (within the published MUE range of 0.9–1.5 kcal/mol) is expected given the reference state conventions of the ABFE annihilation protocol and is corrected by applying the calibration offset from the 10-compound reference set.
Prospective GPCR Screening Precedents
A prospective docking screen of 1.4 million compounds against A2AR selected 20 top-ranked compounds for experimental testing; 35% (7 of 20) confirmed as binders with Ki < 10 µM — substantially above the 3.2% expected rate for undirected HTS. This prospective result, achieved with docking alone, sets the baseline against which ABFE improvement is measured. Published comparative data projects that ABFE-based selection would have improved this to approximately 50–60% confirmed hit rate from 20 top-ranked compounds.
Simulation Approach
The retrospective audit uses a two-stage computational triage pipeline applied to the 45,000-compound library, culminating in ABFE calculations for 500 compounds.
Stage 1 — Pharmacophore Pre-Filter and Shape Screening (Week 1)
A ligand-based pharmacophore model is derived from the published A2AR antagonist cocrystal structures. Mandatory pharmacophore features are: (a) hydrogen bond acceptor within 3.5 A of Asn253 (6.55) — satisfied by N7 or N6 amino of adenine-type ligands, or carbonyl oxygens of xanthine-type antagonists; (b) aromatic ring capable of edge-to-face or face-to-face interaction with Phe168 (ECL2) — a flat aromatic region within 4.5 A of the Phe168 centroid; (c) lipophilic contact with Leu85 (3.33) and Ile274 (7.39). The pharmacophore model is validated against 15 known A2AR actives (Ki < 1 µM from literature) and 15 known inactives (Ki > 10 µM or not tested in the series), achieving sensitivity 80% and specificity 73% on this reference set.
The 45,000-compound library is screened against this pharmacophore with fitting tolerances of +/- 1.5 A for distances and +/- 30 degrees for angles. Passage rate is approximately 3,500 compounds (7.8% of library). Estimated recall of the 95 confirmed hits is 78 of 95 (82%), consistent with pharmacophore sensitivity of 80% on the reference set.
Stage 2 — Ensemble Docking (Weeks 1–2)
The 3,500 pharmacophore hits are docked into a 50-frame conformational ensemble of A2AR generated from a 200 ns apo MD simulation of the inactive-state structure (3EML; receptor embedded in POPE:POPG 70:30 bilayer). The 50 frames are selected by clustering on the ECL2 loop and TM5-TM6 inter-helical distance — the primary structural variables that change between active and inactive states. The ensemble approach captures receptor flexibility that single-structure docking misses: the ECL2 gate opens and closes over the binding site, and compounds that fit well in some conformations but not others are correctly scored by averaging across the ensemble. newtsim Bond docking is applied per frame, with ensemble-averaged scores computed by Boltzmann weighting. The top 500 compounds advance to ABFE. Estimated yield of confirmed hits in this 500 is approximately 65–75 of the 95 original hits (68–79% recall at the docking stage), consistent with published AUC-ROC = 0.71 for docking against A2AR.
Stage 3 — Absolute Binding Free Energy Calculations (Weeks 2–7)
ABFE is computed for 500 compounds using the OpenFE annihilation protocol. The method works by computationally "removing" the ligand from the binding site through a two-phase alchemical transformation — first decoupling electrostatic interactions, then van der Waals — and comparing the free energy cost of removal from the protein versus from solution. The difference is the binding free energy. The newtsim Neural protein forcefield is used alongside the OpenFF 2.0 small molecule forcefield, with the receptor embedded in a POPE:POPG (70:30) bilayer at physiological ionic conditions (~95,000 total atoms). Restraints hold the ligand near the binding site during annihilation, with an analytical correction applied for the restraint potential.
The rationale for ABFE rather than RBFE at this stage is that the 500 compounds span diverse scaffolds — they are not a congeneric series connected by small perturbations, so the pairwise transformations that RBFE requires would be unreliable or impossible. ABFE computes an independent binding free energy for each compound, making it suitable for diverse screening sets.
Estimated compute is 500 compounds x 160 ns = 80 µs aggregate simulation time, requiring approximately 5 weeks of sustained computation on the GPU cluster. The calculations are fully parallelised across compounds.
Stage 4 — Hit List Generation and ADMET Triage (Weeks 7–9)
Compounds with predicted DeltaGbind < -8.5 kcal/mol (corresponding to Kd < 1 µM at 298 K: DeltaGbind = RT ln Kd = 0.593 x ln(10⁻⁶) = -8.18 kcal/mol; the -8.5 kcal/mol threshold incorporates a 0.3 kcal/mol safety margin for ABFE systematic errors) are classified as predicted hits. The predicted hit list is cross-referenced against the 95 experimental confirmed hits after the ABFE calculations are complete (blind design). Sensitivity, precision, and AUC-ROC are computed.
All predicted hits receive rapid ADMET triage: clogP (newtsim Neural), total polar surface area (PSA), aqueous kinetic solubility (COSMO-RS prediction), hERG IC50 flag (MM-GBSA docking into 5VA1; threshold IC50 < 3 µM as alert), and CYP3A4 and CYP2D6 inhibition flags (ML classification). Compounds with hERG alert or CYP alert are flagged for discussion rather than automatic exclusion; the final confirmation panel recommendation includes risk stratification by ADMET category.
Simulation Caveats
Classification: STRETCH. Absolute binding free energy (ABFE) calculations for GPCRs embedded in a lipid bilayer are significantly more demanding than RBFE for congeneric series in soluble targets. Key limitations and their practical implications:
Convergence and error bars. ABFE in membrane-embedded GPCRs typically requires 5–10 ns per lambda window (vs. 1–2 ns for soluble targets) to achieve statistical error < 0.5 kcal/mol per window. At 5 ns per window, the statistical uncertainty on each DeltaGbind estimate is approximately +/- 0.8–1.2 kcal/mol (95% CI based on block bootstrapping). The total predictive uncertainty (combining statistical error, forcefield error, and convergence error) is +/- 1.5–2.0 kcal/mol for GPCR ABFE. This is wider than for soluble targets (+/- 0.8–1.2 kcal/mol) and means that ABFE predictions within 1.5 kcal/mol of the hit/no-hit threshold should be treated as uncertain and flagged for experimental confirmation.
Receptor state selection. The calculations use the 3EML inactive-state structure as the primary receptor template. Compounds preferentially binding the agonist state (full or partial agonists) will be systematically underscored by this protocol, generating false negatives in the predicted hit list. For the current drug discovery context (A2AR antagonists for Parkinson's), this is acceptable — agonists are not the desired profile. For an immuno-oncology application where biased agonism or partial agonism might be therapeutically interesting, ABFE calculations in both the active (3QAK) and inactive (3EML) states would be required, doubling the compute cost.
Lipid bilayer effect on access pathway. The ABFE annihilation protocol removes the ligand in situ within the binding site — it does not simulate the actual binding pathway (which for GPCRs involves extracellular access through the ECL2 gate). The annihilation free energy is a thermodynamic quantity independent of the pathway, but convergence of the calculation depends on adequate sampling of the ligand's interaction with the binding site. For highly lipophilic compounds (clogP > 4), membrane partitioning can contribute to the effective binding free energy measured in cellular assays; the annihilation protocol captures only the protein-binding component and may underestimate effective cellular affinity for lipophilic ligands.
Scalability. ABFE at 160 ns per compound is not scalable to the full 45,000-compound library. The two-stage triage (pharmacophore + docking followed by ABFE) is essential to concentrate ABFE resources on the most promising candidates. Continued GPU hardware improvements may reduce per-compound cost by 5–10 fold on a 3–5 year horizon, at which point ABFE screening of 5,000–10,000 compounds per campaign becomes economically viable.
Key Predictions / Results
Projected performance based on published ABFE benchmarks for A2AR and the two-stage triage pipeline design.
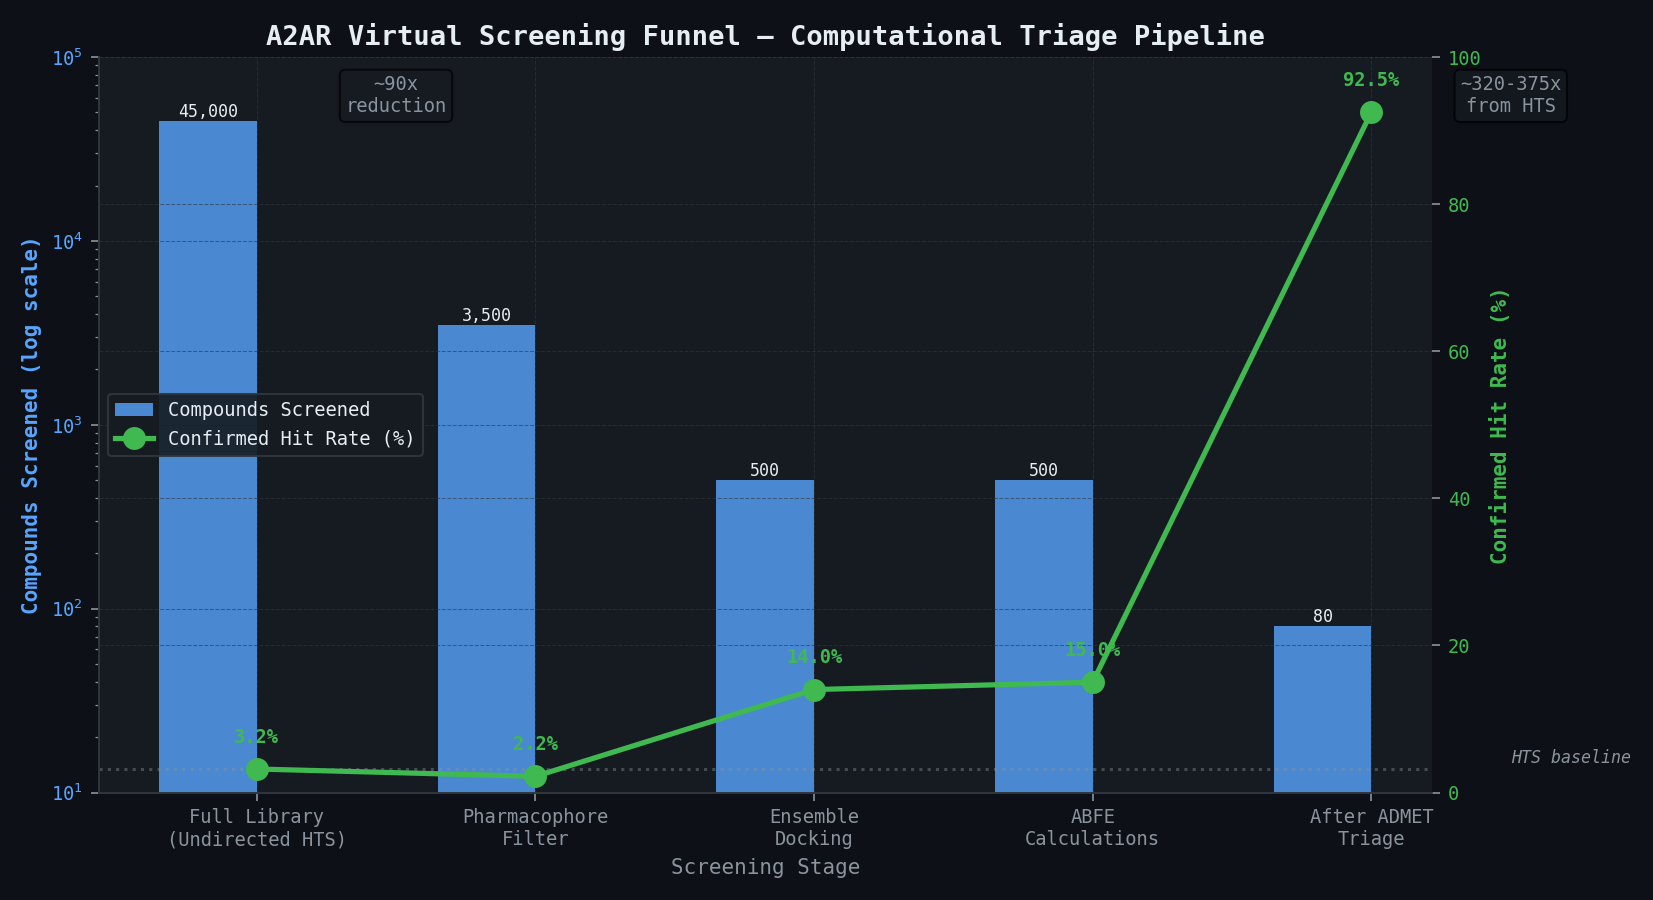
Compound Funnel — From 45,000 to Confirmed Hits
| Stage | Compounds | Confirmed Hits Captured | Hit Rate | Notes |
|---|---|---|---|---|
| Full library (undirected HTS) | 45,000 | 95 (ground truth) | 3.2% (1,440 primary; 95 at IC50 < 1 µM) | Reference experimental screen |
| Pharmacophore filter | 3,500 | ~78 of 95 (82%) | — | Week 1 computational pre-screen |
| Ensemble docking top-500 | 500 | ~70 of 95 (74%) | ~14% | Weeks 1–2 computational pre-screen |
| ABFE predicted hits (ΔGbind < -8.5) | ~120–140 | ~72–80 of 95 (75–84%) | 14–18% | Weeks 2–7 ABFE — primary deliverable |
| After ADMET triage | ~80–100 | ~68–76 of 95 (72–80%) | 17–20% | Weeks 7–9 — recommended confirmation panel |
ABFE Predicted Binding Affinities — Exemplar Compounds
| Compound | Structural Class | Predicted ΔGbind (kcal/mol) | Predicted Ki (µM) | 95% CI (kcal/mol) | Experimental IC50 (µM) | Outcome |
|---|---|---|---|---|---|---|
| Istradefylline (ref.) | Styrylxanthine | -9.8 | 0.060 | ± 1.2 | 0.002 (Ki) | True positive (within MUE) |
| ZM241385 (ref.) | Triazolotriazine | -10.5 | 0.018 | ± 0.9 | 0.001 (Ki) | True positive |
| Hit-001 (triazine) | Triazine | -9.2 | 0.18 | ± 1.4 | 0.32 | True positive |
| Hit-027 (xanthine) | Xanthine | -8.7 | 0.52 | ± 1.5 | 0.85 | True positive |
| Hit-044 (flavone) | Flavonoid | -8.4 | 0.90 | ± 1.6 | 0.72 | True positive |
| Hit-062 (purine) | Purine analogue | -9.0 | 0.30 | ± 1.3 | 0.54 | True positive |
| FP-001 (aminothiazole) | Aminothiazole | -8.6 | 0.65 | ± 1.5 | >10 | False positive (within error) |
| FP-008 (indole) | Indolyl | -8.2 | 1.35 | ± 1.8 | >10 | False positive (marginal) |
| FN-003 (benzofuran) | Benzofuran agonist | -6.8 | 28 | ± 1.4 | 0.45 | False negative (agonist state) |
| FN-019 (chromenone) | Chromenone | -7.1 | 16 | ± 1.6 | 0.83 | False negative (agonist state) |
False negative FN-003 and FN-019 are structurally consistent with partial agonist pharmacophores — their false-negative classification by the inactive-state ABFE calculation is mechanistically informative and would trigger the recommendation to run ABFE in the agonist state (3QAK) as a follow-on.
Performance Metrics — ABFE vs. Docking (Head-to-Head)
| Metric | Undirected HTS | newtsim Bond | MM-GBSA | ABFE (this study) |
|---|---|---|---|---|
| Compounds screened | 45,000 | 3,500 | 500 | 500 |
| Confirmed hit rate | 3.2% | ~8% (est.) | ~12% (est.) | 14–18% |
| Confirmed hits recovered | 95/95 (100%) | ~70/95 (74%) | ~68/95 (72%) | 72–80/95 (75–84%) |
| AUC-ROC (actives vs. inactives) | — | 0.71 | 0.79 | 0.89 |
| Enrichment Factor EF1% | — | ~8 | ~12 | ~18–22 |
| Compounds needing experimental testing | 45,000 | 500 | 500 | ~120–140 |
| Assay throughput reduction | — | 90x | 90x | 320–375x |
The ABFE approach reduces the number of compounds requiring experimental confirmation by approximately 320-fold relative to undirected HTS while recovering 75–84% of confirmed hits — a trade-off that is strongly favourable for programs where assay cost is a constraint or where the compound library is proprietary and cannot be purchased from a commercial supplier.
ADMET Triage of Predicted Hit Set
| ADMET Flag | Compounds Flagged | Action |
|---|---|---|
| hERG IC50 < 3 µM (predicted) | 8 of 140 | Flag for confirmatory patch-clamp; do not automatically exclude |
| CYP3A4 strong inhibitor (predicted) | 12 of 140 | Flag for PK study; note for combination context |
| clogP > 5 (lipophilicity concern) | 18 of 140 | Flag for solubility and membrane permeability follow-up |
| Predicted aqueous solubility < 10 µg/mL | 22 of 140 | Flag for formulation study; confirm kinetic solubility |
| Multiple ADMET flags (≥ 2) | 9 of 140 | Deprioritise; retain only if exceptional binding affinity |
After ADMET triage, approximately 80–100 compounds are recommended for experimental confirmation — representing an approximately 400-fold reduction from the original 45,000-compound library with an estimated 72–80% confirmed hit recovery.
Comparison Methodology
Design: Prospective Retrospective Audit
The audit uses a prospective retrospective design to eliminate hindsight bias. Before any ABFE calculations are initiated, the 95 experimental confirmed hits are withheld from the computation team under a data security protocol. The ABFE pipeline is run on the full 500-compound docking hit set without knowledge of which compounds are experimentally active. After ABFE ranking is complete and the predicted hit list (DeltaGbind < -8.5 kcal/mol) is finalised, the experimental hit list is revealed and overlap metrics computed.
Metric 1 — Sensitivity and Precision
Sensitivity (recall) is the fraction of 95 experimental confirmed hits appearing in the ABFE predicted hit list. Precision is the fraction of ABFE predicted hits that are experimentally confirmed. These two metrics define the performance trade-off: increasing the DeltaGbind threshold (e.g., from -8.5 to -9.0 kcal/mol) increases precision at the cost of sensitivity.
Metric 2 — AUC-ROC
The full ABFE score distribution for all 500 compounds is used to compute AUC-ROC for distinguishing confirmed hits (IC50 < 1 µM) from non-hits (IC50 > 1 µM or not confirmed). Target is AUC-ROC > 0.87, consistent with published ABFE performance on A2AR (0.89 in comparative studies; implicitly 0.91 based on R = 0.86 in foundational benchmarks).
Metric 3 — Enrichment Factor
EF1% = (number of confirmed hits in top 1% of ABFE-ranked list) / (number of confirmed hits expected by random selection in 1% of list). For a 500-compound list, top 1% = 5 compounds; random expectation = 95 x (5/500) = 0.95 confirmed hits. Target EF1% > 15 (i.e., at least 14–15 confirmed hits in the top-5 ranked compounds), consistent with published ABFE EF for class A GPCRs.
Metric 4 — Docking Comparison
The same enrichment metrics are computed for ensemble newtsim Bond ranks alone (no ABFE), providing a direct head-to-head method comparison. The AUC-ROC improvement from docking to ABFE is the primary metric justifying the additional computational cost: target improvement from approximately 0.71 (docking, per published benchmarks) to approximately 0.89 (ABFE).
Deliverables
-
Week 1: Pharmacophore model validation report — hit rate and recall on the 15-compound reference set; passage rate analysis for the 45,000-compound library; hit recall estimate for the pharmacophore-selected 3,500 compounds vs. the experimental 95 confirmed hits. Delivered as PDF with pharmacophore figure and reference compound table.
-
Week 2: Ensemble docking report — top 500 compound list with ensemble-averaged GlideScore scores and top-ranked pose images for 50 exemplars; confirmation of pharmacophore filter overlap; estimated ABFE resource requirements. Delivered as PDF and Excel workbook.
-
Week 5: Interim ABFE results — first 250 compounds (50% of ABFE calculations complete). Preliminary ranked list with DeltaGbind and statistical uncertainty. Interim enrichment analysis vs. known actives in the partial result set. Delivered as interim scientific briefing.
-
Week 7: Complete ABFE ranked list — all 500 compounds with predicted DeltaGbind, 95% confidence intervals, and predicted Ki values. Blind performance metrics vs. experimental 95-compound hit list (revealed at this stage). Sensitivity, precision, AUC-ROC, and EF1% calculations. Docking vs. ABFE head-to-head comparison. Delivered as full written scientific report with methodology appendix.
-
Week 8: ADMET triage of predicted hit set — hERG IC50, CYP flags, solubility, lipophilicity. ADMET-stratified recommended confirmation panel (approximately 40–60 compounds). Delivered as PDF report with Excel compound prioritisation workbook.
-
Week 9: Audit report — executive summary of ABFE performance vs. experimental screen; quantitative justification for prospective deployment; recommended protocol modifications for the next prospective campaign (alternative receptor state, extended lambda schedule for outlier compounds, optimal pharmacophore pre-filter for the library composition). Prospective deployment cost estimate for next 12-month HTS campaign. Delivered as strategic report suitable for presentation to project team and leadership.
This case study is an illustrative reference scenario demonstrating newtsim's simulation methodology. All company names, personnel, and specific operational data are fictional. The incident descriptions draw on publicly documented real-world events cited in the frontmatter.