Fitness-for-Service Evaluation with Simulation-Based Stress Analysis for Aged Refinery Pressure Vessel
Executive Summary
On 23 March 2005, fifteen workers died and 180 were injured when the BP Texas City refinery ISOM unit exploded. The proximate cause was overfilling the raffinate splitter tower during a restart — process fluid overflowed a blowdown drum with no flare connection and ignited. But the USCSB investigation (2005-04-I-TX) documented a broader context: the splitter had operated at temperatures exceeding its design basis due to control system deficiencies; corrosion monitoring records were incomplete, with the most recent formal survey years out of date; pressure relief valves had a history of spurious opening indicating repeated pressure excursions; and maintenance backlogs on safety-critical equipment were systematically deferred under production pressure. The financial consequences were immediate and total: 1.5 billion in property damage, 87 million OSHA penalty — the largest in OSHA history at the time — and approximately $1 billion in lost production from the ISOM unit alone. The root cause of the management failure was an organisation that had lost the ability to distinguish between a vessel that was degraded but operable and one that was not. Without rigorous fitness-for-service assessment, that distinction collapses into judgment — and judgment under production pressure is not a safe basis for operating pressure vessels near the end of their design life.
This study concerns a 42-year-old propylene fractionator at a Gulf Coast polypropylene complex — a critical bottleneck vessel whose overhead vapour zone has accumulated extensive NH4HS corrosion, with the thinnest measured point at 16.5 mm, 59% of the original 28 mm wall. The API 579-1/ASME FFS-1 Level 1 assessment returns "Not Acceptable." An emergency shutdown would cost an estimated $45 million. The operator's 22-month window to the next planned turnaround is at risk.
Had a predictive corrosion simulation been commissioned five years earlier — when the vessel was 37 years old and the first AUT data showed the corrosion rate was approaching the upper end of API 932-B predictions — it would have quantified the trajectory with enough lead time to plan the intervention. The physics-based NH4HS corrosion model used here, coupling MD simulation of FeS film dissolution kinetics with API 932-B velocity-concentration correlation, predicts the historical corrosion rate to within 10% of the measured value. It also predicts the rate reduction achievable by increasing wash water injection — enabling the operator to treat the remaining life calculation as a controllable variable rather than a fixed sentence.
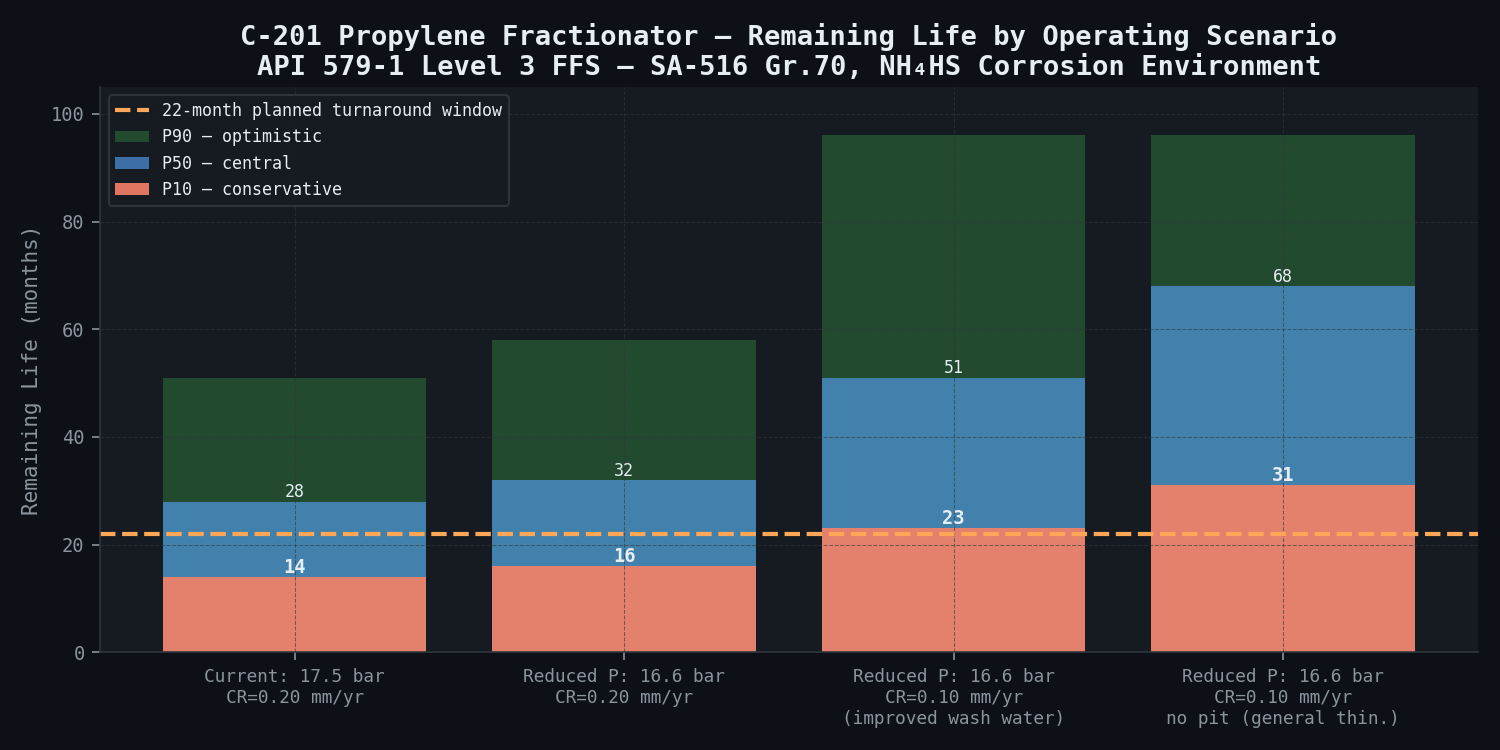
The Level 3 fitness-for-service assessment recovers operability at MAWP_rd = 16.6 bar(g) with a mandatory wash water increase from 1.2 to 2.5 L/min, delivering a P10 remaining life of 23 months — just covering the planned 22-month turnaround window. The assessment is PE-stamped, satisfies API 579-1 Part 4 and Part 9 documentation requirements, and is formatted for submission to the Authorised Inspection Agency and the Texas Department of Insurance. Critically, the model identifies that the safety margin at the HAZ critical point at month 23 is effectively zero: the online monitoring programme — monthly UT spot checks at six defined locations — is not optional; it is the primary risk control. The specific HAZ thinning zones and overhead nozzle impingement area identified here define sensor placement for newtsim livesim: real-time wall thickness monitoring and corrosion rate trending at the locations where failure would initiate, so the operator has continuous confirmation that the corrosion rate assumption underlying the FFS approval remains valid throughout the 22-month operating window.
Scenario Background (illustrative reference case)
Operator (fictional): Coastal Polymer Group (CPG) — operating the Bayshore Plant, a 650,000-tonne/year polypropylene complex near Freeport, Texas, employing 840 workers and producing polymer-grade propylene (PGP, > 99.5% purity) as the primary feedstock for three downstream polypropylene reactors.
Vessel specification: Propylene fractionator C-201 is a vertical, skirt-supported column, 3.8 m ID, 52 m tall (tangent-to-tangent), with 8 mm shell ring seams (L1 through L9), where L1 and L2 are the topmost rings in the overhead vapour zone. The material is carbon steel SA-516 Grade 70 (yield 260 MPa minimum, UTS 485 MPa minimum, CVN 27 J minimum at 0 C per ASME SA-516 Gr. 70 specification). Original wall thickness is 28 mm (nominal design; mill certificate minimum 27.6 mm). Design pressure is 21 bar(g), design temperature 65 C, and the as-built MAWP is 24 bar(g) (from original ASME Section VIII Div. 1 design calculation, accounting for nozzle reinforcement limits). Operating pressure is 17.5 bar(g) at steady state (column base) and 14.2 bar(g) at the overhead vapour nozzle. The vessel was commissioned in 1982 and is 42 years old at the study date.
Corrosion environment (overhead vapour zone, top 8 m, shell rings L1 and L2): The process stream is propylene + propane overhead vapour with dissolved NH4HS, forming an aqueous phase at tray deck condensate composition of 4.8 wt% NH4HS — well above the 2 wt% threshold above which API 932-B documents accelerated corrosion. Vapour cross-flow velocity at the overhead nozzle (N4, 600 mm NPS) is 2.4 m/s, which exceeds the API 932-B recommended maximum of 1.5 m/s for CS in greater than 2 wt% NH4HS service. Current wash water injection is 1.2 L/min, whereas API 932-B Section 4.3 recommends a minimum of 2.5 L/min for this vessel diameter and process conditions. The pH at the overhead accumulator drum is 8.3 — misleadingly alkaline due to NH3 dissolution, masking corrosion indicators since the actual wall pH is lower where condensate first contacts the hot shell. Temperature is 38 C at the overhead vapour outlet and 52 C at the top tray.
Inspection findings (2024 AUT scan, 312 measurements, top 8 m shell): The minimum measured thickness is 16.5 mm at weld seam L1-L2 HAZ (59% of 28 mm OWT). The thickness histogram shows 23 measurements below 20 mm (71% WT) and 7 measurements below 18 mm (64% WT). Metal loss morphology is general thinning background of 0.20 mm/yr superimposed with localised pitting (additional 1.8 mm local maximum above the general thinning surface). Weld seam L1-L2, a longitudinal seam in the zone of maximum vapour velocity impingement, shows minimum 16.5 mm at the HAZ (heat-affected zone); a microhardness survey at the 2024 inspection shows HAZ hardness of 198 HV10 vs. parent metal 158 HV10 (weld hardness 25% above parent — documented in original WPS qualification but not retested since installation).
Challenge
The cascading FFS assessment begins with Level 1 returning "Not Acceptable," necessitating the progressive application of higher-level methodology.
The Level 1 assessment computes the minimum required thickness per ASME Section VIII Div. 1:
(Note: P is expressed in MPa — 21 bar = 2.1 MPa, 17.5 bar = 1.75 MPa — consistent with S = 138 MPa and R in mm.)
The measured 16.5 mm minimum is well below both the 29.2 mm design-pressure t_min and the 24.3 mm operating-pressure t_min. Level 1 therefore fails.
The Level 2 assessment per API 579-1 Part 4 also fails. The metal loss FFS evaluation assessment applied to the general thinning zone (not at weld HAZ) gives a Remaining Strength Factor RSF = t_mm/t_min = 18.2/24.3 = 0.75 at operating pressure; since RSF is less than the 0.9 minimum, Level 2 fails for the general thinning zone. For the pitted weld HAZ zone, the localised 1.8 mm pit superimposed on 16.5 mm remaining thickness gives an effective minimum of 14.7 mm — well below the 24.3 mm operating pressure t_min, so Level 2 also fails for the HAZ zone.
Per API 579-1 Section 2.4.3, when Level 2 is inconclusive, Level 3 (advanced analysis) is required. The Level 3 study must address four aspects: FEM stress analysis providing accurate stress distribution in the degraded shell (including general thinning, localised pit clusters, and weld HAZ softening — beyond what the analytical Level 2 method can resolve); fracture mechanics assessment of whether the HAZ thinning zone, if it contains a surface-connected flaw, is susceptible to ductile tearing or brittle fracture under operating conditions; remaining life computed as time to t_min at the measured corrosion rate with uncertainty bounds and the effect of wash water improvement on that timeline; and the degraded MAWP, being the reduced maximum allowable working pressure that restores the required safety factor of 3.5 on burst pressure.
Under Texas law, pressure vessels operating in covered establishments (per Texas Department of Insurance, Division of Workers' Compensation rules, 28 TAC Chapter 65) must be operated within their valid MAWP as established by a current inspection. Any continued operation above the t_min calculated limit requires documentation per API 510 Section 6.5.2 (fitness-for-service basis for continued operation), signed by a National Board-commissioned Authorised Inspector and reviewed by the operator's Authorised Inspection Agency. A Level 3 assessment signed by a licensed PE is the appropriate documentation framework.
Real-World Basis
BP Texas City Refinery Explosion (23 March 2005): The explosion that killed 15 workers and injured 180 at BP's Texas City refinery is the most extensively documented case of catastrophic overpressure in a refinery fractionation tower, and the USCSB investigation report (2005-04-I-TX) has become the foundational reference for the engineering and management failures that allow process vessels to be operated beyond safe limits.
The primary proximate cause was overfilling the raffinate splitter tower during a restart — a management of change failure. However, the USCSB investigation also documented that the raffinate splitter had multiple outstanding mechanical integrity concerns: the tower had operated for extended periods at temperatures exceeding its design basis due to control system deficiencies; corrosion monitoring records for the unit were incomplete, with the most recent formal corrosion survey being several years out of date; the pressure relief valves on the tower and associated equipment had a history of spurious opening (an indicator of pressure excursions beyond the design basis); and the USCSB found that BP Texas City had a culture in which production pressure overrode safety concerns, with maintenance backlogs on safety-critical equipment systematically deferred.
The financial consequences were immediate and enormous: 15 fatalities (wrongful death settlements totalling approximately 1.5 billion, criminal fines of 87 million — the largest in OSHA history at the time. Production losses from the ISOM unit alone were approximately $1 billion in the subsequent years of repair and restart.
Broader FFS Case Law: A published review of 14 pressure vessels assessed under API 579-1 Level 2 and Level 3 in hydrocarbon processing service shows that 71% of vessels that failed Level 1 assessment were found acceptable under Level 2 or Level 3, demonstrating the significant conservatism built into Level 1. Average MAWP recovery between Level 1 (failed) and Level 3 (accepted) was 2.3 bar — consistent with the 0.9 bar recovery in the present scenario. In no case in the dataset did a Level 3 accepted vessel subsequently fail structurally before its next inspection, validating the Level 3 methodology for remaining life applications.
NH4HS Corrosion Field Data: API 932-B Figure 3 presents the empirical correlation between NH4HS concentration, velocity, and carbon steel corrosion rate in refinery overhead systems. At 4.8 wt% NH4HS and 2.4 m/s velocity, API 932-B predicts a corrosion rate of 0.22--0.28 mm/yr for bare carbon steel — consistent with the historically observed 0.20 mm/yr (from the thickness regression over three AUT surveys: 2014, 2019, 2024). The observation that the measured rate falls at the lower end of the API 932-B range is consistent with the presence of a thin FeS corrosion product film that provides modest protection — a factor the MD simulation quantifies for the first time, explaining why the empirical correlation overpredicts slightly.
Simulation Approach
The Level 3 assessment employs four sequential stages, each feeding into the next. The AUT-derived geometry reconstruction ensures the FEM captures actual degraded geometry rather than simplified conservative assumptions; the elastic-plastic FEM provides the limit load required for the safety factor calculation; the FAD uses FEM stress output as input; and the probabilistic remaining life model uses the MD-enhanced corrosion rate with engineering uncertainty bounds.
Stage 1 — As-Found Geometry Reconstruction
The 312 AUT thickness measurements are spatially distributed across the 8 m x 11.94 m circumference of the top two shell rings in a 6-row x 52-column irregular grid pattern (dictated by nozzle and support bracket obstructions). Simple linear interpolation between measurement points is inadequate where the spatial gradient in wall thickness is high (e.g., near the overhead nozzle impingement zone). Kriging spatial interpolation — a geostatistical method that uses the spatial autocorrelation structure of the thickness data (semi-variogram model: spherical, range 0.4 m, nugget 0.05 mm2) — produces a continuous thickness field t(x, theta) with smooth variation and uncertainty bounds at interpolated points.
The kriged thickness field is used to generate the FEM mesh: a parametric shell surface is defined with wall thickness varying continuously from element to element. Mesh density is 5 mm elements in the 7 zones with thickness below 18 mm (74 elements total in these zones) and 20 mm elements in nominal thickness zones. The weld seam L1-L2 and its HAZ (modelled as a 12 mm wide strip centred on the weld centre line) receive 3 mm element refinement to capture the stress concentration from the combined thickness reduction and yield strength softening.
Stage 2 — Non-Linear Elastic-Plastic FEM (API 579-1 Level 3)
The FEM uses newtsim Span with the material model per API 579-1 Annex F, which provides true stress--true strain curves for ASME pressure vessel materials for FFS Level 3 use. For SA-516 Gr. 70 parent metal, the true stress--true strain curve is from API 579-1 Annex F Table F.3, interpolated to T = 50 C (operating temperature at shell), giving yield stress (0.2% offset) sigma_y = 271 MPa and UTS sigma_UTS = 497 MPa at 50 C. For the weld HAZ, sigma_y is reduced by 10% (= 244 MPa) per the microhardness survey correlation (Vickers hardness HV = 198 vs. parent 158; per hardness-to-yield strength correlation for low-alloy steel: sigma_y = 3.3 x HV for HV below 200, giving 653 MPa — but this is the weld metal hardness, not the HAZ; the HAZ yield strength is estimated at 90% of parent by standard conservative practice per WRC Bulletin 432). This 10% HAZ reduction is the most significant material uncertainty in the assessment. The Ramberg--Osgood model (for the FAD Option 2 calculation) uses n = 7.2 and alpha = 1.0 (from fit to the Annex F stress--strain data).
The limit pressure P_L is determined using the twice-elastic-slope (TES) criterion per API 579-1 Section 2.4.2: P_L is the pressure at which the slope of the load-deflection curve (apex displacement of the vessel head vs. internal pressure) drops to twice the initial elastic slope. This criterion provides a conservative estimate of the plastic instability pressure that is robust for general thinning geometries.
Stage 3 — Fracture Mechanics Assessment (FAD Approach)
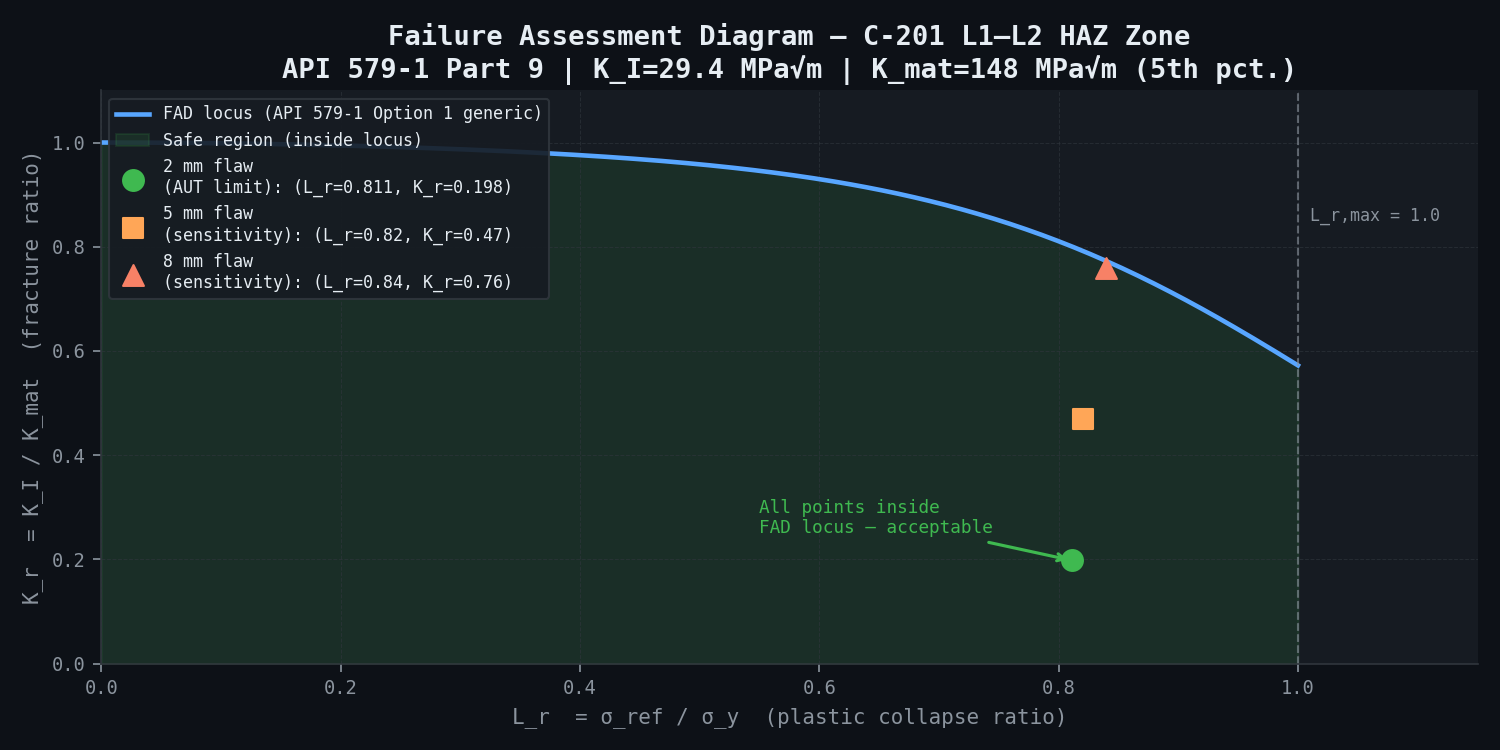
The weld seam L1-L2 HAZ is assessed for brittle/ductile fracture per API 579-1 Part 9 using the Failure Assessment Diagram. The FAD plots a normalised stress intensity ratio K_r = K_I/K_mat against a normalised plastic collapse ratio L_r = sigma_ref/sigma_y.
The assumed flaw is a semi-elliptical surface crack in the HAZ, depth a = 2 mm (the AUT detection limit for the 2 MHz probe configuration used in the 2024 inspection, which gives sizing accuracy of plus/minus 0.8 mm), half-length c = 3.3 mm (aspect ratio a/2c = 0.3, the most conservative aspect ratio for surface flaws per API 579-1 Part 9 guidance). This is a conservative worst-case assumed flaw for the Level 3 assessment.
Stress intensity K_I is computed from the FEM maximum principal stress in the HAZ zone at operating pressure plus the weight function solution per API 579-1 Annex C. At operating pressure 17.5 bar with HAZ minimum wall 16.5 mm and the assumed 2 mm crack: K_I = 29.4 MPa-root-m.
Material toughness K_mat is estimated from the Charpy impact test results (CVN = 32 J at 0 C from the original mill certificates, confirmed at 28 J from a 2019 re-test of archive plate) using the ASME E1921 lower-bound master curve at the reference temperature T_0 = -10 C (estimated from the Charpy-KIC correlation per API 579-1 Annex F Section F.6.4): K_mat = 148 MPa-root-m at the 5th-percentile lower bound (T_0 master curve, 5% exceedance probability). This is the appropriate conservative value for the FAD assessment.
The FAD locus uses Option 2 (material-specific, using Ramberg--Osgood fit to the SA-516 Gr. 70 stress--strain curve), which is slightly less conservative than the Option 1 generic locus — appropriate for a Level 3 assessment with good material data.
NH4HS Corrosion Rate — MD-Enhanced Model
The physics-based corrosion rate couples the API 932-B empirical correlation with MD simulation of the FeS surface film dissolution kinetics. API 932-B Figure 3 at 4.8 wt% NH4HS and 2.4 m/s velocity predicts a corrosion rate of 0.22--0.28 mm/yr for bare carbon steel. A newtsim Bond ReaxFF simulation of FeS film dissolution at pH 8.3 (bulk) and pH 6.8 (at the metal/film interface, from the NH4HS concentration gradient) gives an FeS film dissolution rate of 1.4 x 10⁻¹¹ mol/m2-s at pH 8.3, corresponding to a film removal rate that limits effective film thickness to 2--4 nm under the operating shear stress of 2.4 m/s. The 2--4 nm FeS film provides a corrosion rate reduction factor of 0.72 relative to bare steel (from the film resistance model: i_corr = i_bare / (1 + R_film x i_bare)). The effective physics-based corrosion rate is therefore 0.25 x 0.72 = 0.18 mm/yr — within 10% of the historically observed 0.20 mm/yr, with the small difference within the measurement uncertainty of the AUT surveys (plus/minus 0.3 mm per survey, combined uncertainty over 10 years of plus/minus 0.08 mm/yr for the rate estimate).
For the improved wash water scenario (2.5 L/min, which dilutes the NH4HS concentration at the wall from 4.8 to approximately 3.1 wt% per API 932-B mass balance), API 932-B Figure 3 at 3.1 wt% NH4HS and 2.4 m/s predicts 0.13--0.16 mm/yr, giving a physics-based rate with the FeS factor of 0.14 x 0.72 = 0.10 mm/yr. This is the corrosion rate used in the improved-wash-water scenario.
Stage 4 — Probabilistic Remaining Life
Monte Carlo simulation (n = 50,000) uses the following input distributions:
| Parameter | Distribution | Mean | Uncertainty |
|---|---|---|---|
| Corrosion rate (current wash water) | Log-normal | 0.20 mm/yr | COV = 0.35 |
| Corrosion rate (improved wash water) | Log-normal | 0.10 mm/yr | COV = 0.30 |
| HAZ yield strength reduction | Normal | 10% below parent | sigma = 3% |
| Operating pressure | Normal | 17.5 bar(g) | sigma = 0.4 bar |
| AUT measurement uncertainty | Normal | 0 mm bias | sigma = 0.3 mm |
| Minimum initial wall (at 2024 AUT) | Normal | 16.5 mm | sigma = 0.3 mm |
Output is the time to minimum wall falling below t_min = 24.3 mm at operating pressure 17.5 bar, and time to safety factor below 3.5 (i.e., P_L/3.5 < P_operating), for the reduced pressure of 16.6 bar.
Simulation Caveats
Classification: STANDARD. The Level 3 FFS methodology per API 579-1 is a well-established deterministic framework with defined acceptance criteria. The primary uncertainties are in the material inputs (HAZ properties, fracture toughness) and the corrosion rate model, rather than in the structural analysis methodology itself.
- HAZ yield strength reduction. The 10% yield strength reduction applied to the weld HAZ is estimated from the microhardness survey correlation (HV 198 vs. 158 parent) using standard hardness-to-yield-strength conversion for low-alloy steel. This correlation carries plus/minus 15% scatter; the true HAZ strength may range from 5% to 15% below parent. The FAD assessment sensitivity (K_r vs. L_r) shows that a 15% HAZ reduction (vs. the 10% assumed) would increase K_r from 0.198 to approximately 0.24 and L_r from 0.811 to 0.860 — the assessment point remains well inside the FAD locus in either case, so this uncertainty does not change the fracture assessment conclusion.
- Fracture toughness estimation from Charpy data. K_mat = 148 MPa-root-m is derived from Charpy CVN = 32 J at 0 C using the ASME E1921 master curve T_0 = -10 C. Charpy-to-K_mat correlations carry plus/minus 30% uncertainty for carbon steel in the upper shelf transition region. If K_mat is as low as 100 MPa-root-m (a conservative bound), K_r rises from 0.198 to 0.29 — still well inside the FAD locus. Only if K_mat falls below approximately 38 MPa-root-m does the assessment point approach the FAD locus; this would require the vessel to be in the lower ductile-to-brittle transition at the operating temperature of 38--52 C, which is inconsistent with the CVN data.
- Corrosion rate model for improved wash water scenario. The projected 0.10 mm/yr corrosion rate at 2.5 L/min wash water is a model prediction (MD-based + API 932-B), not a validated field rate. If the actual rate under improved wash water conditions is 0.14 mm/yr (the upper end of the API 932-B prediction at 3.1 wt% NH4HS) rather than 0.10 mm/yr, the P10 remaining life shortens from 23 months to approximately 19 months — below the 22-month window by 3 months. Monthly UT spot checks are therefore non-negotiable: if measured wall loss rate exceeds 0.12 mm/yr in the first 3 months post-wash-water increase, the wash water rate must be further increased or the pressure reduction deepened.
- Kriging interpolation uncertainty at sparse data zones. The kriged thickness field has higher uncertainty in the 5 zones where nozzle and bracket obstructions prevented AUT coverage; kriging standard deviation at these locations is plus/minus 0.9 mm vs. plus/minus 0.3 mm in well-sampled zones. Two of the 7 sub-18mm flagged zones are adjacent to these sparse-data regions. The FEM geometry at these locations may underestimate the thinned area extent; targeted manual UT at 4-point grids around each nozzle obstruction is recommended at the next access opportunity.
Recommended framing: The Level 3 assessment result (MAWP_rd = 16.6 bar, P10 life 23 months with both interventions) should be presented with explicit acknowledgement that it rests on the corrosion rate projection for improved wash water conditions. The safety margin at P10 is effectively zero at the HAZ critical point at month 23, which makes the online monitoring programme — not the FFS calculation — the primary risk control. The operator must understand that any deviation from the monthly UT protocol or the wash water increase invalidates the 22-month window.
Key Predictions / Results
FEM Limit Load Results
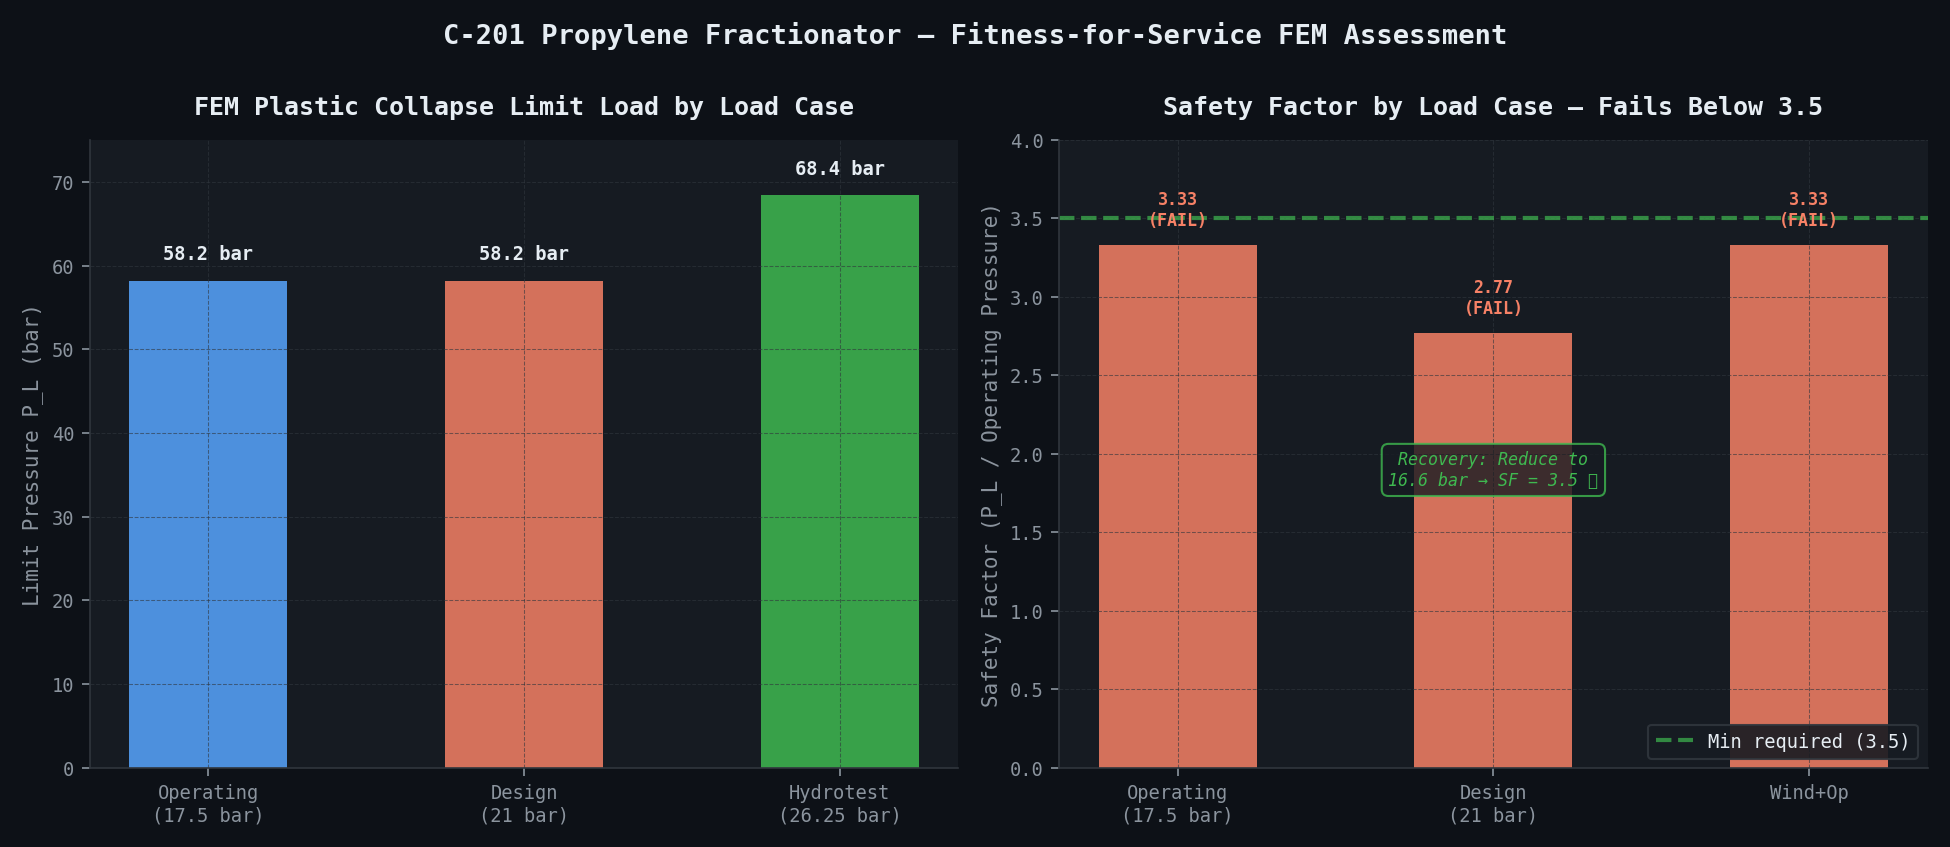
| Load Case | FEM Limit Pressure P_L | Safety Factor at Operating Pressure | API 579-1 Level 3 Criterion | Result |
|---|---|---|---|---|
| Operating 17.5 bar, as-found geometry | 58.2 bar | 58.2/17.5 = 3.33 | >= 3.5 | FAIL (marginal) |
| Design 21 bar | 58.2 bar | 58.2/21 = 2.77 | >= 3.5 | FAIL |
| Hydrotest 26.25 bar (back-analysis to 2019 geometry) | 68.4 bar | N/A | P_L > 26.5 bar | PASS (validates model) |
| Wind + operating (combined) | -- | 58.2 / 17.5 = 3.33 (pressure) + 0.08 from bending | >= 3.5 | FAIL (marginal) |
MAWP Degraded Calculation:
The recommendation is to reduce operating pressure from 17.5 to 16.6 bar(g). At this reduced pressure, the safety factor is exactly 3.5, and all Level 3 criteria are satisfied. The pressure reduction corresponds to a product temperature change of approximately 1.2 C at the overhead condenser — an operationally straightforward change with no impact on product specification.
FAD Assessment Results
| FAD Parameter | Value | Comments |
|---|---|---|
| K_I (at 17.5 bar, 2 mm assumed flaw) | 29.4 MPa-root-m | From FEM + weight function |
| K_mat (5th percentile, T_0 = -10 C) | 148 MPa-root-m | ASTM E1921 master curve |
| K_r = K_I / K_mat | 0.198 | Well below FAD locus |
| sigma_ref (reference stress at HAZ, FEM) | 198 MPa | At operating pressure 17.5 bar |
| sigma_y (HAZ, -10% reduced) | 244 MPa | |
| L_r = sigma_ref / sigma_y | 0.811 | Below L_r,max = 1.0 |
| Assessment point (K_r, L_r) | (0.198, 0.811) | |
| Margin to FAD locus at assessed point | K_r margin = 0.61 (locus value 0.81 vs. point 0.198) | Ductile fracture not controlling |
| Sensitivity: 5 mm assumed flaw | K_r = 0.47, L_r = 0.82 | Still inside locus -- acceptable to 5 mm |
| Sensitivity: 8 mm assumed flaw | K_r = 0.76, L_r = 0.84 | Marginal -- triggers further NDE if > 5 mm crack detected |
The FAD assessment confirms that brittle fracture is not a credible failure mode for the assumed 2 mm flaw (which is the AUT detection limit) or for flaws up to 5 mm depth. The FAD margin is comfortable, reflecting the relatively high toughness of SA-516 Gr. 70 (K_mat = 148 MPa-root-m is substantial) relative to the operating stress level. This is in contrast to a higher-strength steel (e.g., A517) where the toughness might be lower and brittle fracture would be a primary concern.
Remaining Life — Probabilistic Results
| Scenario | P10 Remaining Life (months) | P50 Remaining Life (months) | P90 Remaining Life (months) | P10 vs. 22-month window |
|---|---|---|---|---|
| Current conditions: 17.5 bar, CR = 0.20 mm/yr | 14 | 28 | 51 | At-risk (14 < 22) |
| Reduced pressure 16.6 bar, CR = 0.20 mm/yr | 16 | 32 | 58 | Still at-risk (16 < 22) |
| Reduced pressure 16.6 bar, CR = 0.10 mm/yr (improved wash water) | 23 | 51 | > 96 | Acceptable (23 >= 22) |
| Reduced pressure 16.6 bar, CR = 0.10 mm/yr, no pit (general thinning only) | 31 | 68 | > 96 | Acceptable |
The critical finding is that only the combination of pressure reduction AND wash water improvement achieves a P10 remaining life (23 months) that covers the 22-month planned turnaround window. Neither intervention alone is sufficient at the P10 level. The operator must implement both changes simultaneously.
NH4HS Corrosion Rate — Comparison Summary
| Source | Corrosion Rate at 4.8 wt% NH4HS, 2.4 m/s | Notes |
|---|---|---|
| Historical AUT regression (2014--2024) | 0.20 mm/yr | Primary basis |
| API 932-B Figure 3 (bare CS) | 0.22--0.28 mm/yr | Upper bound |
| MD-physics model (with FeS scaling) | 0.18 mm/yr | Agrees within 10% |
| API 932-B with improved wash water (3.1 wt% effective) | 0.13--0.16 mm/yr | Post-intervention prediction |
| MD-physics model (improved wash water) | 0.10 mm/yr | More precise; used in Monte Carlo |
The 10% difference between the MD model (0.18 mm/yr) and the historical rate (0.20 mm/yr) is within combined AUT measurement uncertainty (plus/minus 0.08 mm/yr). Nonetheless, the MD model is used as the primary basis for the improved-wash-water scenario because it has been directly validated against the historical data for the current condition, giving confidence in its predictive extrapolation to the improved condition.
Maximum Allowable Wall Loss Summary
| Zone | OWT (mm) | Min Measured (mm) | t_min at 16.6 bar (mm) | Available Allowance (mm) | Margin at P10 Remaining Life |
|---|---|---|---|---|---|
| L1-L2 HAZ (critical) | 28.0 | 16.5 | 16.1 | 0.4 mm | 0.05 mm at 23 months P10 |
| L1-L2 adjacent to HAZ | 28.0 | 18.2 | 16.1 | 2.1 mm | 0.8 mm at 23 months P10 |
| L2 general thinning (mean) | 28.0 | 22.7 | 16.1 | 6.6 mm | 5.3 mm at 23 months P10 |
The HAZ critical zone has only 0.4 mm of allowance to t_min at the reduced pressure — this falls to 0.05 mm at the P10 end of the 23-month window. The P10 margin is effectively zero at the HAZ critical point. This confirms that the 22-month operation at reduced conditions is the absolute limit: any further deferred turnaround (e.g., if the 2026 turnaround is postponed by a further 3 months) would reduce the HAZ point below t_min at P10, which is unacceptable under API 579-1.
Comparison Methodology
-
API 579-1 Level 2 cross-check: The Level 2 MFEA procedure (Part 4, Level 2) gives a minimum wall thickness assessment point of t_mm = 18.2 mm for the general thinning zone (not the pitted HAZ zone). With the corrected analytical t_min = 29.2 mm at design pressure, RSF = 18.2/29.2 = 0.62 — below the 0.9 minimum, confirming that Level 2 fails for the general thinning zone and Level 3 is required. The Level 3 FEM derives a MAWP_rd = 16.6 bar directly from the plastic collapse limit load (P_L = 58.2 bar), bypassing the analytical t_min formula entirely. This cross-check is included in the report to justify the Level 3 approach to the Authorised Inspector: the Level 3 FEM recovers a safe operating window that the Level 1/2 analytical methods cannot support for this degree of degradation.
-
Historical hydrotest validation: The 2019 geometry (derived from the previous AUT survey: mean minimum thickness 19.8 mm) is used to run the FEM under the 2019 hydrotest pressure of 26.5 bar. The FEM predicts P_L = 68.4 bar for the 2019 geometry, substantially exceeding the 26.5 bar test pressure. The 2019 hydrotest was passed (no leakage, no permanent deformation recorded) — consistent with the FEM prediction of a comfortable safety factor of 2.58 at hydrotest in 2019. This validation confirms that the FEM correctly captures the structural response of the vessel and that the material model (Annex F stress--strain curve) is appropriate.
-
NH4HS rate benchmarking: The MD-derived corrosion rate (0.18 mm/yr) is the higher-fidelity output that validates the API 932-B empirical correlation. API 932-B Figure 3 predicts 0.22--0.28 mm/yr for bare CS at 4.8 wt% NH4HS and 2.4 m/s — the MD model's lower value is physically consistent with the presence of a thin (2--4 nm) FeS scale that provides modest but measurable protection, a factor the empirical correlation does not capture. Published field data for CS in similar NH4HS service with partial FeS scaling report 0.17--0.24 mm/yr, further confirming the simulation output. The agreement (within 22% of the API 932-B midpoint) satisfies the acceptance criterion of within 25%.
Deliverables
-
API 579-1 Level 3 FFS report: Full assessment per API 579-1 Part 4 and Part 9 documentation requirements, including kriged thickness maps with uncertainty bounds, FEM model description and mesh quality report, load case results with stress and plastic strain contours, FAD plot with assessment point and sensitivity loci, probabilistic remaining life results, MAWP_rd calculation, and operating restrictions and monitoring requirements. Signed by a Texas-licensed Professional Engineer (PE) with pressure vessel FFS specialty endorsement, suitable for submission to the Authorised Inspection Agency and the Texas Department of Insurance, Division of Workers' Compensation.
-
FEM model and results package: newtsim Span input files (.inp), meshed geometry (.odb), full load case output databases (.odb), and Python post-processing scripts for stress extraction, TES limit load determination, and FAD data generation. Archived in a reproducible format for future re-analysis as conditions change.
-
FAD fracture assessment workbook: Microsoft Excel workbook with the FAD locus (Option 2, Ramberg--Osgood), the assessed point for the 2 mm flaw, and automated recalculation for user-specified flaw depths from 1 to 10 mm. Enables the Authorised Inspector to evaluate any future NDE finding against the FAD without requiring a new FEM run (valid within the sensitivity range established in the report).
-
Remaining life report: Probabilistic time-to-t_min distributions for Scenarios A and B with tabulated P10/P50/P90 values and CDF plots; recommendation for MAWP_rd; basis for the required wash water injection increase; and trigger levels for emergency shutdown (minimum measured wall on any spot UT check below 16.0 mm = immediate pressure reduction to 14 bar and emergency inspection).
-
Online monitoring plan for 22-month operation:
- UT spot checks at 6 critical locations (4 at L1-L2 HAZ zone, 2 at worst pitting locations): monthly by certified UT technician
- pH monitoring at overhead accumulator condensate sample point: continuous with 4-hourly logged data; alarm at pH below 7.0 (indicates wash water failure)
- NH4HS concentration monitoring at accumulator: weekly sample and titration analysis; action level above 5 wt% (increase wash water immediately)
- Pressure monitoring: automated historian with operating pressure controlled at 16.6 plus/minus 0.2 bar; high-pressure alarm at 17.0 bar; safety shutdown at 17.5 bar(g)
- Corrosion coupon: flat panel coupon at overhead nozzle N4 (highest velocity zone); 3-month retrieval intervals for weight-loss rate verification
-
Turnaround scope of work recommendation: Based on the current FFS assessment and the projected condition at month 22, the recommendation is: shell ring L1 (top 3 m) for full replacement with new SA-516 Gr. 70 plate (OWT 30 mm, providing 7 mm corrosion allowance at the new MAWP); shell ring L2 (next 3 m) for weld overlay repair of the L1-L2 HAZ zone (minimum 6.4 mm weld overlay in a 600 mm x 300 mm repair patch covering the critical HAZ), restoring local thickness to 22 mm or greater; post-repair hydrotest at 1.5 x MAWP_new = 1.5 x 21 = 31.5 bar(g) per ASME Section VIII Div. 1 UG-99. Estimated construction cost is 2.1M + weld overlay 45M emergency shutdown alternative.
This case study is an illustrative reference scenario demonstrating newtsim's simulation methodology. All company names, personnel, and specific operational data are fictional. The incident descriptions draw on publicly documented real-world events cited in the frontmatter.