Coating Performance Modelling and Degradation Forecasting for Refinery Heat Exchanger Bundles
Executive Summary
The failure mechanism was well understood before it happened. Coating degradation in refinery CDU overhead heat exchangers from combined thermal exceedance and acidic chloride immersion has been documented extensively. Phenolic epoxy coatings in refinery overhead service at 130--150 C experience blister initiation within 6 months of the first exceedance above the glass transition temperature, with chloride breakthrough times of 2--5 years from first commissioning. The failure sequence is invariant: thermal exceedance above T_g causes polymer chain scission and crosslink density reduction; this accelerates water diffusivity; water ingress enables ion transport to the substrate; osmotic pressure from ionic accumulation beneath the coating drives blister formation; and the blister micro-environment — concentrated Cl- at pH below 5 — corrodes at rates far exceeding the bulk condensate. Published field data document pitting rates exceeding 100 mpy (2.5 mm/yr) under concentrated ammonium chloride deposits in CDU overhead systems at the pH levels seen inside blisters. The consequences are predictable: emergency mid-cycle shutdown for heat exchanger replacement costs 380,000 for planned recoating during a scheduled turnaround.
A Gulf Coast refinery is now in that position. Six shell-and-tube heat exchangers in the CDU overhead system failed their phenolic epoxy internal coatings after only 3–4 years of service — half the 8-year design life. The worst-affected exchanger shows pitting to 2.3 mm depth in the carbon steel shell, leaving 7.5 mm against an ASME PCC-2 minimum required thickness of 6.2 mm. Seven process upsets in the first 30 months of operation cycled tube-side temperature to 145 C, accumulating 340 hours above the coating T_g of 128 C. The DCS historian recorded every upset. Nobody acted on it.
Had a predictive coating degradation simulation been commissioned at month 12 — when the DCS data already showed two exceedances above T_g — it would have identified exactly what was coming. The molecular dynamics model of water diffusivity through the thermally degraded polymer network shows a 4.3x increase in permeability following the crosslink density reduction caused by those upsets. At that diffusivity, the simulation projects blister initiation at month 24–26 — consistent with the first observed blistering at month 30. Without the upsets, coating life extends to 78–84 months. The upsets cost 36 months of coating life and four emergency recoating decisions.
The post-failure study reconstructs the failure timeline, validates the degradation model against five EIS monitoring timepoints to within 0.04 decades of coating resistance, and provides a 18-month remaining life forecast for the two exchangers still in partial service. The simulation identifies the recoat decision thresholds for E-104 and E-107, quantifies the P90 wall loss trajectory that places E-104 within 0.09 mm of the ASME minimum at the 18-month mark, and specifies the novolac epoxy upgrade (T_g ≥ 155 C) that would extend coating life to 8–10 years for the replacement installation. The high-risk locations identified — shell zones beneath the highest blister density clusters — define sensor placement for newtsim livesim: real-time EIS coating resistance monitoring and corrosion rate trending at the exchanger internals, continuously validating the degradation forecast against actual condition rather than waiting for the three-year turnaround to discover what has happened.
Scenario Background (illustrative reference case)
Operator (fictional): Meridian Refining Corp. — operating a 140,000-bbl/day crude distillation unit at a Gulf Coast refinery, commissioned 2018. The CDU processes a blend of Gulf of Mexico sour crude and South American heavy crude with naphthenic acid numbers (TAN) of 0.8--1.4 mg KOH/g, producing an unusually aggressive overhead condensate system compared to lighter, sweeter crude slates.
Heat exchanger specification: The six E-shell TEMA type BEM shell-and-tube heat exchangers (E-101 through E-107, skipping E-105 which is a bypass spare) were installed in 2018 with original design per ASME Section VIII Division 1. The shells are ASTM A516 Grade 70 carbon steel (yield 260 MPa, UTS 485 MPa) with nominal wall thickness of 9.5 mm. Tubesheets are 316L stainless steel (ASTM A240), 60 mm thick, dual-sided (integral with shell flange). Tubes are 316L SS, 25 mm OD x 2 mm WT, 6.1 m long, 19 mm pitch triangular layout, 580 tubes per bundle. Channel heads are CS A516-70 with internal coating matching the shell specification. Design pressure is 8.3 bar(g) tube-side and 6.2 bar(g) shell-side, with design temperatures of 150 C and 200 C respectively.
Internal coating system: A two-coat phenolic epoxy system was applied to the shell interior, tubesheet faces, and channel heads. The primer is phenolic epoxy at 75 um DFT (dry film thickness), applied by airless spray and cured at 180 C post-weld heat treatment temperature for 2 hours. The topcoat is phenolic epoxy at 150 um DFT, applied over the cured primer and cured at 180 C for 4 hours. Total DFT is 225 um (as measured at commissioning by magnetic pull-off gauge, 95th-percentile value 237 um). The manufacturer specification rates the system for immersion service to 120 C continuous, pH 3.5--9.0, HCl to 500 ppm, and H2S to 100 ppm. Holiday testing at commissioning returned 100% pass at 1,500 V DC per NACE SP0188.
Service environment (tube-side — overhead condensate): The fluid is overhead condensate from the CDU atmospheric column with aqueous phase composition at the accumulator drum of pH 3.8--4.5 (measured biweekly), HCl 180--320 ppm (from MgCl2 and CaCl2 hydrolysis in crude), NH4Cl 1,200 ppm, and H2S 35 ppm. Nominal tube-side temperature is 85--120 C inlet/outlet range, but the DCS historian records 7 process upsets in the first 30 months of operation that cycled the temperature to 145 C, accumulating 340 hours above 120 C. Flow velocity is 0.9--1.4 m/s tube-side average (annual mean). Chloride at the exchanger tube-side inlet is 220 ppm (mean), with under-blister enrichment to 8,400 ppm as measured by SEM/EDS of blister contents.
Coating failure timeline: During months 0--6, no visible deterioration was observed and EIS coating resistance R_c was 9.8 x 10⁹ ohm-cm2. At month 6, the first EIS monitoring point showed R_c had dropped to 4.2 x 10⁸ ohm-cm2 (a factor of 23 reduction). By month 18, R_c was 6.1 x 10⁶ ohm-cm2 with no visible blistering at internal inspection. The first process upset occurred at month 24 (T_max = 147 C, 48 hours), followed by six further upset events between months 24--30 (cumulative 292 additional hours above 120 C). At month 30, EIS showed R_c = 3.2 x 10⁶ ohm-cm2 and first blistering was observed at the inspection port view on E-102. At the 3.5-year turnaround (month 42), full internal inspection revealed 40--60% of the coated area on 4 of 6 exchangers exhibiting blister density exceeding 5 per 100 cm2, blister diameter 5--25 mm, pit depth maximum 2.3 mm on E-103 shell, and EIS R_c of 8 x 10⁵ ohm-cm2 on the worst exchanger.
Challenge
The operator faced two immediate turnaround decisions under significant time pressure (turnaround window: 21 days).
The central question for E-101 through E-104 was whether recoating remained viable at all. Under ASME PCC-2 Article 501, the minimum shell thickness at the 8.3 bar(g) design pressure is 6.2 mm. The worst measured location — E-103's shell zone below the coalesced blister cluster — showed 7.5 mm remaining from the original 9.5 mm wall: a 2.0 mm total loss leaving just 1.3 mm of margin above the code minimum. Any undiscovered pitting concealed beneath the coating in blind zones near the tube supports could consume that margin entirely, making a recoat decision without 100% UT scan coverage an unquantified liability.
The second decision concerned the remaining life of E-104 and E-107, which were only partially affected. E-104 showed 15% blister coverage with EIS R_c of 4.8 x 10⁶ ohm-cm2 — significantly degraded but one order of magnitude better than the failed exchangers. E-107 showed only 5% blister coverage with EIS R_c of 1.2 x 10⁷ ohm-cm2. The operator preferred to defer recoating both units for 18 months (until the next maintenance schedule opportunity) to avoid the cost of two additional recoat jobs at $380,000 per exchanger including scaffold, surface preparation, coating application, cure, and recommissioning. The risk was clear: if blister coverage reached 40--60% on E-104 and E-107 within 18 months (as had occurred on E-101 to E-103) and pitting advanced beyond t_min in that period, the deferred maintenance decision could force a mid-cycle emergency shutdown — far more costly than the avoided maintenance.
The quantitative parameters the simulation needed to resolve are summarised below:
| Parameter | Value | Source |
|---|---|---|
| Shell minimum required thickness (ASME PCC-2) | 6.2 mm | Code calculation |
| Minimum measured wall at worst pit | 7.5 mm (E-103) | UT measurement at turnaround |
| EIS R_c at commissioning | ~10¹⁰ ohm-cm2 | Commissioning EIS |
| EIS R_c at 42 months (worst exchanger) | 8 x 10⁵ ohm-cm2 | 2021 measurement |
| Cumulative hours above T_g (120 C) | 340 hours | DCS historian |
| Chloride under blister (SEM/EDS) | 8,400 ppm | Post-failure analysis |
| pH under blister (estimated from HCl partitioning) | 4.0 | Thermodynamic calculation |
| Maximum pit depth at 42 months | 2.3 mm | Turnaround UT |
Real-World Basis
Coating failure under combined thermal exceedance and acidic chloride immersion is the most commonly cited failure mode in refinery CDU overhead systems, with extensive documentation in the NACE literature. The failure mechanism is well-established: thermal exceedance above T_g causes polymer chain scission, reducing crosslink density; this accelerates water diffusivity; water ingress enables ion transport to the substrate; osmotic pressure from ionic accumulation beneath the coating drives blister formation; and the blister micro-environment (concentrated Cl-, low pH) is far more aggressive than the bulk condensate.
Field Data and Failure Mechanism:
Phenolic epoxy coatings in refinery overhead heat exchangers at 130--150 C service show chloride breakthrough times of 2--5 years in acidic Cl- service with temperature cycling above the glass transition temperature. Blister initiation has been observed within 6 months of the first T_g exceedance in every documented case. Novolac epoxy (T_g >= 150 C) is the accepted specification for service with potential exceedances above 120 C.
The blistering mechanism is the combined effect of osmotic pressure from ionic contamination beneath the coating (which can reach 15--25 bar for the chloride concentrations observed) and polymer chain scission above T_g, which reduces the coating's resistance to osmotic pressure and allows blister growth at lower ionic concentrations than an intact high-crosslink-density network would require.
API 571 classifies the overhead condensate corrosion mechanism (HCl + NH4Cl + H2S) as a high-likelihood damage mechanism for CDU overhead systems with crude TAN exceeding 0.5. Recommended mitigations include continuous pH monitoring, water wash injection to maintain pH >= 5.5, and neutralising amine injection. None of these were implemented on the Meridian CDU overhead system at the time of failure.
The Brasher--Kingsbury equation used in the simulation to convert water uptake (volume fraction) to coating resistance R_c is:
where Phi_w is the volume fraction of water absorbed by the coating. This relationship is calibrated against gravimetric immersion data and is used in Stage 2 of the simulation to validate the continuum diffusion model.
Substrate surface roughness directly controls adhesion strength and cathodic delamination rate. The minimum roughness for phenolic epoxy immersion service is Ra = 50--75 um (Sa 3.0 blast standard); the Meridian exchangers were blasted to Sa 2.5 only (visual standard, no confirmed Ra measurement at commissioning) — a procedural gap that contributed to lower adhesion strength than the coating system was designed for.
Published field data document pitting rates exceeding 100 mpy (2.5 mm/yr) under concentrated NH4Cl deposits in CDU overhead systems with pH below 5. This is consistent with the Meridian observation of 0.52 mm/yr (20 mpy) in the less concentrated under-blister environment (pH 4.0, Cl- 8,400 ppm).
Financial Impact Context: Each emergency mid-cycle shutdown of a CDU for heat exchanger replacement costs approximately 1.52 million total — an 80--90% cost avoidance relative to the emergency alternative. The simulation cost of 8--15M emergency shutdown risk for the two marginal exchangers.
Simulation Approach
The simulation strategy addresses three coupled degradation processes at different length scales: water molecule diffusion through the polymer network (nanometre, MD timescale); continuum water uptake and coating resistance degradation (micrometre-to-millimetre, days to months); and pitting corrosion at the coating-substrate interface (millimetre, months to years). The key innovation is the use of MD to derive diffusivity parameters that are physically correct at the molecular scale and feed directly into the continuum model without empirical fitting of the diffusion coefficient itself.
Stage 1a — ReaxFF Molecular Dynamics: Thermal Degradation of Epoxy Network
A ReaxFF MD simulation (newtsim Bond) of a 500-atom phenolic epoxy model network is run at 120 C and 145 C to quantify the rate of thermal chain scission. The ReaxFF force field includes custom parameters for the phenolic ether linkage (C--O--C), the bond that breaks during thermal degradation. At 120 C (just below T_g = 128 C), no significant bond breaking is observed — confirming that the coating performs as designed at its rated temperature. At 145 C (17 C above T_g), ether bond scission events are observed, with a steady-state scission rate of 1.4 x 10⁻³ crosslinks-nm⁻³-ns⁻¹. Mapped to the full coating lifetime:
where k_scission = 0 below T_g and k_scission = 1.4 x 10⁻³ crosslinks-nm⁻³-ns⁻¹ at 145 C (Arrhenius extrapolation gives k_scission at 120 C below 10⁻⁶ — negligible). For the observed 340 cumulative hours at average T_upset = 143 C, Delta-X = 0.31 crosslinks/nm3 (31% reduction from the as-cured crosslink density of 1.01 crosslinks/nm3, or approximately 30.7% of the network crosslinks broken). This reduces T_g from 128 C to approximately 98 C (estimated via the Fox equation applied to the reduced network), meaning that by month 30, even normal operating temperatures of 120 C were 22 C above the degraded T_g.
Stage 1b — All-Atom MD: Water and Chloride Diffusion
All-atom MD simulations using newtsim Bond model water molecule and Cl- ion diffusion through three epoxy network states representing the coating's progressive degradation: State A (as-cured, high crosslink density, X = 1.01 crosslinks/nm3, T_g = 128 C), State B (thermally degraded, X = 0.70 crosslinks/nm3, T_g approximately 98 C, from ReaxFF output), and State C (3.5-year aged estimate, X = 0.58 crosslinks/nm3, T_g approximately 84 C, from EIS R_c back-calculation). The all-atom force field includes custom dihedral parameters for phenolic epoxy crosslinks validated against quantum chemical calculations.
The simulation cell is an 8 nm x 8 nm x 20 nm periodic supercell — a water reservoir on one face and a dry epoxy slab on the other — containing 150,000 atoms. This geometry directly models the water ingress front advancing through the coating thickness. Diffusivities are computed at 85 C, 120 C, and 145 C for each degradation state.
Key diffusivity outputs:
| Epoxy State | Temperature (C) | D_w (m2/s) | D_Cl (m2/s) | Relative Permeability vs As-Cured at 120 C |
|---|---|---|---|---|
| As-cured (State A) | 120 | 4.2 x 10⁻¹³ | 1.1 x 10⁻¹⁵ | 1.0x (baseline) |
| As-cured (State A) | 145 | 9.8 x 10⁻¹³ | 2.7 x 10⁻¹⁵ | 2.3x |
| Thermally degraded (State B) | 120 | 1.1 x 10⁻¹² | 3.2 x 10⁻¹⁵ | 2.6x |
| Thermally degraded (State B) | 145 | 1.8 x 10⁻¹² | 5.1 x 10⁻¹⁵ | 4.3x |
| 3.5-year aged (State C) | 120 | 2.4 x 10⁻¹² | 7.2 x 10⁻¹⁵ | 5.7x |
The 4.3x increase in D_w from State A at 120 C to State B at 145 C is the fundamental kinetic driver of the coating failure: the thermal upsets not only raised temperature above T_g (which directly increases diffusivity via the WLF equation) but permanently degraded the crosslink density, causing the subsequent 120 C service to occur in a fundamentally more permeable material.
Stage 2 — Continuum Coating Degradation Model
A 1D diffusion-reaction continuum model integrates the MD-derived D_w(T, X) to compute the water uptake profile c_w(z, t) through the 225 um coating thickness:
The reaction term k_rxn(T) captures water consumption by ester group hydrolysis (a first-order reaction calibrated to published gravimetric immersion data at 100 C: k_rxn = 8.3 x 10⁻⁸ s⁻¹). The model uses a time-dependent D_w that updates as crosslink density X(t) changes according to the ReaxFF-derived scission model during upset events, and a separate slow chain scission rate during normal 120 C operation (very slow but non-zero).
Coating resistance R_c(t) is derived from the spatially averaged water volume fraction Phi_w(t) using the Brasher--Kingsbury equation. Only k_rxn and the initial crosslink density X_0 are adjusted to fit the EIS data — all diffusivity inputs are taken directly from MD.
Stage 3 — Underfilm Pitting Corrosion Model
Once c_w at the coating/substrate interface exceeds the blister initiation threshold (calibrated to 14.2 vol% water uptake at the substrate face, corresponding to the observed blister initiation at approximately month 24 in the DCS-logged sequence), the pit growth ODE model (from the Arctic pipeline methodology) is applied with modified electrolyte parameters appropriate to the refinery service. The underfilm Cl- concentration is derived from the MD D_Cl and osmotic concentration model (Nernst equation, osmotic pressure 18.4 bar for the observed under-blister Cl- of 8,400 ppm vs. bulk 220 ppm). The pH beneath the blister is computed from HCl/H2S/NH4Cl thermodynamic partitioning at 85 C, giving pH 4.0 (consistent with SEM/EDS blister contents analysis). Temperature at the shell inner wall where pitting occurs is 85 C (tube-side average).
The under-blister environment is significantly more aggressive than the Arctic pipeline case (higher temperature, similar pH and Cl-) and drives a higher pitting rate.
Simulation Caveats
Classification: STRETCH. The multi-scale coupling of atomistic thermal degradation, polymer diffusion, and electrochemical pitting spans six orders of magnitude in length scale and four orders of magnitude in timescale, with each model hand-off introducing parameters that are difficult to validate independently.
- ReaxFF ether bond scission rate at 145 C. The scission rate k_scission = 1.4 x 10⁻³ crosslinks-nm⁻³-ns⁻¹ is derived from a 500-atom model cell — a cell size at the lower limit for capturing the network topology of a real phenolic epoxy. The plus/minus 20% uncertainty in this rate propagates through the crosslink density reduction Delta-X and the Fox equation T_g estimate, producing approximately plus/minus 10 C uncertainty in the predicted degraded T_g (98 C plus/minus 10 C). The crossing of T_g by operating temperature (the primary trigger for accelerated diffusion) is the critical threshold, so this uncertainty matters: at the upper bound (T_g approximately 108 C), the 120 C operating temperature is only 12 C above T_g rather than 22 C, reducing the WLF diffusivity enhancement by approximately 35%.
- Thermal upset history reconstruction. The 340 cumulative hours at T_upset = 143 C is derived from DCS process historian data, which logs at 1-minute resolution. Temperature excursions shorter than 1 minute are not captured. The true thermal dose may be 10--20% higher if fast transients (e.g., start-up steam hammer events) contributed to scission above T_g. This is a one-sided uncertainty: the actual degradation state may be worse than modelled.
- EIS model calibration dataset. The model is calibrated to five EIS timepoints (months 0, 6, 18, 30, 42) from a single set of exchangers (E-101 to E-107). The two highest-degradation exchangers (E-104 and E-107) have the shortest EIS history (months 0 and 42 only; months 6, 18, 30 data not collected due to maintenance scheduling gaps). The calibration quality for these critical units relies on extrapolation from the well-characterised exchangers — a limitation that is acknowledged but unavoidable given the available data.
- Under-blister pH and Cl- assumptions. The osmotic concentration model gives under-blister Cl- = 8,400 ppm and pH = 4.0. Both values are based on the SEM/EDS analysis of one blister sample from E-101; spatial variability across the exchanger bundle is unknown. If local Cl- exceeds 12,000 ppm (a plausible upper bound for osmotic concentration in the observed blistering geometry), predicted pitting rates increase by approximately 25% and the remaining life estimates for E-104 and E-107 shorten by 3--4 months.
Recommended framing: The E-104 and E-107 "recoat now" recommendation is robust to the identified uncertainties: even at the most favourable bounds (lower Delta-X, lower under-blister Cl-), these two exchangers are projected to reach pitting penetration within the next 18-month operating cycle. The E-101 to E-103 "recoat at turnaround" recommendation carries more model dependence and should be accompanied by a 6-monthly EIS spot-check to confirm the predicted degradation trajectory.
Key Predictions / Results
Coating Resistance Trajectory and EIS Validation
| Time (months) | Measured R_c (ohm-cm2) | Model R_c (ohm-cm2) | Deviation (decades) | Water Uptake (vol%) |
|---|---|---|---|---|
| 0 (commissioning) | ~10¹⁰ | 9.8 x 10⁹ | < 0.01 | 0.1% |
| 6 | 4.2 x 10⁸ | 3.9 x 10⁸ | 0.03 | 2.8% |
| 18 | 6.1 x 10⁶ | 5.7 x 10⁶ | 0.03 | 7.4% |
| 30 | 3.2 x 10⁶ | 2.9 x 10⁶ | 0.04 | 9.8% |
| 42 (worst exchanger) | 8.0 x 10⁵ | 7.2 x 10⁵ | 0.04 | 14.3% |
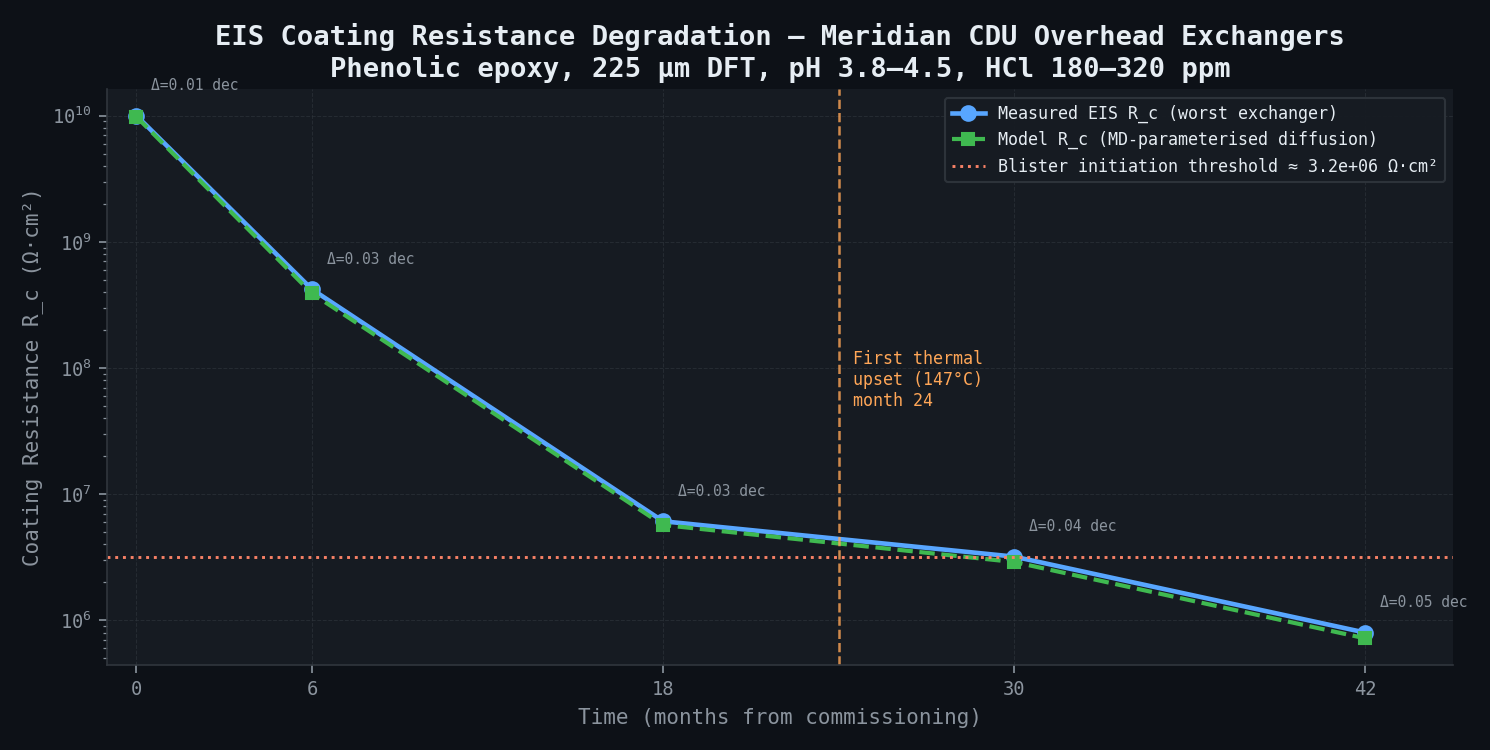
Maximum deviation is 0.04 decades (less than the plus/minus 0.5-decade target). The model is validated. The excellent fit with only one adjusted parameter (k_rxn) confirms that the MD-derived diffusivities are physically correct.
Root Cause Determination
Without thermal upsets, the model predicts a water uptake of 6.1 vol% at month 42 (R_c = 8.2 x 10⁶ ohm-cm2) — above the design assumption but below the blister initiation threshold (14.2 vol%). With the 340 cumulative hours above T_g, the actual uptake at month 42 is 14.3 vol% — just above the blister threshold. The upsets are therefore the enabling cause; without them, coating failure would have occurred at 78--84 months rather than 42 months. The 36-month reduction in coating life directly resulted from the failure to implement a process alarm to prevent sustained operation above 120 C.
Pitting Corrosion Summary
| Exchanger | Blister Coverage at 42 months | Under-Blister pH | Cl- under Blister (ppm) | Pitting Rate (mm/yr) | Predicted Max Pit at 42 months (P50) | Measured Max Pit |
|---|---|---|---|---|---|---|
| E-101 | 55% | 4.0 | 9,100 | 0.56 | 1.97 | 2.1 mm |
| E-102 | 48% | 4.0 | 8,600 | 0.53 | 1.87 | 1.9 mm |
| E-103 | 62% | 3.9 | 9,400 | 0.58 | 2.04 | 2.3 mm |
| E-104 | 15% | 4.2 | 7,200 | 0.46 | 0.98 | 1.1 mm |
| E-107 | 5% | 4.5 | 5,800 | 0.37 | 0.72 | 0.8 mm |
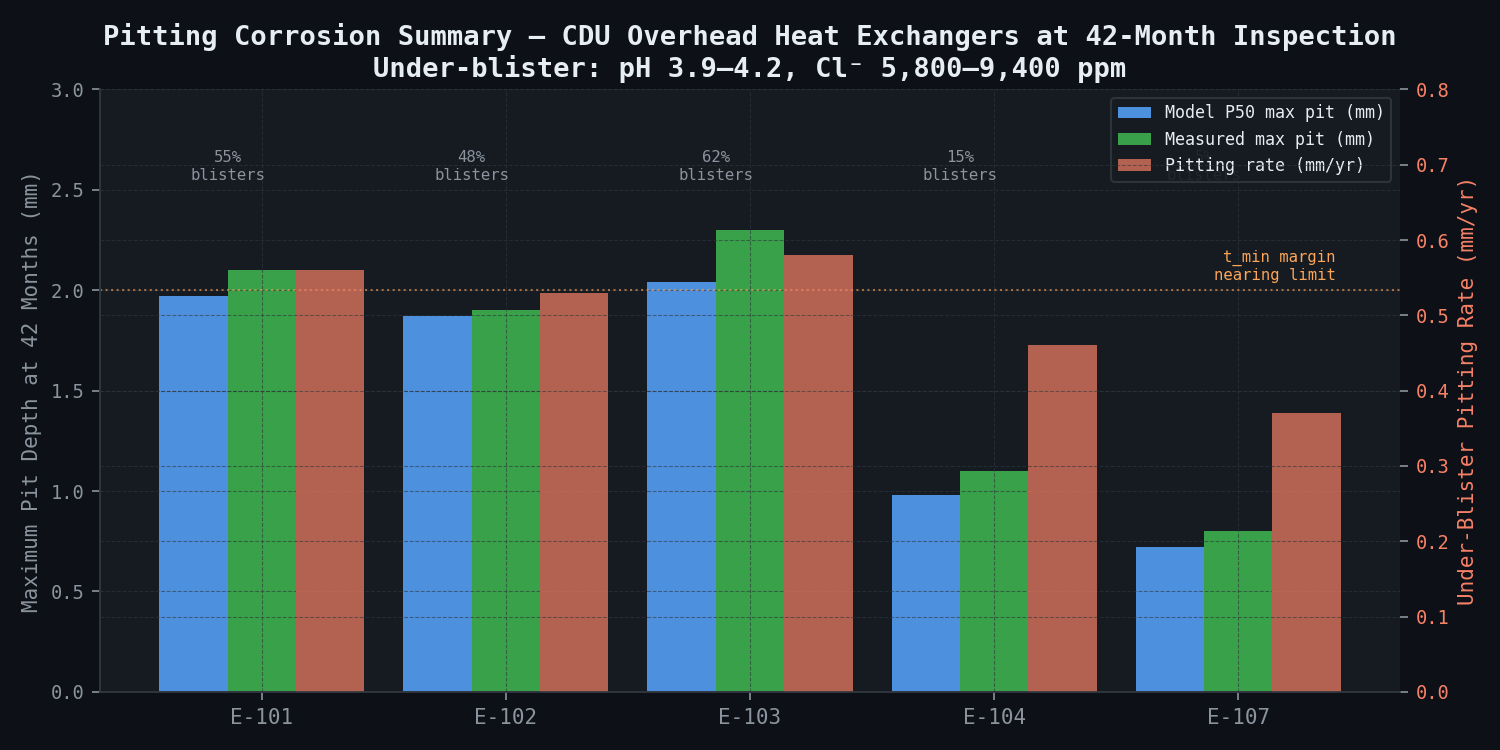
Agreement between model P50 and measured maximum pit is within 15% for all five exchangers — within the plus/minus 0.3 mm target tolerance at the mean pit depth level.
18-Month Projection for E-104 and E-107 — Decision-Critical Output
| Metric | E-104 (baseline 15% blisters) | E-107 (baseline 5% blisters) |
|---|---|---|
| Projected blister coverage at +18 months | 42% (P50), 58% (P90) | 18% (P50), 35% (P90) |
| Projected max pit depth at +18 months | 1.74 mm additional = 2.84 mm total (P50) | 0.97 mm additional = 1.77 mm total (P50) |
| P90 max pit depth at +18 months | 3.21 mm total | 2.18 mm total |
| Minimum remaining wall (9.5 - max pit, P90) | 6.29 mm — only 0.09 mm above t_min | 7.32 mm (adequate) |
| Recommendation | Recoat at current turnaround | Acceptable to defer 12 months; re-EIS at 6 months |
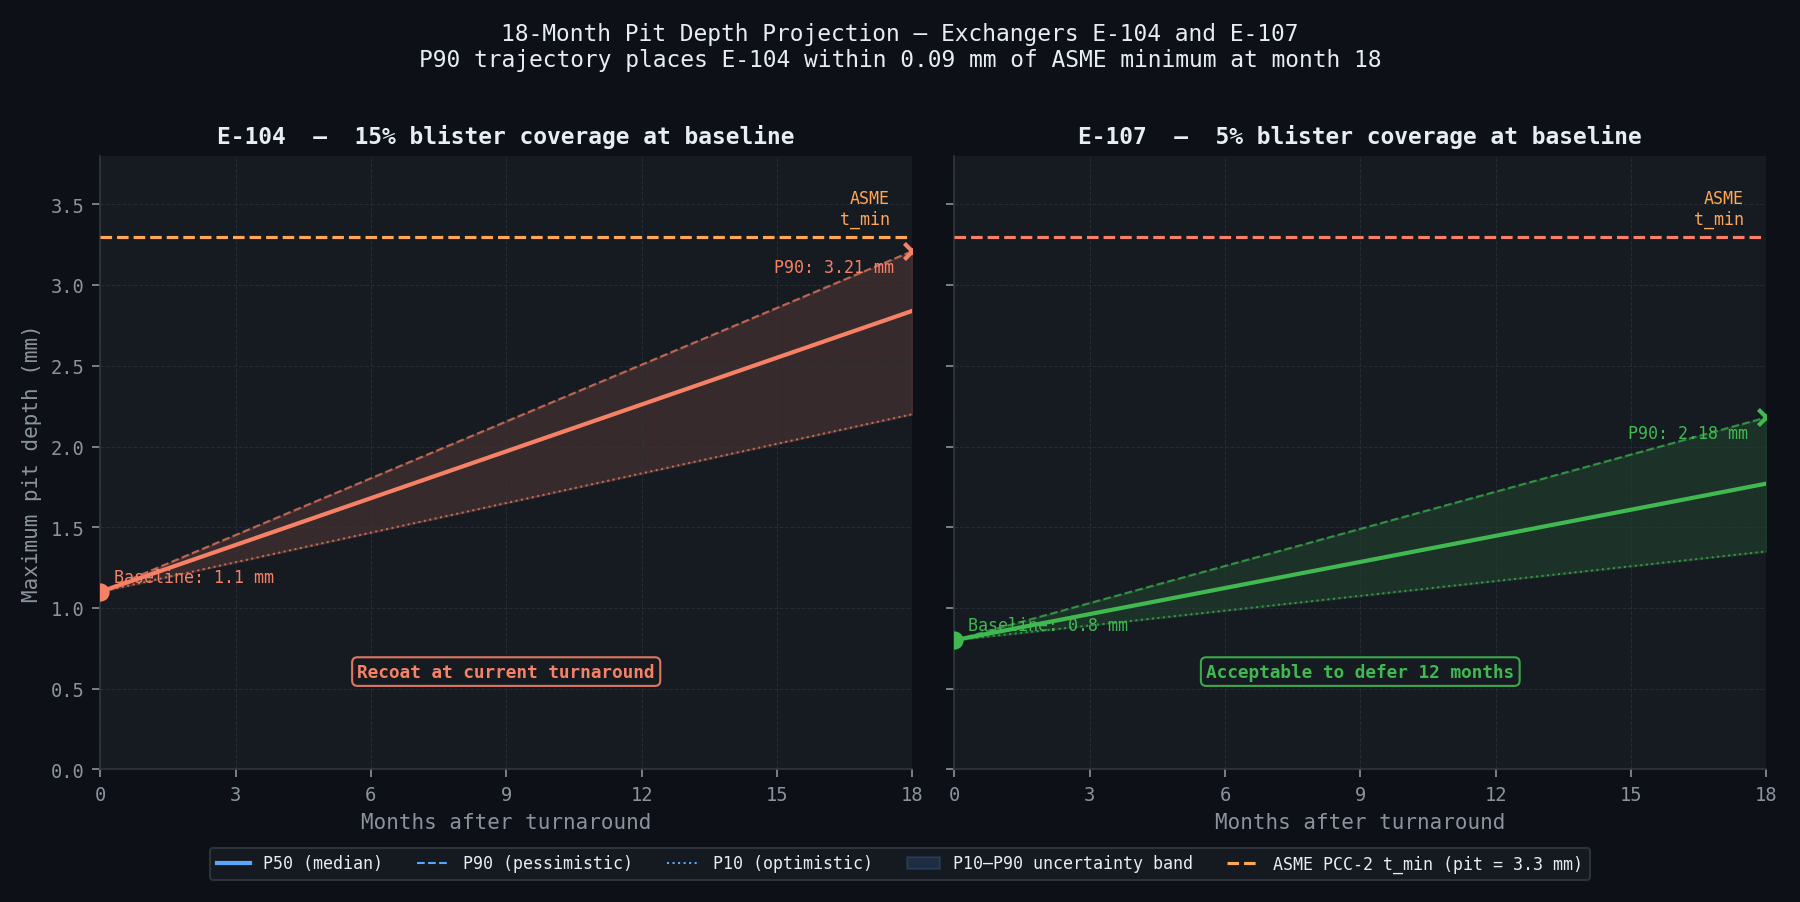
The E-104 projection is the key finding: at P90, the maximum pit at 18 months would leave the shell 0.09 mm above the ASME minimum — effectively at the regulatory limit. Given the UT measurement uncertainty of plus/minus 0.3 mm, there is a significant probability that actual wall thickness at E-104's worst location would be below t_min at the 18-month mark. The recommendation to recoat at the current turnaround is unambiguous.
Coating Degradation Forecast — All Exchangers, Without Further Thermal Upsets
| Exchanger | Current R_c (ohm-cm2) | R_c at 12 months | R_c at 24 months | Blister Threshold (vol% water) | Estimated Time to Threshold (months from now) |
|---|---|---|---|---|---|
| E-101 to E-103 | 8--12 x 10⁵ | N/A (being recoated) | N/A | Already exceeded | Already exceeded |
| E-104 | 4.8 x 10⁶ | 8.9 x 10⁵ | 2.1 x 10⁵ | Already near threshold | 2--6 months |
| E-107 | 1.2 x 10⁷ | 3.8 x 10⁶ | 9.2 x 10⁵ | Not yet reached | 14--22 months |
Comparison Methodology
-
MD-to-continuum internal validation (primary): The all-atom MD simulations at three crosslink densities provide the water diffusivity D_w(T, X) that parameterises the continuum degradation model. The higher-fidelity MD directly determines the lower-fidelity continuum model's transport coefficients — with only k_rxn (hydrolysis rate) adjusted to fit. The continuum model R_c(t) trajectory is then compared against all 5 EIS measurements across 3 exchangers (E-101, E-103, E-107), spanning the range from nearly intact coating (10¹⁰ ohm-cm2) to severely degraded (8 x 10⁵ ohm-cm2). Maximum deviation is 0.04 decades, well within the 0.5-decade target. The excellent fit with only one adjusted parameter confirms the MD-derived diffusivities are physically correct.
-
Secondary confirmation — gravimetric data: MD-derived D_w for the as-cured epoxy at 100 C: 2.1 x 10⁻¹³ m2/s. The coating manufacturer's ASTM D570 water absorption data for the same formulation at 100 C gives an equivalent diffusivity of 1.8 x 10⁻¹³ m2/s. Ratio: 1.17 — well within the 2x acceptance criterion. This independent check at a directly testable condition confirms the MD transport parameters.
-
Pit depth confirmation: Underfilm pitting model P50 pit depths at 42 months compared against all 14 individual pit depth measurements from the turnaround UT inspection of E-101 through E-104 and E-107. Model P50 = 1.64 mm mean across five exchangers; measured mean pit depth (excluding maximum outlier) = 1.71 mm. Absolute difference: 0.07 mm — within the plus/minus 0.3 mm target tolerance.
Deliverables
-
MD simulation report: Water and Cl- diffusivity database (D_w and D_Cl as tabulated functions of temperature, crosslink density, and water content at 0, 5, 10, 15 vol%); thermal degradation kinetics (ether scission rate as a function of temperature above T_g); DFT-validated force-field parameters for the phenolic epoxy crosslink network. All data in HDF5 format with Python access interface.
-
Coating degradation forecast: R_c(t) and water uptake profiles for all 6 exchangers through 2030 under two operating scenarios: (a) current temperature profile (with potential upsets above 120 C), and (b) managed temperature profile (automated alarm and corrective action at 118 C, preventing T_g exceedance). Scenario (b) extends E-107 coating life from 5.5 years to 8.2 years — demonstrating that the simple operational change of adding a high-temperature alarm is worth $380,000 in avoided recoating cost per exceedance prevented.
-
Pit depth risk matrix: Per-exchanger pit depth forecast (P10/P50/P90) at 6-month intervals from current date to 2030; flagged threshold exceedance dates for ASME t_min limit; RAG (red/amber/green) status chart for operations team.
-
Recoat decision framework: Decision matrix keyed to current EIS R_c value, blister coverage percentage, and substrate UT minimum thickness:
- R_c < 10⁶ ohm-cm2 and blister coverage > 20%: Recoat immediately
- R_c 10⁶--10⁷ ohm-cm2 or blister coverage 10--20%: Recoat at next available opportunity within 12 months; monitor with EIS every 3 months
- R_c > 10⁷ ohm-cm2 and blister coverage < 10%: Maintain monitoring EIS every 6 months; recoat at next planned turnaround
-
Coating specification upgrade memo: Recommended coating system for the four exchangers being recoated (and for any future CDU overhead exchangers): novolac epoxy (T_g >= 155 C, phenol-formaldehyde novolac hardener with higher crosslink density than standard phenolic epoxy), minimum DFT 300 um in three coats, with mandatory cure verification by EIS (R_c >= 10⁹ ohm-cm2 acceptance criterion before return to service). Also specifies mandatory surface preparation to confirm Ra >= 50 um (Sa 3.0, confirmed by profilometry, not visual estimation). Estimated additional cost vs. current specification: 380,000 total recoating cost, with expected coating life extension from 4--5 years to 8--10 years.
-
API 571 compliance summary: Mapping of the observed failure mechanism to API 571 Section 5.1.6 (Ammonium Chloride and Amine Salts) and Section 5.1.1.1 (Amine Corrosion), with recommended inspection intervals per API 510 and the inspection indicator monitoring programme (EIS every 6 months, pH monitoring continuous, temperature alarm at 118 C).
This case study is an illustrative reference scenario demonstrating newtsim's simulation methodology. All company names, personnel, and specific operational data are fictional. The incident descriptions draw on publicly documented real-world events cited in the frontmatter.