Probabilistic CO2 Storage Capacity Estimation for UK North Sea Depleted Gas Reservoir
Executive Summary
When Chevron's Gorgon CCS project filed its initial Dupuy Formation capacity assessment, it used a deterministic storage efficiency factor of E = 0.08 — a single number, no uncertainty range, no Monte Carlo distribution, no P10/P50/P90 envelope. Between August 2019 and August 2024, the project stored approximately 10 Mt CO2 against a target of roughly 23 Mt. Back-calculation from the actual performance implies an effective E of approximately 0.025–0.035 — consistent with the NETL P10 value for depleted reservoirs and less than half the E = 0.08 used in the original capacity assessment. The project was not inadequately characterised in terms of geology; it was inadequately characterised in terms of what geologists and reservoir engineers genuinely do not know about sweep efficiency and aquifer connectivity before injection begins. A deterministic E value suppresses that uncertainty and produces a capacity number that looks precise but carries no confidence interval. When the reservoir proves closer to P10 than P50, the operator is holding a number they cannot defend to regulators, industrial emitter customers, or investors. The NSTA and Australia's Clean Energy Regulator now both cite the Gorgon capacity assessment methodology as the primary motivation for mandating full probabilistic treatment with Monte Carlo documentation as a standard condition of storage site approval. The UK's first carbon storage licensing round in September 2023, which awarded 21 licences in the Central, Northern, and Southern North Sea, embedded NETL 2019 methodology compliance as a non-negotiable requirement for all Track 1 applications.
The UK programme's stated goal is 20–30 Mt CO2/yr of storage capacity operational by 2030. To reach that target, the NSTA needs to permit roughly 4–6 Dunbar Sands-scale structures — mature depleted gas fields with well-understood geology, proven 4-way dip closures, and Zechstein evaporite caprocks so impermeable that fracture gradient at 52 MPa is not a binding constraint. What those structures need, before a Cluster Sequencing Track 1 application can be filed, is a certified probabilistic capacity estimate with a P10 above 50 Mt and a documented NETL 2019 compliance certificate. The consequence of not having that certificate is not a delay — it is rejection.
Had a full probabilistic capacity study been run on the Gorgon Dupuy Formation before the project commitment was finalised — with a Monte Carlo distribution on storage efficiency factor, aquifer connectivity uncertainty propagated through a 200-realisation ensemble, and P10/P50/P90 capacity bounds documented — the P10 of approximately 0.025–0.035 would have been visible before a single tonne was injected. Industrial customers signing long-term storage agreements would have been priced against the P10 case, not the P50. Injection rate commitments would have been set conservatively enough to accommodate the actual aquifer connectivity. The Clean Energy Regulator compliance schedule would have been designed around a realistic trajectory. None of those adjustments would have prevented Gorgon from being a commercially challenging project — but they would have prevented it from becoming the defining negative example for CCS capacity assessment credibility.
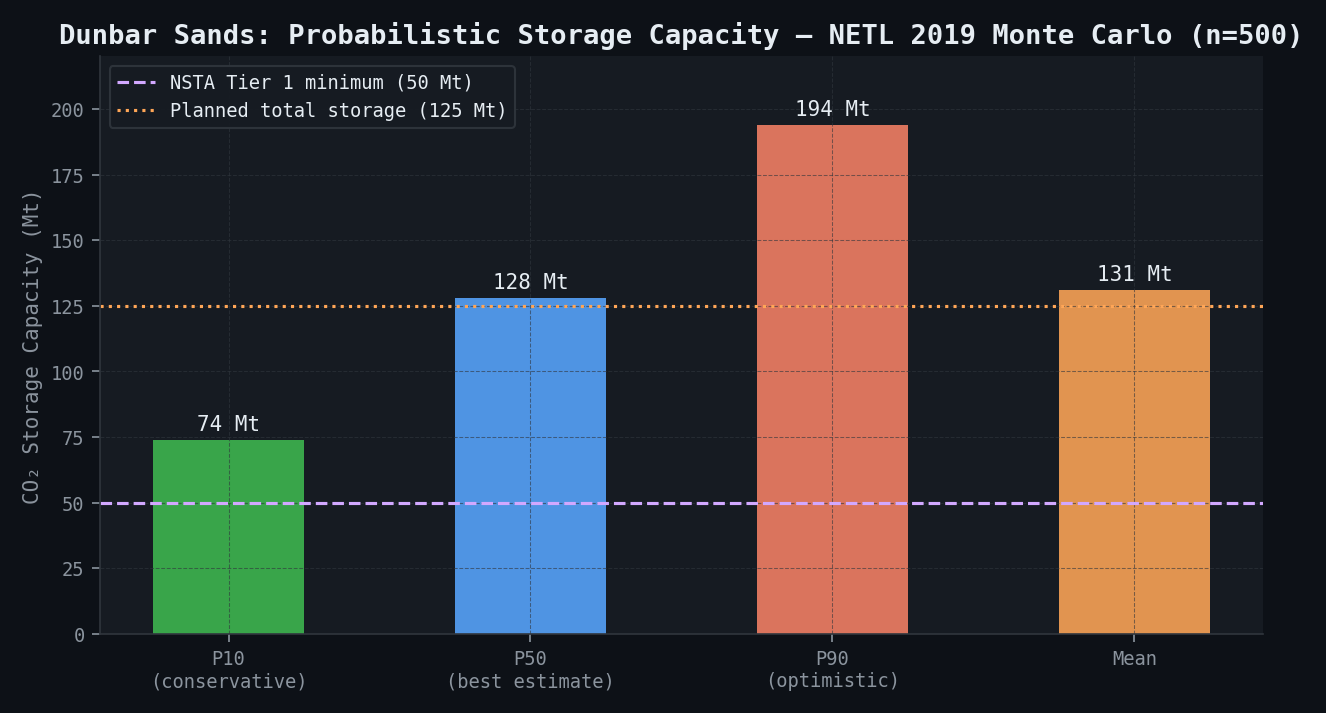
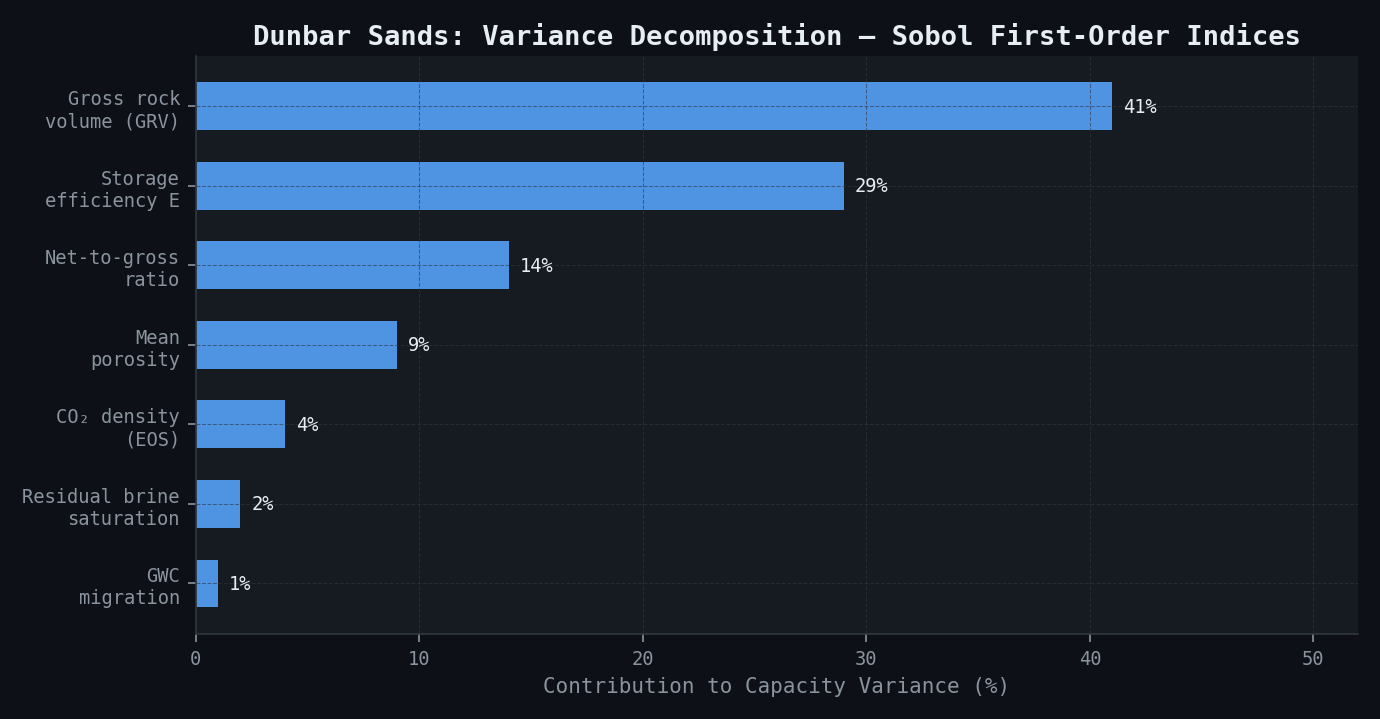
The study delivers a P50 storage capacity of 128 Mt CO2 (P10: 74 Mt, P90: 194 Mt) with a coefficient of variation of 0.39, qualifying the structure as a Tier 1 UK storage site under NSTA criteria. The P10 of 74 Mt — the conservative underwrite for industrial emitter agreements — exceeds the NSTA minimum threshold of 50 Mt and supports a 25-year storage agreement at 5 Mt CO2/yr with the Humber industrial cluster. The study also identified that 120 km2 of additional eastern flank seismic reduces the P90–P10 capacity range from 120 Mt to approximately 72 Mt, lifting the conservative P10 to approximately 95 Mt and potentially unlocking significantly more attractive terms for long-term industrial emitter contracts. The simulation's identified uncertainty drivers — gross rock volume on the eastern flank dominating at 41 % of total variance, storage efficiency factor second at 29 % — define the data acquisition priority and the sensor placement for newtsim livesim: real-time pressure monitoring at all four injection wells to track the actual pressure response against the P50 aquifer model, surface InSAR benchmarks to detect early plume migration toward the structural spill point, and annual 4D seismic surveys timed to the model-predicted plume front arrival at the eastern flank monitoring boundary.
Scenario Background
The operator in this scenario is a wholly owned subsidiary of a major North Sea oil and gas company, established specifically to develop the parent's portfolio of depleted field assets as CO2 storage sites under the UK Government's North Sea Transition Deal obligations. The parent company holds abandonment liabilities for 14 depleted fields in the UKCS; converting these fields to CO2 storage sites represents both a commercial opportunity and a mechanism to offset abandonment cost against storage licence revenue.
The target structure -- referred to here as Dunbar Sands (a fictionalised composite representative of Southern North Sea Rotliegend assets) -- is the flagship project. It sits within a Cluster Sequencing bid area, linked by pipeline to an industrial emitter cluster on the Humber Estuary comprising steel, cement, and chemical manufacturing facilities with combined annual emissions of approximately 8 Mt CO2/yr. The target injection rate of 5 Mt CO2/yr would serve approximately 63 % of the cluster's emissions.
| Parameter | Value | Source |
|---|---|---|
| Formation | Rotliegend Group sandstone (aeolian dune facies) | Regional stratigraphy |
| Structural trap | 4-way dip closure | 3D seismic interpretation |
| Top reservoir depth | 2850 m | Well data |
| Gross reservoir thickness | 120 m | Well correlation (11 wells) |
| Net sand thickness | 88 m | Net-to-gross 0.73 |
| Porosity (log-derived) | 15--24 % (mean 19.2 %) | Log data, 11 wells |
| Permeability | 10--600 mD (bimodal; geometric mean 85 mD) | Core plugs |
| Permeability bimodality | High-k aeolian foresets vs. low-k interdune | Facies interpretation |
| Original gas in place | 4.8 Tcf | Development-era volumetrics |
| Cumulative gas production | 4.4 Tcf | NSTA production database |
| Field recovery factor | 92 % | -- |
| Current reservoir pressure | 12.6 MPa | Recent well test |
| Original reservoir pressure (at discovery) | 28.4 MPa | Discovery well DST |
| Pressure depletion | 15.8 MPa below original | -- |
| Reservoir temperature | 92 C | BHT corrected |
| Formation water | Na-Cl, 85 g/L TDS | Formation water analysis |
| Aquifer extent | ~80 km south of structure | Regional hydrodynamic study |
| Caprock | Zechstein anhydrite and halite | Regional stratigraphy |
| Caprock thickness | 150--220 m | Seismic and well data |
| Caprock fracture gradient | 52 MPa at reservoir depth | Regional stress data + LOT |
| Structure area at spill point | 84 km2 | Seismic interpretation |
| Spill point depth | 2980 m | Seismic interpretation |
| Planned injection rate | 5.0 Mt CO2/yr | Operator design (ramp-up over 3 years) |
| Planned injection period | 25 years | Cluster Sequencing agreement |
| Planned total storage | 125 Mt CO2 | -- |
| Number of injectors | 4 | Operator design |
Challenge
Probabilistic capacity estimation for a depleted gas reservoir presents different challenges from a virgin saline aquifer, because the pre-existing hydrocarbon production history provides both additional information (better reservoir characterisation from 11 wells and 40+ years of production data) and additional complexity (migrated water contacts, pressure depletion, brine re-saturation of the gas cap). Three specific challenges drove the study scope.
The first challenge concerned the migrated water-gas contact and brine re-saturation. When the field was produced, the gas-water contact (GWC) rose as gas was withdrawn, allowing the aquifer to partially re-saturate the lower portion of the gas column. The post-depletion GWC is estimated to have migrated approximately 35 m upward (from 2965 m to approximately 2930 m sub-sea). This reduces the "dry" gas-bearing pore volume available for CO2 occupancy -- CO2 injected into a brine-filled pore must displace the brine (less efficient than displacing gas), and the GWC migration is uncertain (+/-12 m standard deviation, based on pressure history modelling). The Endurance structure (Net Zero Teesside, Bunter Sandstone Formation) provided the methodological precedent for treating brine re-saturation explicitly: the 2021 storage assessment for Endurance treated the volume of brine-re-saturated pore space as a separate capacity category with a lower efficiency factor than the dry gas cap volume. This approach was adopted for the Dunbar Sands assessment.
The second challenge was geological uncertainty on the eastern flank. Eleven wells penetrate the reservoir, but their distribution is asymmetric: 9 wells are on the western and central crest (where the development wells were drilled for gas production), and only 2 wells on the eastern flank. The aeolian dune facies architecture -- with high-porosity dune foresets and lower-porosity interdune and wadi deposits -- generates significant inter-well uncertainty in the eastern sector. The P90-to-P10 range in original gas in place from the development-era static model was 3.1--7.2 Tcf, implying a factor-of-2.3 volume uncertainty driven primarily by the eastern flank.
The third challenge was regulatory methodology compliance. The UK Storage of Carbon Dioxide (Licensing) Regulations 2010 require that capacity estimates be certified using a methodology consistent with the NETL Best Practice Manual for Geologic Storage of CO2 (2019 edition). The 2019 NETL methodology specifies Monte Carlo propagation of all uncertain volumetric parameters, a storage efficiency factor (E) drawn from a distribution rather than a deterministic value, CO2 density calculated at reservoir P-T conditions using a validated EOS, and the capacity estimate reported as GCO2 at three percentile points: P10 (conservative), P50 (best estimate), and P90 (optimistic). The Gorgon project's capacity estimation failure -- where a deterministic E = 0.08 was used without uncertainty quantification and actual performance was consistent with E = 0.03 -- reinforced for regulators the importance of full probabilistic treatment. The NSTA now requires Monte Carlo documentation as standard.
Real-World Basis
This study draws on three primary real-world references for methodology and parameter calibration.
Reference 1 -- UK Endurance Structure (White Rose CCS / Net Zero Teesside):
The Endurance structure in the Southern North Sea (Bunter Sandstone Formation, 800--1200 m depth) was assessed for CO2 storage capacity in 2019--2021 as part of the Net Zero Teesside project. The Carbon Capture & Storage Association's 2021 assessment established the UK's gold-standard methodology for probabilistic capacity in Southern North Sea Bunter Closure structures. The key lesson applied here is that volumetric capacity in depleted structures is highly sensitive to the assumed initial brine re-saturation of the formerly gas-bearing pore volume. Early Endurance assessments treated the entire gas cap volume as available for CO2; revised assessments explicitly modelled GWC migration and assigned a lower storage efficiency to the brine-re-saturated zone (approximately 30--40 % lower efficiency than the dry zone). This correction reduced P50 capacity estimates by approximately 12--18 % at Endurance and was applied with analogous parameterisation to Dunbar Sands.
Reference 2 -- NETL Regional Carbon Sequestration Partnerships:
The US Department of Energy's Regional Carbon Sequestration Partnerships produced Monte Carlo capacity assessments for multiple depleted gas fields in the Midwest Regional Carbon Sequestration Partnership (MRCSP) and Southeast Regional Carbon Sequestration Partnership (SECARB). These established the benchmark storage efficiency factor distribution for depleted gas reservoirs under the NETL 2019 methodology:
| Storage Efficiency Factor (E) | Depleted Gas Reservoirs (NETL 2019) |
|---|---|
| P10 (conservative) | E = 0.025 |
| P50 (best estimate) | E = 0.051 |
| P90 (optimistic) | E = 0.110 |
| Distribution shape | Triangular (min=0.02, mode=0.05, max=0.12) |
The P50 value of E = 0.051 reflects the combined effect of heterogeneous sweep (CO2 does not contact all pore volume), CO2 dissolution into brine, and structural vs. stratigraphic trapping geometry.
Reference 3 -- NSTA CO2 Stored Database (Crown Estate / BGS):
The NSTA Southern North Sea storage atlas (2023) characterised 28 potential depleted gas field storage sites in the Rotliegend Group, including Leman Sandstone Formation fields analogous to the Dunbar Sands structure. Key published statistics from the atlas that were used as prior distributions for the geostatistical model:
| Parameter | NSTA Atlas Southern North Sea Rotliegend (P10--P90) | Dunbar Sands (this study) |
|---|---|---|
| Net-to-gross ratio | 0.55--0.88 | 0.73 (mean) |
| Mean porosity | 12--22 % | 19.2 % (mean) |
| Geometric mean permeability | 25--300 mD | 85 mD (geometric mean) |
| Storage efficiency factor E | 0.03--0.09 | 0.054 (P50 study result) |
| P50 theoretical capacity (per field) | 50--250 Mt | 128 Mt (this study) |
| Combined Southern North Sea P50 capacity | 15 Gt | -- |
The NSTA atlas's reported total UK offshore storage capacity (P50 = 78 Gt, with Central North Sea contributing 40 Gt and Southern North Sea 15 Gt) provides the policy context: the UK needs to develop approximately 0.3--0.5 Gt/yr of CCS capacity by 2035 to meet its North Sea Transition Deal commitments, implying approximately 100--170 sites of Dunbar Sands scale being permitted and operational within a decade.
Reference 4 -- Gorgon capacity estimation failure (cautionary):
The Gorgon CCS project's initial Dupuy Formation capacity estimate used a deterministic storage efficiency factor of E = 0.08 without uncertainty quantification. The project's actual performance between 2019 and 2024 (approximately 10 Mt injected against ~23 Mt target) suggests an effective E of approximately 0.025--0.035 -- consistent with the NETL P10 value and well below the Gorgon P50 assumption. This example is now cited by the NSTA and Clean Energy Regulator as the primary motivation for mandatory probabilistic capacity assessments.
Simulation Approach
The simulation workflow combined geostatistical uncertainty modelling, Monte Carlo capacity estimation, and targeted dynamic reservoir simulation for injection feasibility confirmation:
\subsection{Geostatistical Reservoir Model}
A 3D geostatistical model was constructed using newtsim Pack with Gaussian simulation for porosity and permeability, conditioned to 11 well logs and a 3D seismic acoustic impedance inversion (broadband reprocessing, 2020 vintage). The grid uses 100 m x 100 m lateral cells with 2 m vertical resolution (4.2 million cells total). The structural framework is defined by interpreted horizon surfaces from 3D seismic, with a depth uncertainty envelope from the velocity model. The facies model uses a deterministic aeolian facies interpretation (dune crest, dune foreset, interdune, wadi) from core and log data at 11 wells, propagated stochastically between wells using object-based simulation. Two hundred equiprobable realisations were generated, and reservoir volume statistics were extracted from all 200.
The bimodal permeability distribution (reflecting high-k aeolian dune foresets at 100--600 mD and low-k interdune/wadi at 10--50 mD) was captured by a two-facies simulation, with separate SGS runs for each facies and a facies proportion model controlling the mixing.
\subsection{Monte Carlo Capacity Estimation}
The NETL 2019 volumetric capacity formula was applied: GCO2 = A x h_net x phi_mean x (1 - Swr) x rhoCO2 x E
where GCO2 is storage capacity (Mt), A is structure area (km2), h_net is net sand thickness (m), phi_mean is mean porosity, Swr is residual brine saturation, rhoCO2 is CO2 density at reservoir conditions (kg/m3), and E is the storage efficiency factor.
Uncertain parameter distributions:
| Parameter | Distribution | P10 | P50 | P90 | Primary Uncertainty Source |
|---|---|---|---|---|---|
| Gross rock volume (GRV, km3) | Log-normal, CV=0.18 | 5.1 | 7.1 | 9.8 | Seismic velocity model horizon depth uncertainty |
| Net-to-gross (NTG) | Beta(8,3) | 0.64 | 0.73 | 0.82 | Eastern flank well sparsity |
| Mean porosity (%) | Truncated normal, sigma=2.1% | 15.8 | 19.2 | 22.6 | Well log interpretation |
| Storage efficiency factor E | Triangular (0.02, 0.05, 0.12) | 0.025 | 0.051 | 0.110 | NETL 2019 depleted gas reservoir statistics |
| Residual brine saturation (Swr) | Uniform [0.15, 0.35] | 0.17 | 0.25 | 0.33 | Core capillary pressure data |
| GWC migration (m upward) | Normal, mean=35, sigma=12 | 18 | 35 | 52 | Pressure history modelling |
| CO2 density at reservoir P-T (kg/m3) | Deterministic +/- 5 % EOS uncertainty | 693 | 729 | 765 | EOS at 92 C, 28 MPa |
The 500-sample LHS was combined with the analytical capacity formula to generate the full probability distribution. Total computation time was less than 10 minutes on a standard workstation (no HPC required for the Monte Carlo step).
\subsection{Dynamic Reservoir Simulation -- Injection Feasibility}
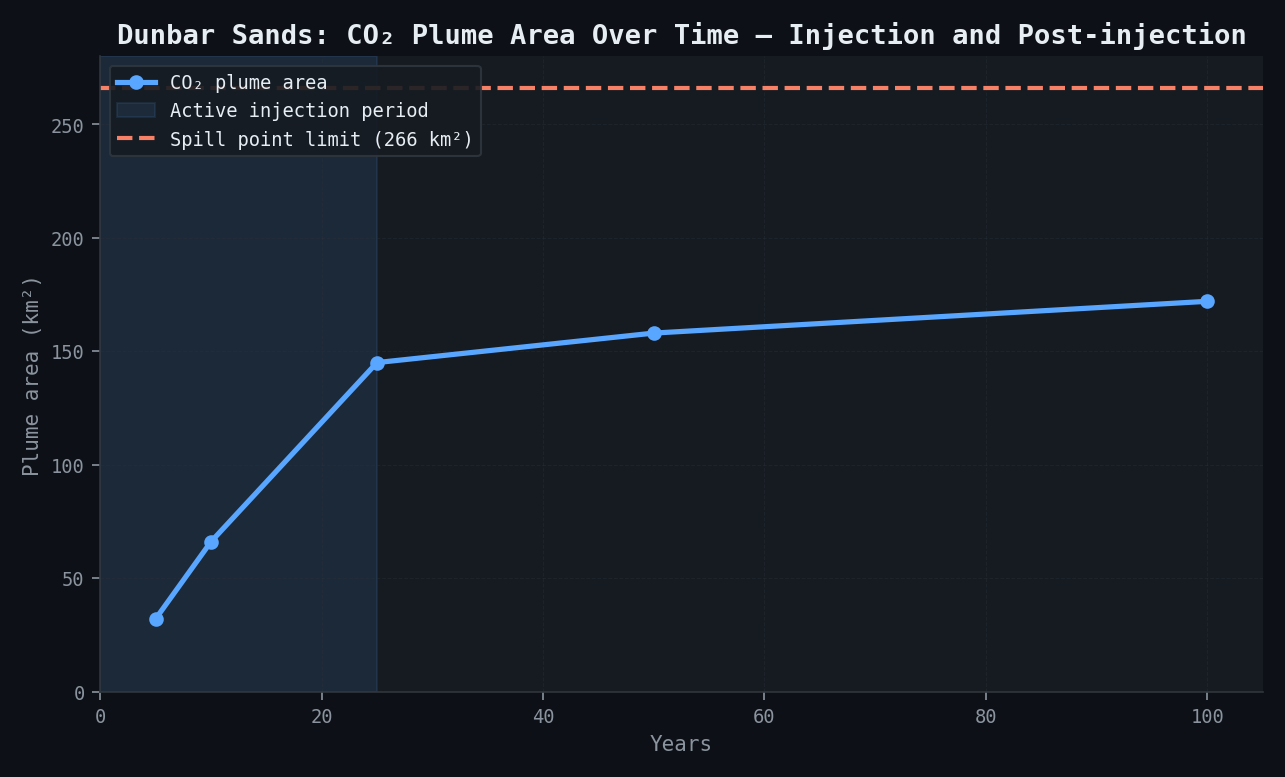
The P10, P50, and P90 static models (three representative realisations from the 200-realisation ensemble) were upscaled to dynamic simulation grids in newtsim Stream (500 m x 500 m x 4 m). CO2 was modelled with a cubic equation of state tuned to reservoir P-T conditions; at injection pressure (28 MPa, 92 C), CO2 density is approximately 729 kg/m3 and viscosity approximately 0.063 mPa-s. The aquifer model uses an infinite-acting analytical aquifer calibrated to production pressure history (40+ years of field data). CO2 dissolution is an equilibrium model at reservoir P-T; at 92 C and 12.6 MPa (initial depleted pressure rising to 28 MPa at injection), CO2 solubility is approximately 35--42 kg/m3 brine. Injector constraints set a maximum BHIP of 30.5 MPa (equal to 90 % of the Zechstein fracture gradient of 52 MPa times a safety factor -- the effective maximum operating pressure). Plume migration was tracked to year 100 (25-year injection plus 75-year post-injection).
Pressure depletion benefit quantification:
The pre-existing 15.8 MPa pressure depletion (from 28.4 MPa original to 12.6 MPa current) creates additional CO2 storage capacity by providing "pressure space" into which CO2 can be injected before exceeding the original hydrostatic pressure gradient. The volume of pressure depletion "space" is approximately 34 Mt CO2 equivalent (calculated as 15.8 MPa times Vcf/Ct, where Vcf is gas cap pore volume and Ct is total compressibility), representing 27 % of P50 capacity (34/128).
This pressure space benefit is not currently recognised under UK NSTA capacity accounting methodology (which uses the NETL volumetric approach), but was documented as a qualitative finding for future policy engagement with NSTA. As the UK develops its regulatory framework for depleted field storage, explicit recognition of pressure depletion benefit would increase the attractiveness of this class of storage site.
\subsection{Caprock Integrity Screening}
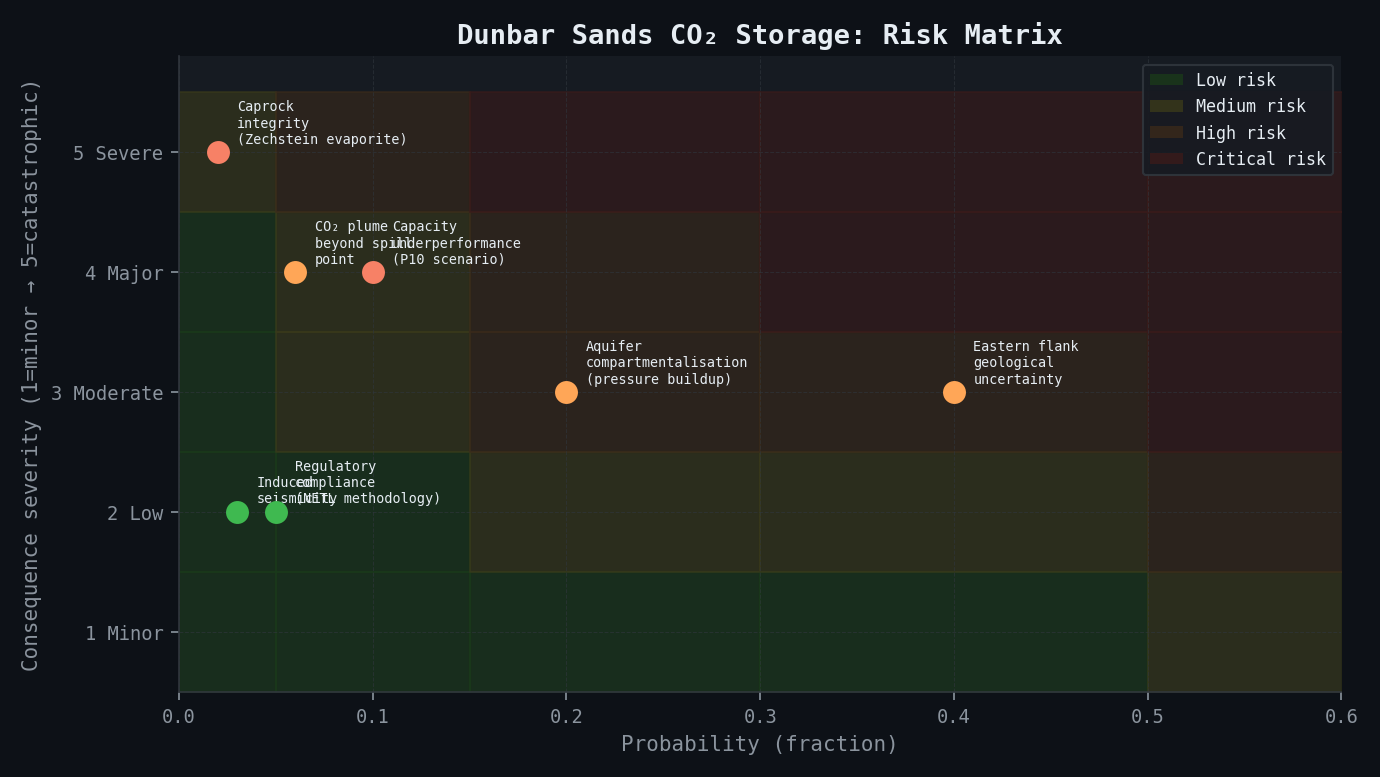
The Zechstein evaporite caprock (predominantly halite with anhydrite) has effectively zero permeability (matrix permeability ~10⁻²¹ m2 -- below direct measurement; flow is essentially zero). A simple 1D poro-elastic pressure diffusion model was used to estimate the maximum pressure communication from reservoir to caprock top over 100 years. With caprock permeability assumed at 10⁻²¹ m2 (halite) to 10⁻¹⁸ m2 (anhydrite interbeds) as a bounding range, the pressure diffusion coefficient (D = k/mu-phi-ct) ranges from 10⁻¹⁰ to 10⁻⁷ m2/s. Pressure at caprock top at 100 years is less than 0.01 MPa (even with anhydrite permeability) -- completely negligible. The caprock fracture gradient of 52 MPa is far above any credible injection pressure (maximum 30.5 MPa).
No full 3D coupled FEM geomechanical model was required. Caprock integrity risk was assessed as Very Low and documented as a qualitative finding. The Zechstein evaporite is the best possible CO2 caprock in the Southern North Sea -- its integrity is not a material concern for this project.
Simulation Caveats
Eastern flank uncertainty. The 41 % of total capacity variance attributable to GRV uncertainty is dominated by the poorly constrained eastern flank. The P90/P10 capacity ratio of 194/74 = 2.6 is relatively wide for a mature field with 11 wells; this reflects the genuine geological uncertainty rather than a modelling artefact. Additional seismic coverage on the eastern flank would be the single highest-value data acquisition investment.
Storage efficiency factor E. The E distribution (triangular, P10=0.025, P50=0.051) is based on the NETL 2019 depleted gas field database, which draws primarily on North American analogues. The Rotliegend's aeolian facies architecture -- with high lateral continuity of permeable dune foreset beds -- may support higher sweep efficiency than average North American depleted gas fields, potentially placing Dunbar Sands at the upper end of the E distribution. The dynamic simulation's P50 result (E_effective = 0.054) is consistent with the upper end of the triangular distribution, providing mild support for this hypothesis.
Aquifer re-pressurisation. The aquifer model (infinite-acting analytical) is calibrated to 40+ years of production pressure history and is well-constrained for the current pressure state. However, the rate of aquifer re-encroachment during CO2 injection -- which affects both pressure buildup and dissolution trapping rates -- depends on aquifer compressibility and connectivity at scales larger than the field. The infinite-acting assumption is conservative for pressure buildup (overestimates pressure rise) and optimistic for dissolution trapping (overestimates CO2-brine contact).
Key Predictions and Results
\subsection{Static Volumetric Capacity (Monte Carlo Ensemble, 500 Realisations)}
| Percentile | Storage Capacity (Mt CO2) | Notes |
|---|---|---|
| P10 (conservative) | 74 Mt | Exceeds NSTA minimum Tier 1 threshold (50 Mt) |
| P50 (best estimate) | 128 Mt | ~25 years at 5.0 Mt/yr; 500 MW CCGT with 90% capture |
| P90 (optimistic) | 194 Mt | ~39 years at 5.0 Mt/yr |
| Mean | 131 Mt | Slightly above P50 due to right-skewed distribution |
| Coefficient of variation | 0.39 | Moderate uncertainty; driven primarily by GRV |
Sensitivity/Variance Decomposition (Sobol first-order indices):
| Parameter | % Contribution to Total Capacity Variance |
|---|---|
| Gross rock volume (GRV) | 41 % |
| Storage efficiency factor E | 29 % |
| Net-to-gross ratio | 14 % |
| Mean porosity | 9 % |
| CO2 density (EOS uncertainty) | 4 % |
| Residual brine saturation (Swr) | 2 % |
| GWC migration | 1 % |
| Total | 100 % |
\subsection{Dynamic Simulation Results (P50 Model)}
| Parameter | Value |
|---|---|
| Target 125 Mt in 25 years at 5.0 Mt/yr | Feasible -- confirmed |
| Maximum reservoir pressure at year 25 | 29.1 MPa |
| Maximum operating BHIP limit | 30.5 MPa |
| Safety margin to MOBHP | 1.4 MPa |
| CO2 plume radius at end of injection (year 25) | 6.8 km |
| Polygon/spill point radius | 9.2 km from injectors |
| Safety margin to spill point | 2.4 km |
| Post-injection plume migration (years 25--100) | Negligible -- securely trapped under Zechstein |
| Dissolution trapping at year 25 | 22 % of injected mass |
| Residual trapping at year 25 | 18 % |
| Structural trapping (beneath Zechstein) | 60 % |
| Storage efficiency E_effective (dynamic P50) | 0.054 |
\subsection{Plume Migration Summary}
| Time Point | Plume Radius (km) | Plume Area (km2) | CO2 Phase | Notes |
|---|---|---|---|---|
| Year 5 | 3.2 | 32 | Supercritical + dissolved | Active injection |
| Year 10 | 4.6 | 66 | Supercritical + dissolved | Active injection |
| Year 25 (end injection) | 6.8 | 145 | Supercritical + dissolved | End of injection phase |
| Year 50 | 7.1 | 158 | Mostly trapped; some mobile | Post-injection |
| Year 100 | 7.4 | 172 | Predominantly trapped | Post-injection; structural containment |
| Spill point (structure limit) | 9.2 | 266 | -- | -- |
\subsection{Pressure Depletion Benefit}
| Parameter | Value |
|---|---|
| Pressure depletion below original hydrostatic (MPa) | 15.8 |
| Additional storage capacity from pressure space (Mt CO2) | ~34 |
| As % of P50 static capacity | 27 % |
| Current recognition in NSTA methodology | Not recognised (qualitative finding) |
| Potential policy uplift if recognised | Could increase P50 capacity to ~162 Mt |
\subsection{Cross-Validation Against Independent Methods}
| Validation Method | Result | Agreement with Monte Carlo P50 |
|---|---|---|
| Production-analogue method: 4.4 Tcf produced gas to equivalent CO2 volume | 112 Mt | Within 13 % of P50 (128 Mt) |
| NSTA Southern North Sea atlas comparison: E = 0.054 at 55th percentile of Rotliegend distribution | Appropriate | Consistent |
| Dynamic simulation effective E | 0.054 | Consistent with Monte Carlo P50 input E |
| Removing GRV uncertainty (deterministic seismic): P90--P10 range collapses | 72 Mt range (vs. 120 Mt full range) | Confirms GRV as dominant uncertainty |
Comparison Methodology
The capacity estimate was cross-checked against two independent methods and one policy cross-comparison.
In the first method (production-analogue conversion), the recovered gas volume (4.4 Tcf = 124.6 Bm3 at standard conditions) was converted to an equivalent CO2 mass by converting gas volume to mass at reservoir conditions using the gas EOS density at original 28.4 MPa and 92 C, then multiplying by the CO2/gas density ratio at injection conditions (CO2 at 28 MPa, 92 C: 729 kg/m3; gas at original reservoir conditions: ~285 kg/m3), and finally applying a CO2 volume-displacement efficiency (ratio of CO2 volume to gas volume at comparable reservoir pressures) of ~0.88 for Rotliegend facies. The result -- an equivalent CO2 storage capacity of 112 Mt -- agrees with the Monte Carlo P50 of 128 Mt within 13 %, confirming that the volumetric model is internally consistent and that no major systematic bias exists.
In the second method (NSTA Southern North Sea atlas comparables), the P50 storage efficiency factor (E = 0.054) was benchmarked against the NSTA atlas distribution for 28 Rotliegend depleted gas fields (reported range E = 0.03--0.09, median 0.05). The study result at the 55th percentile of the regional distribution is appropriate given the confirmed 4-way dip closure (structural trapping), an excellent Zechstein caprock, and moderate-to-good permeability (85 mD geometric mean). Higher E values would require evidence of outstanding sweep efficiency, which is not supported by the heterogeneous aeolian facies architecture.
Data acquisition sensitivity:
| Scenario | GRV Uncertainty Reduction | P90--P10 Range (Mt) | Estimated Cost |
|---|---|---|---|
| Base case (existing 3D seismic + 11 wells) | -- | 120 Mt | -- |
| Eastern flank seismic extension (120 km2 3D) | ~40 % reduction in GRV variance | ~72 Mt | ~GBP 2.5 million |
| Additional eastern flank appraisal well | ~25 % reduction (incremental) | ~54 Mt | ~GBP 15--20 million |
| Full-waveform inversion velocity model | ~15 % additional GRV reduction | ~46 Mt | ~GBP 1.5 million |
| All of above combined | ~65 % GRV uncertainty reduction | ~42 Mt | ~GBP 20 million total |
For a project with estimated capital value of GBP 800 million (based on 25-year injection at GBP 6/t storage tariff with anchor customer contracts), a GBP 20 million data acquisition programme to halve capacity uncertainty is compelling -- equivalent to 2.5 % of project capital value for a 65 % reduction in volumetric range.
Deliverables
- newtsim Pack geostatistical model: 200 equiprobable realisations of porosity, permeability, and NTG, with full variogram and simulation parameter documentation
- Monte Carlo capacity distribution report: P10/P50/P90 with full uncertainty breakdown by parameter (Sobol indices); NETL 2019 methodology compliance documentation
- NETL 2019 methodology compliance certificate formatted for NSTA submission (UK SI 2010/2221 requirements)
- Dynamic injection feasibility report: P10, P50, and P90 reservoir model simulations confirming 125 Mt target injectability at 5.0 Mt/yr over 25 years
- Plume footprint maps at years 5, 10, 25, 50, 100 as GIS shapefiles (OSGB36 / UTM Zone 30N projection)
- Caprock integrity screening memo (qualitative finding: Very Low risk)
- Sensitivity and variance decomposition analysis (Sobol first-order indices by parameter)
- Data acquisition priority ranking with cost-benefit analysis (seismic, well, velocity model options)
- Regulatory-ready capacity statement in NSTA-prescribed format (Track 1 Cluster Sequencing application)
- Deliverable timeline: 6 weeks from data receipt to final report
This case study is an illustrative reference scenario demonstrating newtsim's simulation methodology. All company names, personnel, and specific operational data are fictional. The incident descriptions draw on publicly documented real-world events cited in the frontmatter.