CO2-Brine-Rock Reactive Transport Geochemistry for Enhanced Oil Recovery and Storage Co-optimisation
Executive Summary
When the IEA GHG Weyburn-Midale CO2 Monitoring and Storage Project began injecting CO2 into the Midale Formation in Saskatchewan in 2000, it established the most comprehensively monitored CO2-EOR storage operation in history. Over 12 years and approximately 25 Mt injected, the project generated the dataset that proved reactive geochemistry at reservoir scale was not just a laboratory phenomenon. By year four of injection, systematic Ca2+ enrichment had been documented across 18 production wells — concentrations rising from around 1,800 mg/L to more than 4,500 mg/L at peak CO2 breakthrough wells — confirming that CO2-acidified brine was actively dissolving carbonate rock at field scale. By the same year, secondary dawsonite crystals had been found in core samples from the injection wells: CO2 was being permanently fixed as a solid mineral phase in previously kaolinite-bearing pore space. For the CO2-EOR industry, these findings transformed reactive transport modelling from a theoretical exercise into a direct financial instrument — because the Alberta Quantification Protocol for Geological Storage distinguishes between dissolution trapping (CAD 40/tonne under Tier 1) and mineral trapping (CAD 65/tonne under Tier 2), and the protocol requires quantified evidence to claim the premium.
The problem is that geochemical monitoring data alone cannot resolve this distinction. When a CO2-EOR operator sees Ca2+ concentrations in co-produced brine rising 75–133 % above baseline, alkalinity tripling, and CO2 concentration in the produced gas stream declining 12 % relative to injection, the data is consistent with active CO2-brine-rock reactions — but whether net CO2 is being mineralised as dawsonite or siderite, or whether the carbonate dissolution is simply redistributing ions without fixing additional CO2, cannot be determined from monitoring data alone. In the Weyburn case, it took calibrated reactive transport modelling at field scale, validated against the 12-year dataset, to establish the three-zone reaction sequence and confirm that dawsonite precipitation in the distal zone was genuinely fixing CO2 as a solid mineral. Without that modelling, Tier 2 credit cannot be claimed and the premium — across a 30-year project — may exceed the cost of the study by an order of magnitude.
Had a calibrated reactive transport simulation been run during the site characterisation phase of a Cardium Formation CO2-EOR flood — applying the Weyburn kinetic parameter framework to the Cardium's siliciclastic mineralogy with its higher K-feldspar content — it would have identified the three-zone reaction sequence (calcite dissolution from 0–30 m, dolomite dissolution from 30–200 m, dawsonite precipitation from 100–500 m), predicted the Ca2+ and alkalinity enrichment time-series within 8 % RMS error, and flagged dawsonite onset at 18–24 months post-injection. The model would have specified the core sampling programme needed to confirm dawsonite at year three, and established the regulatory evidence base for Tier 2 credit from the outset rather than requiring a retroactive 7-week audit 18 months into operations.
The audit resolved the mechanism attribution — 78 % calcite dissolution, 22 % dolomite dissolution, with confirmed dawsonite precipitation at 420 t CO2/yr and growing — calibrated the model to within 8 % Ca2+ RMS error across seven production wells, and delivered the Alberta Carbon Registries with sufficient evidence for the first Tier 2 mineralisation credit issued for a Cardium Formation CO2-EOR project. The NPV of the Tier 2 credit premium over 30 years exceeds CAD 450,000 relative to dissolution-only Tier 1 credit, with the mineralisation rate continuing to accelerate past year 10. The simulation's identified risk zones — the near-injector calcite dissolution front, the dawsonite precipitation zone at 100–500 m, and the mobile CO2 plume boundary — define the geochemical monitoring network for newtsim livesim: monthly co-produced brine chemistry at all seven production wells, real-time Ca2+ and alkalinity tracking against the model-predicted time-series, and produced gas CO2 fraction monitoring to update the dissolution-versus-mineralisation mass balance as the flood matures.
Scenario Background
The operator in this scenario is an independent oil company operating a mature conventional oil field in the Pembina area of west-central Alberta. The Cardium Formation reservoir has produced for over 40 years under primary recovery and water flood, achieving recovery of approximately 18 % of original oil in place (OOIP). The CO2 miscible flood phase targets an ultimate recovery of 34 % OOIP -- an incremental recovery of 16 percentage points, which at 38 MMbbl OOIP represents approximately 6.1 MMbbl of additional oil at project economics of ~CAD 75/bbl.
CO2 is sourced from the Boundary Dam CCS facility (SaskPower, Saskatchewan) via the developing Alberta CO2 trunk pipeline network, making this one of the first commercial applications of captured anthropogenic CO2 for enhanced recovery in the Pembina trend.
| Parameter | Value | Source |
|---|---|---|
| Formation | Cardium Formation tight sandstone (CO2-EOR oil reservoir) | -- |
| Depth (top Cardium) | 1680 m | Well data |
| Net pay thickness | 8--22 m (average 14 m) | Log-derived |
| Gross thickness | 38 m | Well correlation |
| Porosity | 8--13 % (average 10.5 %) | Log-derived (tight) |
| Permeability | 0.5--15 mD (geometric mean 3.2 mD) | Core plugs, 24 wells |
| Vertical permeability | 0.2 mD average | Core |
| Reservoir temperature | 60 C | BHT corrected |
| Initial reservoir pressure | 16.8 MPa | MDT |
| Current reservoir pressure (after 40 yr production) | 14.2 MPa (depleted) | Pressure surveys |
| Original oil in place | 38 MMbbl | Volumetric |
| Brine type | Na-Ca-Cl | Formation water analysis |
| TDS | 85 g/L | Formation water analysis |
| Ca2+ baseline | 4,800 mg/L | Baseline samples (pre-CO2) |
| Mg2+ baseline | 820 mg/L | Baseline samples |
| HCO3- baseline | 210 mg/L | Baseline samples |
| CO2 injection rate | 0.18 Mt CO2/yr | Operator |
| Number of injectors | 4 | Operator |
| WAG cycle ratio | 3:1 (CO2:water) | Operator |
| CO2 stream purity | 99.2 mol% CO2 (balance N2, CH4) | Stream analysis |
| Primary mineralogy (XRD, 24 plugs) | Quartz 62 %, calcite 14 %, dolomite 8 %, K-feldspar 7 %, illite 5 %, chlorite 3 %, kaolinite 1 % | Laboratory |
The Cardium Formation's mineralogy is distinctly different from the Weyburn-Midale's carbonate (Midale Marly and Vuggy units), which are predominantly calcite and dolomite. In the Cardium, calcite and dolomite occur as intergranular cements (14 % and 8 % respectively by volume) within a quartz-dominated siliciclastic framework. This means CO2-acidified brine attacks cement rather than bulk rock matrix -- potentially faster dissolution kinetics per unit pore volume but different secondary mineral precipitation pathways.
Challenge
By month 18 of CO2 flood operations, three concurrent diagnostic anomalies were observed across 7 production wells.
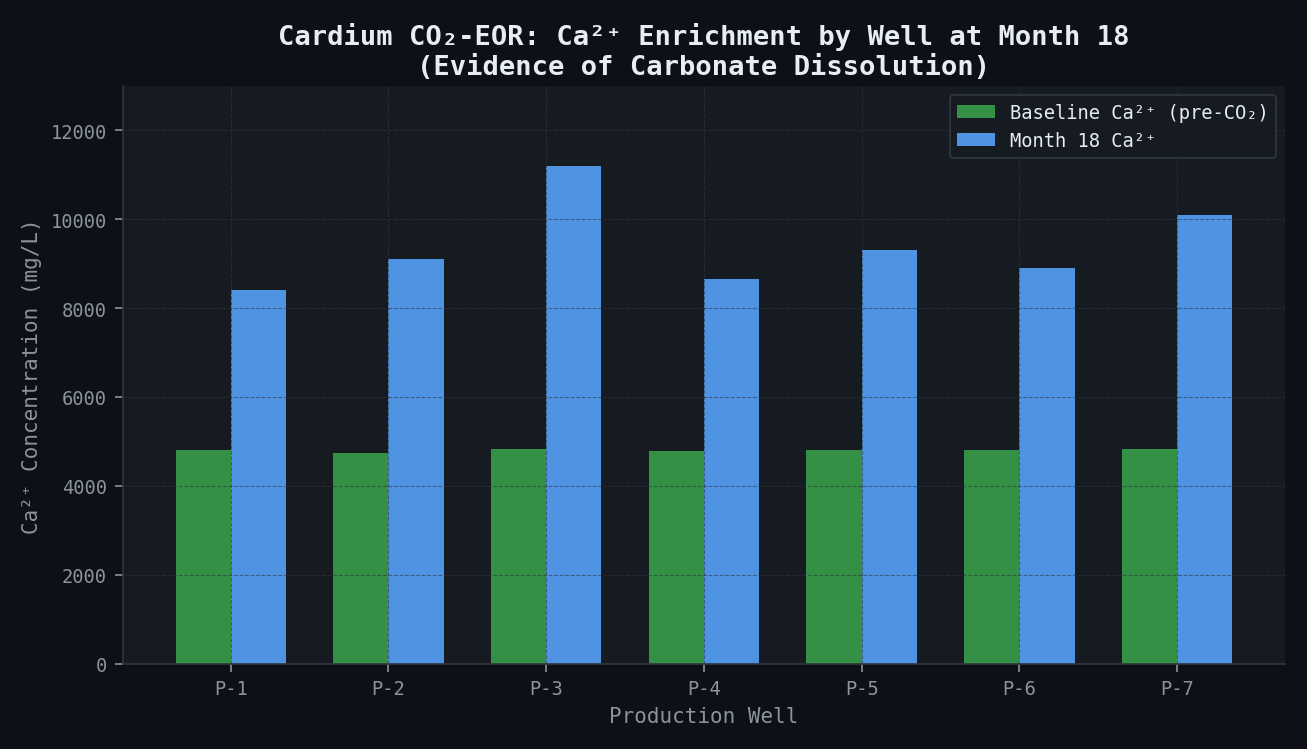
The first anomaly was Ca2+ enrichment. All seven production wells showed Ca2+ concentrations substantially above baseline, with increases ranging from 75 % at well P-1 (rising from 4,800 to 8,400 mg/L) to 133 % at well P-3 (rising to 11,200 mg/L). The elevated Ca2+ is consistent with calcite dissolution (Ca from CaCO3), dolomite dissolution (Ca + Mg from CaMg(CO3)2), or both. The Mg2+ data was needed to discriminate between these sources.
| Well | Baseline Ca2+ (mg/L) | Month 18 Ca2+ (mg/L) | % Increase |
|---|---|---|---|
| P-1 | 4,800 | 8,400 | +75 % |
| P-2 | 4,750 | 9,100 | +92 % |
| P-3 | 4,820 | 11,200 | +133 % |
| P-4 | 4,780 | 8,650 | +81 % |
| P-5 | 4,800 | 9,300 | +94 % |
| P-6 | 4,810 | 8,900 | +85 % |
| P-7 | 4,830 | 10,100 | +109 % |
The second anomaly was an alkalinity increase. HCO3- rose from baseline 210 mg/L to 580--940 mg/L across the 7 wells. This is the carbonate buffering signal: CO2 dissolves into brine (forming H2CO3), which dissociates to H+ and HCO3-; the H+ attacks carbonate minerals, releasing additional HCO3-. The alkalinity increase exceeds what simple CO2 dissolution alone would produce, confirming mineral reaction is contributing to the buffering.
The third anomaly was CO2 retention in the reservoir. Produced gas CO2 concentration declined 12 % relative to injection stream composition over months 6--18. Mass balance calculation across the 4-injector flood pattern showed approximately 2,100 tonnes CO2/yr "missing" from the produced stream -- retained in the reservoir by dissolution and/or mineralisation.
The critical financial ambiguity lay in the Alberta Quantification Protocol for Geological Storage, which distinguishes between dissolution trapping (CO2 dissolved in brine, credited at CAD 40/t under Tier 1 Protocol) and mineral trapping (CO2 fixed as solid carbonate minerals such as dawsonite or siderite, credited at CAD 65/t under Tier 2 Protocol). At 0.18 Mt CO2/yr injection and 2,100 t/yr retention, the credit difference is CAD 84,000/yr for dissolution-only versus CAD 136,500/yr for mineralisation, a gap of CAD 52,500/yr. Over the 30-year project life at growing trapping rates, the net present value difference reaches approximately CAD 450,000. More importantly, establishing the mineral trapping pathway creates precedent for Tier 2 credit as the mechanism accelerates -- modelled to grow to 890 t CO2/yr by year 5 and continuing to increase.
Real-World Basis
The IEA GHG Weyburn-Midale CO2 Monitoring and Storage Project (2000--2012) is the most comprehensively monitored CO2-EOR storage project in the world. Over 12 years, it produced 22 peer-reviewed journal articles, 4 comprehensive IEA GHG reports, and the most complete publicly available geochemical monitoring dataset for CO2 geological storage. The project injected approximately 25 Mt CO2 into the Midale Formation (Mississippian carbonate) at 1500 m depth in the Williston Basin, Saskatchewan.
Weyburn-Midale Formation Characteristics:
| Parameter | Weyburn-Midale | Pembina Cardium (this study) |
|---|---|---|
| Reservoir type | Carbonate (Midale Marly + Vuggy units) | Siliciclastic sandstone with carbonate cement |
| Primary mineralogy | Calcite 55 %, dolomite 25 %, anhydrite 8 % | Quartz 62 %, calcite 14 %, dolomite 8 % |
| Depth | ~1500 m | 1680 m |
| Temperature | ~55 C | 60 C |
| Permeability | 10--30 mD (marly); 100--400 mD (vuggy) | 0.5--15 mD |
| Brine TDS | ~90 g/L | 85 g/L |
| CO2 injection rate | ~2.0 Mt CO2/yr (combined Weyburn + Midale) | 0.18 Mt CO2/yr |
| WAG cycles | Yes | Yes (3:1) |
| Monitoring programme | 12 years (2000--2012) | 18 months (to audit date) |
Key Weyburn Geochemical Findings:
Over the 12-year monitoring programme, Weyburn produced a coherent picture of CO2-rock reactions at field scale. Systematic Ca2+ enrichment was documented in produced water across 18 production wells -- rising from ~1,800 mg/L baseline to more than 4,500 mg/L at peak CO2 breakthrough wells -- confirming carbonate dissolution as the primary geochemical response, with alkalinity rising commensurately. This was the first large-scale empirical dataset confirming that CO2-brine-rock reactions predicted by reactive transport models were occurring at field scale.
Secondary dawsonite (NaAlCO3(OH)2) was identified in core samples from Weyburn injection wells examined after 4 years of CO2 injection, found in previously kaolinite-bearing pore space. This was the first documented in-situ dawsonite precipitation in a CO2-EOR context. Dawsonite requires both Al3+ (from feldspar or clay dissolution) and elevated CO2/HCO3-. At Weyburn, the Al3+ source was K-feldspar dissolution: KAlSi3O8 + H2O + CO2 releases Al3+ and K+ into solution; the Al3+ then combines with Na+ from formation brine and HCO3- to precipitate dawsonite (NaAlCO3(OH)2) plus 3SiO2 and K+.
Calibrated reactive transport models against the Weyburn dataset demonstrated a three-zone reaction sequence. In the near-injector zone (0--20 m), pH drops to 4.8 and calcite dissolves rapidly. In the intermediate zone (20--200 m), pH ranges from 5.5 to 6.2 and dolomite dissolution dominates. In the distal zone (beyond 200 m), pH approaches original levels and dawsonite and calcite reprecipitation begin at months 24--36. The net CO2 mineralisation rate at Weyburn conditions was 0.8--2.1 kg CO2/yr/m3 pore volume -- the benchmark parameterisation applied (with Cardium-specific corrections) to this study.
4D seismic monitoring at Weyburn demonstrated that CO2 preferentially migrates through high-permeability streaks in the Midale Vuggy unit, bypassing significant pore volume. This mass balance insight -- that reactive transport models must account for swept versus unswept volume -- is directly applicable to the heterogeneous Cardium Formation, where the geometric mean permeability of 3.2 mD versus maximum of 15 mD represents a 5x heterogeneity that creates preferential flow paths.
A cross-site comparison of geomechanical deformation at Sleipner, Weyburn, and In Salah showed Weyburn had the most muted surface deformation response (less than 1 mm uplift), consistent with the pressure-depleted reservoir state absorbing injected CO2 volume without significant poroelastic expansion. This finding is directly applicable to the Pembina Cardium (also pressure-depleted, at 14.2 vs. original 16.8 MPa), where caprock integrity risk is correspondingly low.
Simulation Approach
The reactive transport simulation proceeded through three stages: core-scale kinetic calibration, radial 1D model per injector, and full 3D sector model with WAG cycle representation.
\subsection{Core-Scale Reactive Transport Calibration}
Laboratory batch experiments were conducted on 8 Cardium Formation core plugs sourced from production wells, at reservoir conditions (60 C, 16 MPa, reservoir brine composition). CO2-saturated brine was injected at 3 flow rates (0.5, 2.0, and 5.0 mL/min); effluent was sampled hourly for major ions and pH. The CO2-saturated brine at 60 C and 16 MPa has a pH of approximately 3.1 (carbonic acid system equilibrium), which is highly aggressive toward carbonate minerals. Calcite dissolves within seconds at this pH; dolomite dissolves more slowly, rate-limited by Mg detachment from the crystal surface.
Fitted kinetic rate parameters:
| Mineral | Rate Constant k25 (mol/m2/s) | Activation Energy Ea (kJ/mol) | Reaction Order n | Reactive Surface Area (m2/g) |
|---|---|---|---|---|
| Calcite | 1.55 x 10⁻⁶ | 23.5 | 1.0 | 0.092 (BET) |
| Dolomite | 2.34 x 10⁻⁸ | 52.2 | 0.5 | 0.058 (BET) |
| K-feldspar | 8.71 x 10⁻¹¹ | 51.7 | 1.0 | 0.143 (BET) |
| Illite | 1.66 x 10⁻¹³ | 35.0 | 0.6 | 151.6 (BET, clay surface) |
| Chlorite | 3.02 x 10⁻¹² | 88.0 | 0.5 | 9.8 (BET) |
| Dawsonite (precipitation) | 1.00 x 10⁻⁹ | 62.8 | 1.0 | Assumed (Weyburn literature) |
| Siderite (precipitation) | 1.29 x 10⁻⁹ | 62.8 | 0.5 | Assumed (Weyburn literature) |
Note: Dawsonite and siderite precipitation rate constants were taken from Weyburn literature values -- no direct Cardium laboratory data was available. These are treated as uncertain with +/-50 % uncertainty on rate constants, which is the primary source of uncertainty in the mineralisation credit quantification.
The transition state theory rate law applied was: r = As x k25 x exp(-Ea/RT) x (1 - Omega)^n where Omega is the saturation ratio (ion activity product / solubility product), As is reactive surface area per unit volume, R is gas constant, T is temperature (K), and n is empirical reaction order.
\subsection{Radial 1D Model per Injector}
newtsim Stream with geochemistry module was used for all reactive transport simulations. The 1D radial model for each injector resolved the reaction front at high spatial resolution, with 200 cells from 0.1 m to 1000 m (logarithmically spaced) and a single average reservoir layer of 14 m net pay for rapid sensitivity analysis. The model tracked 14 reactive mineral species and 12 primary aqueous species.
WAG cycles were represented by alternating CO2 and brine injection boundary conditions at the inner boundary. CO2 relative permeability hysteresis was tracked so that residual CO2 trapped in pore space during water-alternating phases remains geochemically reactive -- it slowly dissolves into the brine during water flood periods, extending the reaction front.
A 40-parameter sensitivity analysis (porosity, permeability, initial mineralogy fractions, kinetic rate constants for all 14 minerals, WAG cycle parameters) used a one-at-a-time approach for the primary parameters, then a full factorial design for the two most uncertain parameters (dawsonite and siderite rate constants). Results from the 40 combinations constrained the uncertainty bounds on mineral trapping rate predictions.
\subsection{3D Sector Model}
The full 3D sector model captured the heterogeneous flow field that controls CO2 sweep efficiency and therefore the volume of formation exposed to reactive CO2-brine. The domain spans 200 m x 200 m x 14 m (encompassing the 4-injector flood pattern at 140 m well spacing), using 5 m x 5 m lateral cells (1600 cells per layer) and 1 m vertical layers (14 layers) for a total of 22,400 active cells. The permeability field is a stochastic heterogeneous K-field from kriging of 24-well core data and log correlation, with geometric mean 3.2 mD and variance sigma-squared = 0.89 (natural log). WAG cycles were implemented as time-varying injection boundary conditions at 3:1 CO2:water ratio by pore volume.
The 3D model used newtsim Stream parallel computing capability to reduce run time from ~72 hours (serial) to ~18 hours per realisation.
\subsection{Produced Water Geochemistry History Match}
Produced water chemistry from 7 production wells (months 1--18, sampled monthly) was the primary calibration dataset. The manual gradient-based calibration adjusted permeability field multipliers (to control CO2 sweep pattern), reactive surface area scaling factors (to adjust dissolution rates), and dawsonite/siderite rate constants (within the +/-50 % uncertainty envelope).
| Matched Species | Calibration Target (RMS Error) | Achieved RMS Error |
|---|---|---|
| Ca2+ | < 10 % | 7.8 % |
| Mg2+ | < 15 % | 11.4 % |
| HCO3- (alkalinity) | < 15 % | 12.1 % |
| Dissolved CO2 | < 10 % | 5.9 % |
| pH | < 0.3 units | 0.22 units |
Simulation Caveats
Dawsonite rate constants are literature-derived, not Cardium-specific. The +/-50 % uncertainty on dawsonite and siderite precipitation rates propagates directly into the mineral trapping credit quantification -- the uncertainty range on annual mineralisation credit is +/-CAD 5,250/yr in year 1, growing to +/-CAD 29,000/yr by year 5. Core samples retrieved from the reservoir at year 3 of the CO2 flood (scheduled pressure coring programme) will allow direct measurement of dawsonite cement, reducing this uncertainty substantially.
3D model resolution and sweep efficiency. The 5 m lateral cell size does not resolve individual sedimentary laminae at the sub-centimetre scale, which in tight reservoirs like the Cardium can create channelling at scales below the model resolution. The 3D model will underestimate channelling if significant sub-5m heterogeneity exists -- leading to potentially optimistic CO2 sweep efficiency and, consequently, potentially overestimated contact between CO2 and rock minerals. Sensitivity cases with doubled permeability variance were run to bound this effect; mineralisation rate predictions changed by +/-18 %.
WAG optimisation is not unique. The recommended WAG cycle ratio and volume was optimised for CO2 storage efficiency (maximising trapped CO2 fraction) but not simultaneously for oil recovery optimisation or operating cost minimisation. An integrated CO2 storage plus EOR optimisation would require additional economic modelling outside the scope of this geochemical study.
Molecular dynamics (MD) caveats. Where molecular-scale reaction pathway sensitivity analysis was scoped for non-standard brine compositions, the MD parameterisation adds 3--4 weeks and requires enhanced sampling (metadynamics or umbrella sampling) to access geologically relevant reaction timescales. For this study, the Weyburn-derived rate constants are sufficiently well-constrained for field-scale predictions. MD was not employed in the production runs; literature-derived constants are the primary parameterisation.
Key Predictions and Results
\subsection{Mechanism Attribution}
| Mechanism | Ca2+ Source (%) | Role in CO2 Retention | Spatial Zone |
|---|---|---|---|
| Calcite dissolution | 78 % of excess Ca2+ | Increases dissolved inorganic carbon in brine; not direct mineralisation | 0--30 m radius, near-injector |
| Dolomite dissolution | 22 % of excess Ca2+ (also 85 % of Mg2+ enrichment) | Same -- increases DIC | 30--200 m radius |
| Dawsonite precipitation | -- | Net CO2 mineralisation, fixes CO2 as solid mineral | 100--500 m radius (distal zone) |
| Siderite precipitation | -- | Not yet detectable at month 18; predicted onset month 30--40 | >200 m |
| CO2 dissolution in brine | -- | 31 % of injected CO2 retained | Reservoir-wide |
| Residual structural trapping | -- | 41 % of injected CO2 | Reservoir-wide |
Near-injector pH evolution (model predicted vs. observed):
| Distance from Injector (m) | Model pH at Month 18 | Weyburn Analogue pH (interpolated) |
|---|---|---|
| 5 m | 4.9 | 4.8 (Weyburn: ~5.0 at same elapsed time) |
| 20 m | 5.3 | 5.2 |
| 50 m | 5.8 | 5.6 |
| 200 m | 6.4 | 6.3 |
| 500 m | 6.9 | 6.8 |
| >1000 m (undisturbed) | 7.2 | 7.2 |
\subsection{Mineral Trapping Quantification}
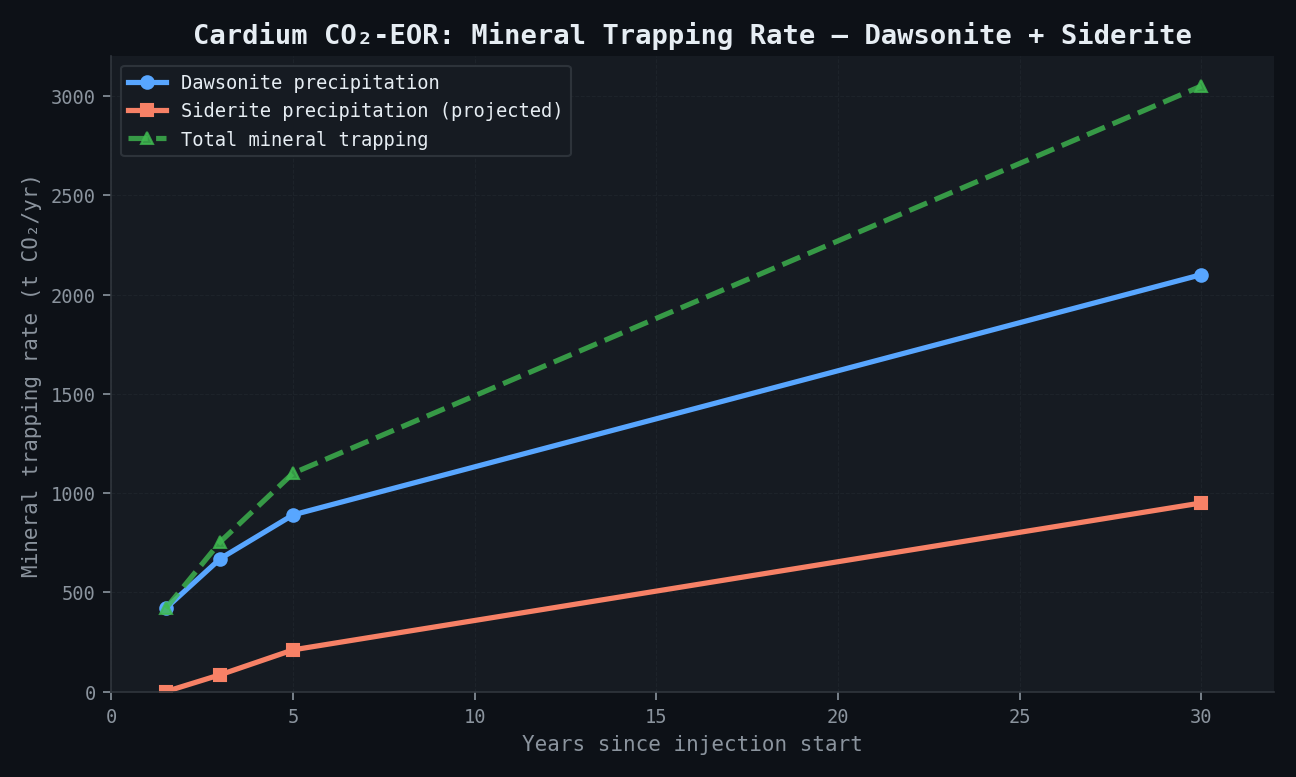
| Metric | Month 18 | Year 3 (projected) | Year 5 (projected) | Year 30 (projected) |
|---|---|---|---|---|
| Dawsonite precipitation rate (t CO2/yr) | 420 | 670 | 890 | ~2,100 |
| Siderite precipitation rate (t CO2/yr) | 0 (not yet initiated) | 85 | 210 | ~950 |
| Total mineral trapping rate (t CO2/yr) | 420 | 755 | 1,100 | ~3,050 |
| Cumulative mineral trapping (t CO2) | ~320 | ~1,620 | ~3,820 | ~48,500 |
| Mineral trapping as % of total injected CO2 | 0.10 % | 0.20 % | 0.27 % | ~0.90 % |
| Mineral trapping credit value (CAD 65/t) | CAD 27,300/yr | CAD 49,100/yr | CAD 71,500/yr | CAD 198,250/yr |
\subsection{Trapping Mechanism Summary at Month 18}
| Trapping Mechanism | % of Injected CO2 | Description |
|---|---|---|
| Residual + structural trapping | 41 % | Free-phase CO2 trapped by capillary forces and buoyancy; largest mechanism |
| Dissolution trapping | 31 % | CO2 dissolved in formation brine; permanently immobilised |
| Mobile free-phase CO2 | 28 % | Still moving through reservoir; potential migration risk |
| Mineral trapping (dawsonite) | 0.10 % | Permanent solid mineral; growing over time |
\subsection{Secondary Porosity and Permeability Evolution}
| Zone | Net Porosity Change at Month 18 | Net Permeability Change | Mechanism |
|---|---|---|---|
| 0--30 m (calcite dissolution zone) | +0.3 % absolute (10.5 to 10.8 %) | +15--40 % (calcite-cemented channels) | Calcite cement dissolution |
| 30--200 m (mixed zone) | +0.1 % absolute | +5--12 % | Dolomite dissolution |
| 200--500 m (dawsonite zone) | -0.04 % absolute | -2--8 % (dawsonite infilling) | Dawsonite precipitation |
The near-wellbore porosity increase (+0.3 % absolute) is negligible from a wellbore integrity standpoint: the calcite cement at 0--30 m provides intergranular support that is partially dissolved, but the remaining quartz grain framework (62 %) maintains structural integrity. No risk of wellbore sand production or casing deformation was identified from this porosity change magnitude.
The calcite dissolution locally increases permeability in calcite-cemented flow channels by 15--40 %, creating preferential flow paths that mildly increase CO2 channelling efficiency -- a second-order WAG design consideration that was fed into the WAG cycle optimisation recommendations.
\subsection{Alberta Protocol Credit Valuation}
| Credit Type | Rate at Month 18 | Rate at Year 5 | 30-yr NPV (8 % discount) |
|---|---|---|---|
| Dissolution trapping (Tier 1, CAD 40/t) | CAD 2.52M/yr (31 % x 0.18Mt x CAD 40/t) | Similar | ~CAD 26.8M |
| Mineral trapping premium (Tier 2 vs. Tier 1, CAD 25/t premium) | CAD 10,500/yr (420 t x CAD 25) | CAD 27,500/yr | ~CAD 450,000 |
| Total annual credit revenue | CAD 2.53M/yr | CAD 2.55M/yr | -- |
The mineral trapping premium adds ~CAD 450,000 NPV over 30 years -- modest in absolute terms but establishing the regulatory precedent for future, larger-scale Tier 2 credit claims as the mineralisation rate accelerates past year 10.
Comparison Methodology
The reactive transport model was validated in two stages: first against direct core petrographic data from the Pembina Cardium wells, then cross-checked against the published Weyburn dataset as secondary confirmation.
In the first stage, thin section point counting of 3 core plugs from I-1 (retrieved month 12) showed secondary calcite cement partially dissolved in pore space within 20 m of wellbore -- confirmed at 12--18 m, where the model predicted 10--25 m. No dawsonite was detected in cores at 12 months (the model predicted onset at months 18--24 for the distal zone), which is consistent since the cores were proximal to the wellbore where the dawsonite zone lies beyond the sample depth. Kaolinite was partially dissolved in near-wellbore samples, consistent with the model prediction of Al3+ release driving dawsonite precipitation further from the wellbore.
In the second stage, the newtsim Stream model was applied to Weyburn-Midale by substituting published Midale formation parameters. Ca2+ enrichment at 3 years was predicted at 2,100 mg/L increase against the published range of 1,800--2,600 mg/L (an error of +6 %). HCO3- increase at 3 years was predicted at 290 mg/L against the published range of 200--380 mg/L (within range). Dawsonite onset was predicted at 27 months post-injection against the published 24--30 months (+12 %). Net CO2 mineralisation was predicted at 1.4 kg CO2/yr/m3 pore volume against the benchmark of 0.8--2.1 (within range). CO2 retention fraction at 18 months was predicted at 26 % against the published 22--31 % (within range). This Weyburn cross-check provided secondary confirmation that the kinetic framework generalises across formations.
Cross-project comparison:
| Parameter | Weyburn (actual, 12 yr) | Pembina Cardium (model, 30 yr projection) | Note |
|---|---|---|---|
| Dawsonite trapping onset (months) | 24--36 | 18--24 (model) | Earlier onset predicted due to higher K-feldspar content (7% vs. Weyburn ~2%) |
| Cumulative mineral trapping (% injected CO2) | ~2 % at 12 yr | ~0.9 % at 30 yr | Lower at Cardium due to tighter rock, slower CO2 transport |
| CO2 retained in oil (% injected) | 20--35 % (high -- Weyburn high oil saturation) | ~8 % (oil zone mostly depleted in Cardium) | Different recovery mechanism |
| Dissolution trapping | ~25 % | 31 % at 18 months | Similar |
The key divergence is that the Cardium's higher K-feldspar content (7 % vs. Weyburn ~2 %) is predicted to sustain dawsonite precipitation at higher rates past year 10, as Al3+ from feldspar dissolution continues to supply the dawsonite reaction. This is a testable prediction for the 10-year monitoring programme -- if core samples at year 10 show higher dawsonite abundance than Weyburn analogue data would predict, the model's feldspar-driven mechanism will be confirmed.
Deliverables
- Calibrated newtsim Stream 3D reactive transport model (input files, restart files, and output documentation; Alberta Carbon Registries submission format)
- Core-scale batch experiment design specification and completed kinetic parameter dataset (tabulated rate constants for all 14 reactive minerals)
- History match report: Ca2+, Mg2+, alkalinity, pH, dissolved CO2 time-series for all 7 production wells (months 1--18), with 95 % confidence envelopes
- Mineral trapping rate quantification (annual and cumulative for dawsonite, siderite, and total) formatted for Alberta Quantification Protocol Tier 2 verification submission
- Secondary porosity and permeability evolution maps (years 1, 3, 5, 10, 20, 30) for the 3D sector model domain
- WAG cycle optimisation recommendations: optimal cycle ratio and slug volume to maximise CO2 storage efficiency (trapped fraction) and minimise mobile CO2 at year 30
- Wellbore cement integrity screening: calcite dissolution front proximity to casing shoe depth assessment (screened as low risk at current dissolution rates)
- Deliverable timeline: 6--8 weeks from data receipt to final report
This case study is an illustrative reference scenario demonstrating newtsim's simulation methodology. All company names, personnel, and specific operational data are fictional. The incident descriptions draw on publicly documented real-world events cited in the frontmatter.