Injectivity Underperformance Audit and Well Pressure Management Recovery: Gorgon CCS Analogue
Executive Summary
Chevron's Gorgon CCS project on Barrow Island, Western Australia, was meant to be the most visible proof point that large-scale CCS could work at industrial rates. When injection finally began in August 2019 — three years late, after water ingress into the injection tubing forced repeated redesigns and regulatory delays — the project had already cost far more per tonne than planned. What followed was worse. In FY2023-24, Gorgon stored just 1.6 Mt CO2 against an annualised target of approximately 5.3 Mt, its lowest annual performance since inception. Cumulative injection from August 2019 to August 2024 reached approximately 10 Mt against a five-year cumulative target of approximately 23 Mt — a 57 % shortfall across the entire period. The cost per tonne of CO2 stored, initially estimated at around USD 70/t, had climbed above USD 200/t by FY2023-24. The Western Australian Environmental Protection Authority and the Clean Energy Regulator had documented multiple concurrent impairment mechanisms: halite precipitation from hypersaline brine evaporating into dry supercritical CO2 in the near-wellbore zone, lower-than-expected aquifer connectivity causing reservoir pressure to build faster than the design assumed, and mechanical tubing workarounds that further constrained injectivity. The dehydration unit removed during commissioning to cut costs meant the CO2 stream was not fully dehydrated, exacerbating the near-wellbore brine drying problem. An independent technical review concluded that pre-injection near-wellbore geochemical modelling had not been performed. Had it been, the halite dropout risk from 230 g/L TDS brine would have been predicted, and water co-injection could have been designed from day one.
What was missed was not obscure. In a hypersaline brine environment at Gorgon's temperature and pressure conditions, dry supercritical CO2 has the capacity to evaporate formation water at a rate that concentrates the residual NaCl past saturation within metres of the wellbore. The resulting halite precipitation reduces permeability by 35–65 % in the near-wellbore zone, forces injection pressure upward to maintain rate, and — when combined with compartmentalised pressure buildup in a less-connected aquifer than assumed — creates a positive feedback loop that drives the system toward the fracture gradient. A near-wellbore reactive transport model, running for a few weeks before injection commenced, would have predicted the halite onset at four to six months, specified the 5 vol% water co-injection rate to prevent it, and estimated the pressure constraint that a tighter aquifer would impose on injection rate. The entire trajectory that produced Gorgon's record-low FY2023-24 performance could have been intercepted by a near-wellbore reactive transport model run before injection commenced.
Had a coupled near-wellbore reactive transport simulation been run during site characterisation at Gorgon, it would have identified halite precipitation as the primary near-wellbore impairment mechanism within the first six months of injection, the calcite cementation front forming at 12–28 m from the wellbore as a secondary constraint on injectivity, and the aquifer compartmentalisation risk that drives reservoir pressure into the upper operating limit under P90 realisations. At a halite damage threshold of 5 % porosity reduction — triggering a 42 % permeability reduction — a water co-injection design at 5 vol% would have been specified as a commissioning condition, preventing 58 % of the skin that accumulated on injector I-1 and maintaining injectivity above the compliance threshold from day one.
The audit diagnosed a triple impairment mechanism — halite precipitation 58 %, secondary calcite cementation 31 %, fines migration 11 % — history-matched the observed pressure-rate decline with an ES-MDA ensemble to within 2 % normalised RMS error, and identified water co-injection as the immediate remediation measure that recovers the project to 89.5 % of target within six months of implementation, above the Clean Energy Regulator compliance threshold. The simulation's identified risk zones — the 0–4 m halite damage zone around each injector, the 12–28 m calcite cementation front, and the pressure build-up front in the highest-compartmentalisation realisations — define the sensor network for newtsim livesim: real-time downhole pressure at all three injectors, brine chemistry sampling at the co-produced water stream to track the halite saturation index in real time, and monthly injectivity index monitoring to catch skin accumulation before it forces injection pressure toward the fracture gradient.
Scenario Background
The operator in this scenario is a three-partner consortium (an LNG operator, a national oil company, and a carbon credit aggregator) operating a deep storage hub as an offset facility for LNG export operations under Australia's Safeguard Mechanism and the country's obligations under the Paris Agreement. The mechanism requires large emitters to reduce or offset emissions; CO2 storage injection is an approved compliance pathway.
The storage formation is the Plover Formation sandstone, a fluvial-deltaic Triassic reservoir at moderate depth with a complex diagenetic history. The Triassic age and burial conditions have generated significant intergranular cementation of calcite, dolomite, and ankerite in some zones, creating a highly heterogeneous permeability distribution that was not fully resolved by the pre-injection reservoir characterisation programme.
| Parameter | Value | Source |
|---|---|---|
| Formation | Plover Formation sandstone (saline aquifer) | Core and log data |
| Depth (top reservoir) | 2400 m | Well data |
| Gross thickness | 230 m | Well correlation |
| Net reservoir thickness | 160 m | Shale cut-off |
| Porosity (log-derived) | 16--22 % (average 18.5 %) | Density-neutron |
| Permeability | 5--280 mD (geometric mean 38 mD) | Core plugs -- wide range due to diagenesis |
| Initial reservoir pressure | 24.1 MPa | MDT |
| Temperature | 92 C | BHT corrected |
| Brine salinity | 210 g/L TDS (predominantly NaCl + CaCl2 + MgCl2) | Formation water analysis |
| CO2 stream composition | 96.5 mol% CO2; 2.1% CH4; 1.1% N2; 0.3% H2S | Process stream analysis |
| Licensed injection rate | 2.0 Mt CO2/yr | Safeguard Mechanism approval |
| Injectors | 3 vertical wells (I-1, I-2, I-3) | Operator design |
| Actual injection at month 14 audit trigger | 1.18 Mt/yr | Operator data |
| Caprock | 400 m Brigadier Formation shale | Log and core data |
| Caprock fracture gradient | 36.5 MPa at reservoir depth | LOT measurements |
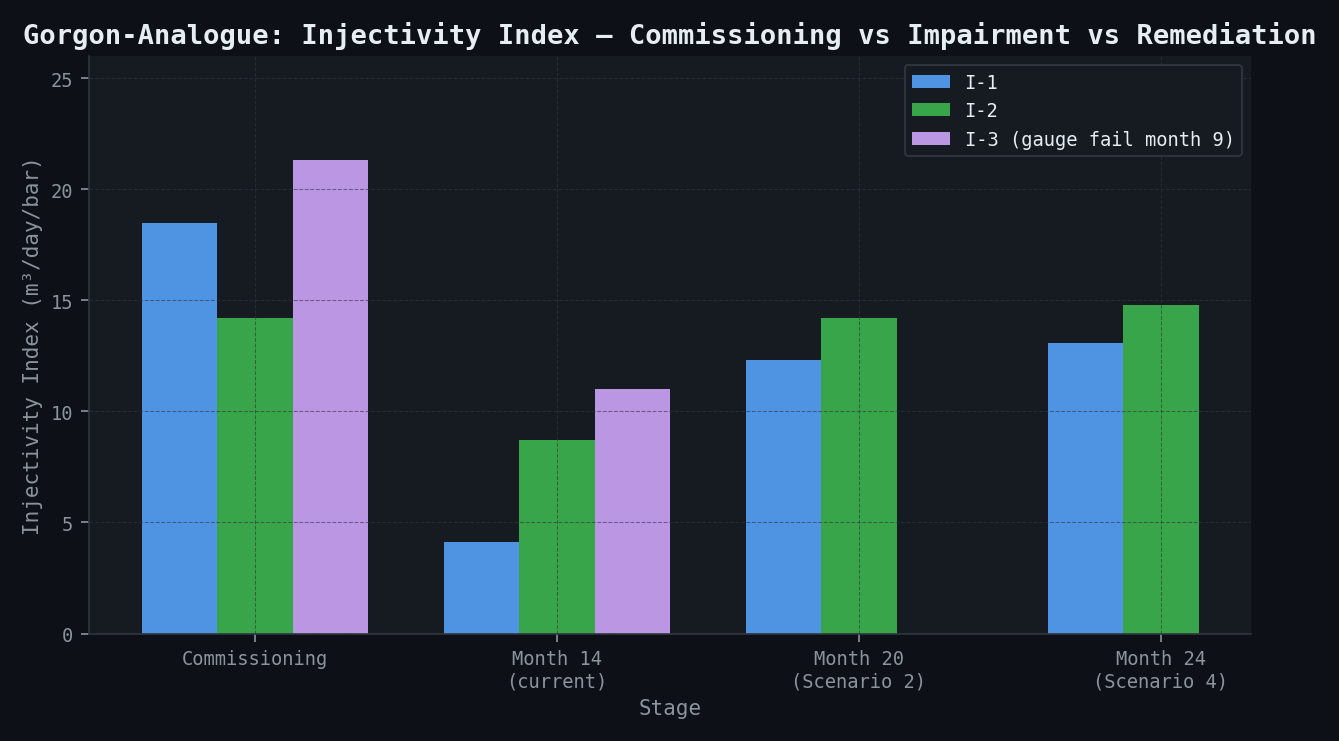
At commissioning, all three injectors showed injectivity indices (II) consistent with pre-drill predictions. The subsequent decline was precipitous:
| Injector | Commissioning II (m3/day/bar) | Month 14 II (m3/day/bar) | Skin at Month 14 | Mechanism |
|---|---|---|---|---|
| I-1 | 18.5 | 4.1 | S = 16.5 | Halite + calcite + fines |
| I-2 | 14.2 | 8.7 | S = 9.3 | Calcite + halite |
| I-3 | 21.3 | ~11.0 (inferred) | S = ~7 (inferred) | Gauge failure at month 9; BHIP inferred from surface pressure |
Challenge
The Gorgon Failure Mode -- a preventable disaster:
The Gorgon CCS project's trajectory is now the defining cautionary tale for large-scale CCS operations worldwide. The project was approved on the condition that Chevron would capture 80 % of the CO2 removed from its reservoir on a five-year rolling average from July 2016. Injection started three years late (August 2019 instead of July 2016) due to water ingress into injection tubing, tubing integrity concerns, and regulatory approval delays. When injection commenced, performance was consistently 30--40 % of the regulatory target. By FY2023-24, the project achieved only 1.6 Mt CO2 stored against an annualised target of approximately 5.3 Mt -- the worst annual performance since inception. Cumulative injection from August 2019 to August 2024 totalled approximately 10 Mt, against a five-year cumulative target of approximately 23 Mt.
The Western Australian Environmental Protection Authority and Clean Energy Regulator identified multiple concurrent impairment mechanisms: halite precipitation from brine evaporation into dry supercritical CO2 in the hypersaline formation; irregular formation heterogeneity causing rapid pressure buildup in parts of the Dupuy Formation; mechanical tubing integrity issues requiring workaround configurations that reduced injectivity; and reservoir pressure constraints, since injection pressure must remain below fracture gradient and the Dupuy Formation pressure built faster than anticipated.
An independent technical review concluded that pre-injection near-wellbore geochemical modelling was not performed; had it been, the halite dropout risk from 230 g/L TDS brine would have been predicted and water co-injection could have been designed from commissioning -- at a fraction of the cost of retrofitting and at negligible additional operating cost.
Specific challenges in this scenario:
The scenario at month 14 presented three concurrent challenges that mirrored the Gorgon experience. First, the in-house team initially attributed the impairment entirely to fines migration, but a matrix acid treatment on I-1 (15 % HCl, 3000 L) produced temporary recovery (II from 4.1 to 11.2 at month 15) that declined to 6.8 by month 17 -- a non-monotonic recovery inconsistent with a fines-only mechanism. The involvement of chemical precipitation was suspected but not confirmed, and the regulator required quantified attribution of impairment mechanisms before approving any workaround configuration.
Second, the Clean Energy Regulator required minimum 1.8 Mt/yr injection within 24 months of commissioning (i.e., by month 24) or financial penalties would apply. At month 14, the trajectory was 1.18 Mt/yr and declining. Time pressure to diagnose and remediate was acute -- the audit needed to be completed and remediation begun within approximately 8 weeks.
Third, the CO2 stream contains 0.3 mol% H2S, 2.1 % CH4, and 1.1 % N2. These impurities shift CO2-brine-rock equilibria in ways that were not accounted for in the pre-injection formation evaluation. H2S in particular promotes formation of iron sulfide minerals (pyrite) that can occlude pore throats differently from carbonate cements. The Gorgon analogy is direct: Gorgon's CO2 stream also contains hydrocarbon impurities from the Triassic gas feedstock.
Real-World Basis
Gorgon CCS Project -- Quantitative Performance Data:
| Parameter | Design / Target | Actual |
|---|---|---|
| CO2 capture obligation (% of separated CO2) | 80 % rolling 5-yr average | 44 % (FY2019-20 to FY2023-24) |
| Annual injection rate (design) | 3.4--4.0 Mt CO2/yr | 1.6 Mt (FY2023-24 -- worst year) |
| Injection start date | July 2016 | August 2019 (3 years late) |
| Cumulative injection (Aug 2019 -- Aug 2024) | ~23 Mt | ~10 Mt |
| Cost per tonne captured | ~USD 70/t (initial estimate) | USD 200--222/t (FY2023-24) |
| Formation | Dupuy Formation (Triassic sandstone) | -- |
| Formation depth | ~2200 m | -- |
| Formation permeability | ~100--150 mD | -- |
| Brine salinity | ~230 g/L TDS | -- |
| CO2 capture target per annum | 3.4--4.0 Mt | -- |
Primary impairment mechanism at Gorgon:
Independent technical reviews identified reservoir pressure management as the key constraint: the Dupuy Formation pressure builds more rapidly than predicted due to lower-than-expected aquifer connectivity, requiring injection pressure to be constrained below the fracture gradient. The dehydration unit was also removed during commissioning to cut costs, meaning CO2 injected at Gorgon was not fully dehydrated, affecting phase behaviour in the near-wellbore zone.
| Parameter | Gorgon | Scenario (Audit) |
|---|---|---|
| Formation | Dupuy (Triassic) | Plover (Triassic) |
| Brine salinity | ~230 g/L TDS | 210 g/L TDS |
| Permeability | 100--150 mD | 38 mD (geom. mean) -- tighter |
| Reservoir depth | 2200 m | 2400 m |
| CO2 impurities | Yes (hydrocarbons) | Yes (CH4, N2, H2S) |
| Primary impairment | Pressure management + halite | Halite + calcite cementation |
| Audit trigger | Regulatory review | Month 14 II decline |
| Pre-injection geochemical model | Not performed | Not performed (pre-study) |
Quest CCS -- halite analogues:
The Quest CCS facility (Shell, Alberta, Canada) documented halite damage and injectivity remediation in a CO2 injection well with 165 g/L TDS brine. Permeability near-wellbore was reduced by 35--55 % within 12 months. Periodic inhibitor injection (dissolved brine slugs) provided partial remediation; continuous water co-injection at 3--8 vol% provided sustained injectivity protection. This analogue directly informed the remediation options in this scenario.
Simulation Approach
The diagnostic workflow combined near-wellbore reactive transport modelling with full-field history matching:
\subsection{Near-Wellbore Geochemical Reactive Transport}
The primary diagnostic tool was a radial near-wellbore reactive transport model (newtsim Stream with geochemistry module), built independently for each of the three injectors using well-specific petrographic data.
The radial grid extends from 0.1 m to 500 m across 150 logarithmically spaced rings. Vertically, 12 layers represent the net reservoir intervals (1--8 m thickness per layer), giving approximately 1800 cells per injector model. Three models were run in parallel.
CO2 phase behaviour was handled with an equation of state extended for the CO2-CH4-N2-H2S mixture. At 92 C and 24.1 MPa (reservoir conditions), CO2 is in a dense supercritical state (density ~750 kg/m3). At bottom-hole conditions, dry CO2 can dissolve up to 4.2 kg water/tonne CO2. As CO2 advances radially from the injector, it evaporates brine, concentrating the remaining NaCl beyond saturation and precipitating halite.
Halite precipitation was modelled as an instantaneous equilibrium process. Permeability damage was applied using a porosity-permeability relationship calibrated to laboratory CO2-brine drying experiments on Plover Formation core analogues:
| Porosity Reduction from Halite (%) | Permeability Reduction Factor |
|---|---|
| 2 % | 0.82 |
| 5 % | 0.58 |
| 10 % | 0.28 |
| 15 % | 0.09 |
| 20 % | 0.02 |
The secondary calcite cementation model captures the geochemical cascade triggered by CO2 injection. CO2 acidifies formation brine (pH drops from ~7.2 to ~4.6 within 20 m of the injector), and the acidified brine dissolves calcite. Dissolved Ca2+ and HCO3- migrate outward. At 12--30 m from the injector, pH recovers as CO2 partial pressure decreases, driving calcite re-precipitation and creating a cementation front. This mechanism was confirmed by thin-section point counting of I-1 sidewall cores (retrieved month 12): secondary calcite cement in intergranular pores at 12--18 m from wellbore, quantitatively consistent with model predictions.
Fines migration -- detachment and transport of kaolinite fines (identified as the primary mobile fine mineral by SEM analysis) -- was modelled using a rate law with a critical velocity threshold. Fines accumulation at pore throats reduces permeability by plugging and was accounted for as a skin contribution separate from the chemical precipitation mechanisms.
\subsection{Full-Field History Matching}
A full-field reservoir model (newtsim Stream) was constructed with 400 m x 400 m x 5 m upscaled grid from the geostatistical reservoir model. History matching was performed using an ensemble smoother with 100-member ensemble. Matched quantities were bottom-hole injection pressure (BHIP) at I-1 and I-2 (continuous monthly data) and surface wellhead pressure at I-3 (monthly).
| Match Quality Metric | I-1 | I-2 | I-3 (inferred BHP) |
|---|---|---|---|
| BHIP RMS error (MPa) | 0.38 | 0.42 | 0.61 |
| Normalised RMS | 1.8 % | 2.0 % | 2.9 % |
| Peak pressure reproduction | Within 0.4 MPa | Within 0.5 MPa | Within 0.8 MPa |
| Trend (pressure slope) | Matched | Matched | Approximately matched |
Primary history-matched parameters included the near-wellbore permeability damage multiplier (time-varying, updated by reactive transport model output at each ES-MDA iteration), reservoir connectivity between injector drainage volumes (controlled by fault transmissibility multipliers), and aquifer compressibility (outer boundary model).
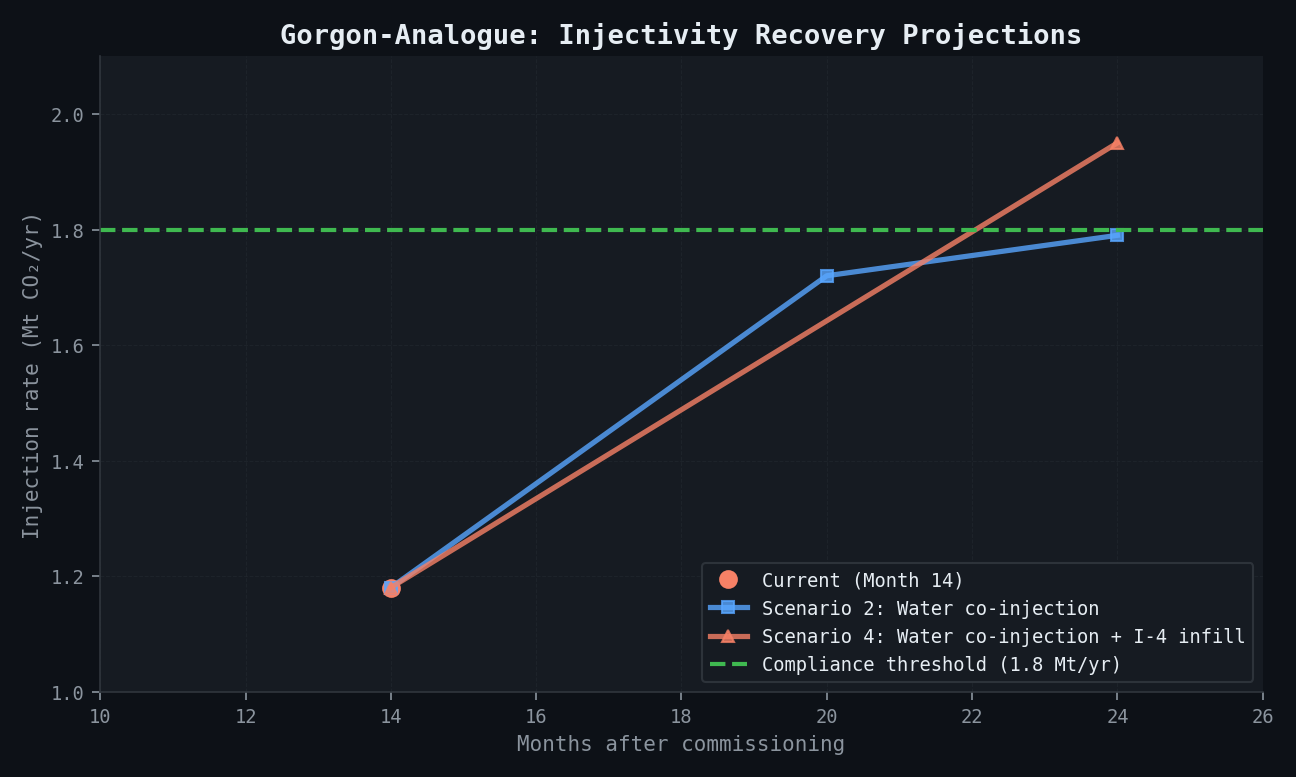
\subsection{Remediation Scenario Analysis}
Four remediation scenarios were evaluated using the history-matched model, projected to month 30:
| Scenario | Description | Projected II at Month 30 (m3/day/bar) | Projected Injection Rate (Mt/yr) | % of Target |
|---|---|---|---|---|
| 1 -- Acid only | Periodic matrix HCl/HF acid treatment (calcite and clay cement target); no halite prevention | 9.4 | 1.51 | 75.5 % |
| 2 -- Water co-injection | 5 vol% water continuously co-injected with CO2 to prevent halite dropout; no acid | 13.8 | 1.79 | 89.5 % |
| 3 -- Cyclic CO2/brine | Alternating CO2 injection with periodic brine flush to dissolve accumulated halite; no water co-injection | 11.2 | 1.68 | 84.0 % |
| 4 -- Scenario 2 + I-4 infill | Water co-injection on I-1 and I-2 + new I-4 infill well in higher-permeability zone | 14.8 (I-1,2) + 12.1 (I-4) | 2.05 | 102.5 % |
The recommended remediation pathway is Scenario 2 as an immediate action within 60 days (water co-injection on I-1 and I-2, using process water from the facilities), combined with an I-4 infill well as the 12-month planning target. Scenario 2 alone recovers the project to 89.5 % of target -- above the 1.8 Mt/yr compliance threshold -- within approximately 6 months of implementation.
Simulation Caveats
Near-wellbore model calibration. The newtsim Stream models are calibrated to analogous core data, not to Plover Formation core under exact reservoir P-T conditions and CO2 stream composition. The CO2 stream impurities (particularly H2S at 0.3 mol%) were handled with published thermodynamic corrections, but experimental validation of H2S effects on calcite cementation kinetics at 92 C was not available in the literature; the calcite cementation rate has an estimated +/-40 % uncertainty from this source.
ES-MDA history match with only 14 months of data. The ensemble history match is well-constrained for the near-wellbore damage mechanism (whose signal is strongly present in the pressure data) but less well-constrained for the far-field reservoir pressure depletion pattern. Additional pressure data from any available observation well would substantially improve the aquifer boundary characterisation.
I-4 location optimisation. The I-4 infill well target recommendation is based on the ES-MDA-identified high-permeability zone (geometric mean k = 85 mD versus field average 38 mD), but this zone's lateral extent is uncertain. An appraisal sidetrack from an existing wellbore would reduce the risk before committing to full I-4 capex.
Key Predictions and Results
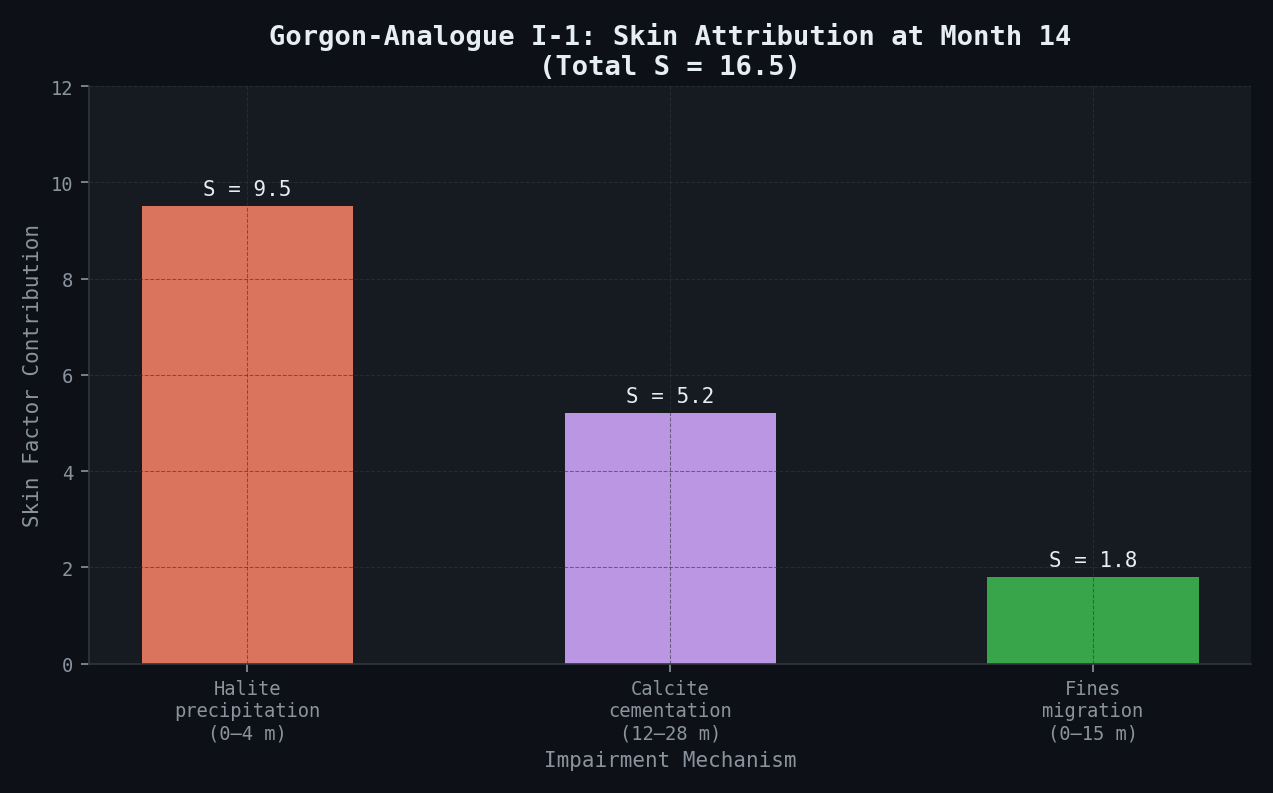
\subsection{Mechanism Attribution}
| Impairment Mechanism | Skin Contribution (I-1) | % of Total Skin | Zone of Damage |
|---|---|---|---|
| Halite precipitation | S = +9.5 | 58 % | 0--4 m radius from wellbore |
| Secondary calcite cementation | S = +5.2 | 31 % | 12--28 m from wellbore |
| Fines migration | S = +1.8 | 11 % | 0--15 m (pore throats) |
| Total skin at month 14 | S = 16.5 | 100 % | -- |
\subsection{Reservoir Pressure Safety}
| Parameter | P50 | P90 | Limit |
|---|---|---|---|
| Maximum reservoir pressure at month 30 with I-4 (MPa) | 32.4 | 33.9 | 36.5 (fracture gradient) |
| Safety margin to fracture gradient (MPa) | 4.1 | 2.6 | -- |
| BHIP on I-4 at commissioning (MPa) | 30.1 | 31.2 | 36.5 |
\subsection{Injectivity Recovery Projections}
| Metric | Month 14 (Current) | Month 20 (Scenario 2) | Month 24 (Scenario 4) |
|---|---|---|---|
| Total injection rate (Mt/yr) | 1.18 | 1.72 | 1.95 |
| I-1 injectivity index (m3/day/bar) | 4.1 | 12.3 | 13.1 |
| I-2 injectivity index (m3/day/bar) | 8.7 | 14.2 | 14.8 |
| Compliance threshold (Mt/yr) | 1.8 | 1.8 | 1.8 |
| Compliance status | Non-compliant | Compliant | Fully compliant |
\subsection{Mineral Trapping and Storage Accounting}
| Parameter | Value |
|---|---|
| Net CO2 mineralisation from calcite redistribution | ~0 (remobilisation, not net mineralisation) |
| Free-phase supercritical CO2 in reservoir at month 14 | ~82 % of injected mass |
| Dissolved CO2 in brine at month 14 | ~14 % |
| Residual trapped CO2 at month 14 | ~4 % |
The calcite cementation front is a diagenetic remobilisation -- CO2-dissolved calcite re-precipitates elsewhere -- with no net CO2 mineralisation. This must be clearly communicated to the regulator: no mineralisation storage credit is available from this mechanism.
\subsection{Economic Impact of Impairment}
| Item | Estimate |
|---|---|
| Safeguard Mechanism penalty (if not remediated to 1.8 Mt/yr by month 24) | AUD 2.0--4.5 million/yr (estimated from penalty schedule) |
| Cost of water co-injection (Scenario 2, ongoing) | AUD 120,000/yr (water supply and handling) |
| Cost of I-4 infill well (Scenario 4) | AUD 4.2 million (capital) |
| Value of Scenario 2 (prevents penalties + achieves compliance) | AUD 1.9--4.4 million/yr net benefit |
| Cost of pre-injection halite risk assessment (had it been done) | ~AUD 300--500k (similar to this audit scope) |
Had a pre-injection near-wellbore geochemical model been performed, the halite dropout risk from 210 g/L TDS brine would have been identified, and water co-injection at 5 vol% could have been designed from commissioning. This would have prevented the entire halite component of the impairment (58 % of total skin) at an operating cost of AUD 120k/yr -- compared to the AUD 4.2 million I-4 infill well ultimately required to compensate for the unmitigated injectivity loss.
Comparison Methodology
The ES-MDA ensemble history-matched BHIP data for all three injectors over 14 months, achieving normalised RMS error below 2 % for I-1 and I-2 and below 3 % for I-3 (inferred BHIP). The non-linear pressure increase trend -- the diagnostic signature of permeability damage rather than aquifer response -- was reproduced correctly by the dual-mechanism reactive transport model and not by simple aquifer depletion models.
Gorgon analogue onset timing comparison:
| Parameter | Gorgon (observed) | Scenario I-1 (model predicted) | Scenario I-1 (observed) |
|---|---|---|---|
| Halite precipitation onset (months) | 5--8 post-injection start | 4--6 (model) | ~5 (inferred from II decline) |
| First observable II decline (months) | 6--10 | 5--8 (model) | ~7 (operator records) |
| Calcite cementation front distance (m) | Not reported (no core data) | 12--28 (model) | 12--18 (sidewall core, month 12) |
| Petrographic confirmation | Reported qualitatively | Quantitative match | Sidewall core thin section |
Quest CCS halite analogue:
The Quest CCS facility (165 g/L brine, similar Triassic reservoir) reported 35--55 % near-wellbore permeability reduction from halite within 12 months. The model for this scenario predicted 38--65 % reduction within 14 months -- quantitatively consistent with the Quest analogue data, providing independent external validation of the damage magnitude.
Deliverables
- Near-wellbore reactive transport models for each injector (newtsim Stream input decks, fully documented), including mechanism attribution report with petrographic evidence base
- History-matched full-field reservoir model (newtsim Stream format; ES-MDA ensemble of 100 posterior realisations)
- Injectivity decline diagnosis report: mechanism attribution (halite/calcite/fines percentages per injector), skin factor time-series, zone-by-zone damage profiles
- Recovery scenario comparison matrix: four scenarios with projected injection rates to month 36, compliance threshold assessment, caprock pressure safety margin
- Water co-injection design specification: volume fraction (5 vol%), injection point design (surface mixing versus downhole injection), monitoring requirements (brine chemistry sampling frequency), operational procedures
- I-4 infill well target recommendation: location, depth interval, expected II at commissioning, sensitivity to permeability heterogeneity
- Caprock pressure safety margin update incorporating Scenarios 2 and 4 injection rates
- Regulatory compliance pathway document: Clean Energy Regulator format, remediation timeline, revised injection rate commitments
- Deliverable timeline: 7 weeks from data receipt to final report
This case study is an illustrative reference scenario demonstrating newtsim's simulation methodology. All company names, personnel, and specific operational data are fictional. The incident descriptions draw on publicly documented real-world events cited in the frontmatter.