Caprock Integrity Assessment Under Injection-Induced Stress Changes: In Salah Analogue Study
Executive Summary
In 2011, the BP–Sonatrach–Statoil joint venture suspended CO2 injection at the In Salah gas field in Algeria after Envisat InSAR satellite data revealed surface uplift of up to 20 mm/yr directly above injection well KB-502 — a rate and pattern that no pre-injection model had predicted and that no monitoring protocol at the time was designed to catch. Retrospective coupled modelling confirmed what the seismic data had already suggested: a through-caprock fracture corridor extending at least 100–200 m into the Devonian overburden above the reservoir had been reactivated by injection-induced pressure increase. The assumed hydraulic connection to a large regional aquifer had never materialised; the Krechba sandstone was effectively compartmentalised, and the planned 4 MPa pressure overpressure was exceeded by a factor of three. By the time observable microseismicity began — more than 1,000 events recorded by the passive array — the fracture corridor was already open and the project was heading toward suspension. The project never resumed injection. More than USD 200 million in stranded investment, permanent reputational damage to industrial-scale CCS in North Africa, and a multi-year regulatory freeze on new storage licences in the Berkine Basin were the consequences. The root cause, identified in post-suspension back-analysis, was straightforward: no coupled reservoir-geomechanical simulation had been run during site characterisation. The formation's proximity to shear failure — the NE-SW fault set was within 1.8 MPa of reactivation at initial conditions — was never quantified. The injection pressure design never incorporated that margin.
What was missed was not exotic: it was standard pre-injection geomechanics. The stress state at In Salah placed the reservoir in a normal-to-strike-slip faulting regime with a favourably oriented fault set within 600 m of the nearest injector. A Mohr circle analysis on available stress data would have shown the system was already close to failure before a single tonne of CO2 was injected. Combined with the compartmentalisation risk — which a pressure ensemble with variable fault transmissibility would have identified — the model would have flagged that 22 MPa bottom-hole injection pressure was unsafe, and that a real-time traffic-light protocol was not optional but essential.
Had a coupled reservoir-geomechanical simulation been run during the In Salah site characterisation phase, the analysis would have identified the 1.8 MPa proximity to fault shear failure at initial conditions, the compartmentalisation risk driving pressure to exceed design assumption by 3x under P90 realisations, and the asymmetric double-lobe InSAR surface uplift signature as the earliest detectable indicator of fracture corridor activation. The model would have set the safe bottom-hole injection pressure at 20.1 MPa — 2.3 MPa below the proposed design — and specified a traffic-light protocol that could have flagged the KB-502 corridor approaching failure eight months before the first observable seismicity. Injection would have continued, the project would not have been suspended, and USD 200 million in stranded capital would have been preserved.
For the Berkine Basin context — where ALNAFT now mandates exactly this study before issuing any new injection licence — it is the difference between a project that operates and one that does not. The study quantifies fault reactivation risk at 8 % over the 30-year project life, requires a redesign from three to four horizontal injectors at 20.1 MPa maximum BHIP to maintain 1.1 Mt CO2/yr injection rate, and delivers an injection design with an 8-month early warning capability embedded in the licence conditions. The simulation's identified risk zones — the NE-SW fault set 600 m from the injection cluster, the near-fault caprock stress concentration, and the pressure build-up front in the P90 compartmentalised realisations — define the sensor network for newtsim livesim: real-time downhole pressure at all four injectors, a dense microseismic array positioned to triangulate hypocentres above reservoir depth, and InSAR coherence monitoring to distinguish symmetric poroelastic uplift from the asymmetric double-lobe signature that signals fracture corridor activation before injection pressure reaches the red threshold.
Scenario Background
The operator in this scenario is a joint venture between an Algerian national gas producer and two European energy majors. The consortium operates a natural gas processing complex in the Illizi Basin sub-region of the Berkine Basin, producing 9 billion standard cubic metres per year of sales gas. The raw well stream contains 8.5 mole % CO2 as a natural impurity; after amine scrubbing, the separated CO2 stream -- approximately 1.2 Mt CO2/yr -- is currently vented to atmosphere under a regulatory waiver that expires in 2027. Thereafter, storage is mandatory under both Algerian hydrocarbon law and the emission reduction commitments embedded in the joint venture's EU ETS-linked carbon credit agreements.
The proposed storage formation is the Carboniferous Tournasian C sandstone at the Tiguentourine Deep Storage Unit (TDSU), a stacked reservoir-seal system with proven four-way dip closure identified on 3D seismic. The formation has not been commercially produced; six appraisal wells penetrated it during the 1990s hydrocarbon exploration phase without finding commercial hydrocarbons, leaving it in a native state with hypersaline brine.
| Parameter | Value | Source |
|---|---|---|
| Formation | Tournasian C sandstone | Core and log data, 6 wells |
| Depth (top reservoir) | 1800 m | Seismic/well tie |
| Gross thickness | 85 m | Well correlation |
| Net-to-gross | 0.68 | Log-derived (Vsh cut-off) |
| Porosity | 14--19 % (average 16.5 %) | Log-derived |
| Permeability | 8--45 mD (geometric mean 18 mD) | Core plugs, 6 wells |
| Initial reservoir pressure | 18.4 MPa | MDT survey |
| Temperature | 68 C | BHT corrected |
| Brine salinity | 180 g/L TDS (hypersaline) | Formation water samples |
| Planned injection rate | 1.1 Mt CO2/yr | Operator design basis |
| Injector configuration | 3 horizontal wells (revised to 4 post-study) | -- |
| Lateral section length | 1500 m | Operator design |
| Caprock primary seal | 120 m Devonian siltstone/shale | Log and core data |
| Total caprock succession | 950 m Devonian siltstone/shale | Regional stratigraphy |
| Caprock UCS | 42 MPa (triaxial tests, 4 plugs) | Laboratory |
| Minimum horizontal stress (Shmin) | 34.8 MPa | Micro-frac test |
| Vertical stress (Sv) | 45.2 MPa | Density log integration |
| Maximum horizontal stress (SHmax) | 39.1 MPa | Borehole breakout analysis |
| Mapped fault sets | 3 (NE-SW, N-S, NW-SE) | 3D seismic interpretation |
| Nearest fault to injectors | 600 m (NE-SW strike-slip set) | Seismic pick |
The stress state is critical: Shmin < SHmax < Sv places the formation in a normal-to-strike-slip faulting regime. The NE-SW fault set -- oriented at approximately 30 degrees to SHmax -- is favourably oriented for shear reactivation under increased pore pressure, making it the primary integrity concern.
Challenge
The In Salah incident created regulatory and reputational pressure across the entire Berkine Basin CCS development community. The study faced three specific and quantifiable challenges.
The first challenge concerned a mapped fault zone proximate to the injection cluster. The TDSU caprock contains a mapped NE-SW fault zone 600 m from the nearest planned injector. This fault's in-situ cohesion is unknown (only estimated from regional analogues) and its proximity to shear failure under the proposed 22.4 MPa BHIP was uncharacterised. The Mohr circle analysis based on the initial stress state showed the NE-SW fault set was already within 3.2 MPa of shear failure at initial reservoir conditions -- a narrow safety margin before any injection-induced pressure increase. At In Salah, published back-analysis found that the reactivated fracture corridor at KB-502 was within 1.8 MPa of failure at the initial stress state. The parallel with TDSU was concerning and formed the central risk argument in the permit authority's objection to the operator's initial application.
The second challenge was the hypersaline brine and salt precipitation risk. The 180 g/L TDS brine composition significantly depresses CO2 solubility compared to dilute brine (by approximately 35 % at reservoir P-T conditions). Less CO2 dissolves into brine, more remains as free supercritical phase, and the drying front in dry CO2 around the injector is more aggressive -- increasing halite precipitation risk. Near-wellbore permeability reduction from halite dropout creates a positive feedback: lower injectivity forces operators to raise injection pressure, which increases the pressure differential driving fluid toward the mapped fault. This feedback loop was identified as a contributing mechanism to the pressure exceedance at In Salah (where brine salinity was approximately 200 g/L TDS in the Krechba formation).
The third challenge was the induced seismicity Mw limit. The ALNAFT licence conditions require demonstration that induced seismicity moment magnitude does not exceed Mw 2.0 at any point within the 30-year project life. This threshold is consistent with international best practice (BGS TLP framework; ISO 13935) but is particularly stringent given the proximity of the TDSU structure to populated desert communities within 25 km. A traffic-light monitoring protocol, directly analogous to what was retroactively prescribed for In Salah's post-suspension restart assessment, was a mandatory licence condition.
Real-World Basis
The In Salah Gas CCS project (BP, Sonatrach, Statoil joint venture, 2004--2011) is the primary reference for this study and one of the most extensively documented cases of injection-induced geomechanical disturbance in commercial CCS. It injected approximately 3.8 Mt CO2 into the Krechba Carboniferous sandstone at 1800 m depth between 2004 and 2011.
In Salah Project Key Facts:
| Parameter | Value |
|---|---|
| Operators | BP, Sonatrach, Statoil (joint venture) |
| Location | In Salah gas field, Algeria |
| Injection period | 2004--2011 (suspended) |
| Cumulative injection | ~3.8 Mt CO2 |
| Storage formation | Krechba Carboniferous sandstone |
| Formation depth | ~1800 m |
| Formation permeability | ~10 mD (tight) |
| Formation temperature | ~90 C |
| Brine salinity | ~200 g/L TDS |
| Injectors | 3 horizontal wells (KB-501, KB-502, KB-503) |
| Planned injection rate | ~1 Mt CO2/yr |
| Caprock thickness | 950 m Devonian succession |
| Surface monitoring | Envisat InSAR (2004--2010) |
InSAR Surface Deformation -- Quantitative Results:
InSAR data from the Envisat satellite revealed dramatically different surface uplift patterns above the three injection wells:
| Injector | Surface Uplift Pattern | Peak Uplift Rate | Explanation |
|---|---|---|---|
| KB-501 | Symmetric elliptical | ~5 mm/yr | Simple poroelastic reservoir expansion |
| KB-503 | Symmetric elliptical | ~8 mm/yr | Simple poroelastic reservoir expansion |
| KB-502 | Asymmetric double-lobe | ~20 mm/yr | Fracture/fault zone opening from reservoir into overburden |
The double-lobe uplift at KB-502 was the critical diagnostic signal. Coupled modelling demonstrated that this pattern is inconsistent with simple reservoir expansion and requires the activation of a through-caprock fracture corridor extending 100--200 m into the Devonian overburden above the reservoir -- still well within the 950 m caprock, but fundamentally different from the single-zone poroelastic response at KB-501 and KB-503.
Pressure Exceedance -- Root Cause:
| Parameter | Design Assumption | Actual Observed | Ratio |
|---|---|---|---|
| Reservoir pressure increase (MPa) | ~4 MPa overpressure | ~12 MPa overpressure | 3x |
| Formation aquifer connectivity | High (open aquifer) | Low (compartmentalised) | -- |
| Mohr circle distance to failure | ~3.5 MPa (design) | ~1.8 MPa (pre-injection actual) | -- |
The pressure exceedance at In Salah resulted primarily from formation compartmentalisation: the assumed hydraulic connectivity to a large regional aquifer did not materialise. The Krechba sandstone was more isolated than anticipated, causing rapid pressure buildup that was not dissipated laterally. The planned 4 MPa overpressure design assumption was exceeded by a factor of three.
Post-Suspension Modelling Lesson:
Retrospective coupled modelling of the In Salah pressure history demonstrated that a real-time pressure monitoring protocol, linked to a geomechanical forward model tracking Coulomb Failure Stress change on the KB-502 fracture corridor, could have flagged the CFS approaching zero approximately 8 months before the observed microseismicity onset. The absence of such a protocol -- and the absence of pre-injection geomechanical modelling -- was the primary regulatory lesson extracted from In Salah.
Published Seismicity Data:
The passive seismic array at In Salah (6 three-component geophones at ~500 m depth, 1500 m above injection point) recorded over 1000 microseismic events during the injection period. Maximum recorded events were Mw ~1.7. Formal triangulation of hypocentres was not possible with the sparse array, but event rates correlated strongly with injection rate and wellhead pressure -- direct evidence of pressure-induced fault slip.
Simulation Approach
The simulation workflow was designed explicitly to address each of the In Salah failure modes identified above:
\subsection{Reservoir Simulation -- Pressure Field}
A dual-porosity compositional reservoir model (newtsim Stream) was constructed for the TDSU Tournasian C sandstone. The dual-porosity representation was chosen because the Tournasian sandstone contains both a matrix pore system and natural fractures visible on the borehole image log -- the same architectural feature that contributed to the In Salah compartmentalisation surprise.
The grid uses 100 m x 100 m lateral cells with 3 m vertical resolution, refined locally to 10 m x 10 m within 200 m of each horizontal injector. Fault transmissibility multipliers were treated as uncertain parameters ranging from 0.001 to 1.0, representing the range from sealed faults (impermeable barriers creating compartments) to open faults (conductors). An ensemble of 30 realisations of fault transmissibility captured the compartmentalisation uncertainty that was the In Salah root cause.
CO2 phase behaviour was modelled with a cubic equation of state tuned to separator gas and PVT data. Hypersaline brine CO2 solubility was calculated using a thermodynamic model that correctly accounts for activity coefficient depression at 180 g/L TDS -- solubility approximately 35 % lower than at fresh water conditions at 68 C and 18--22 MPa.
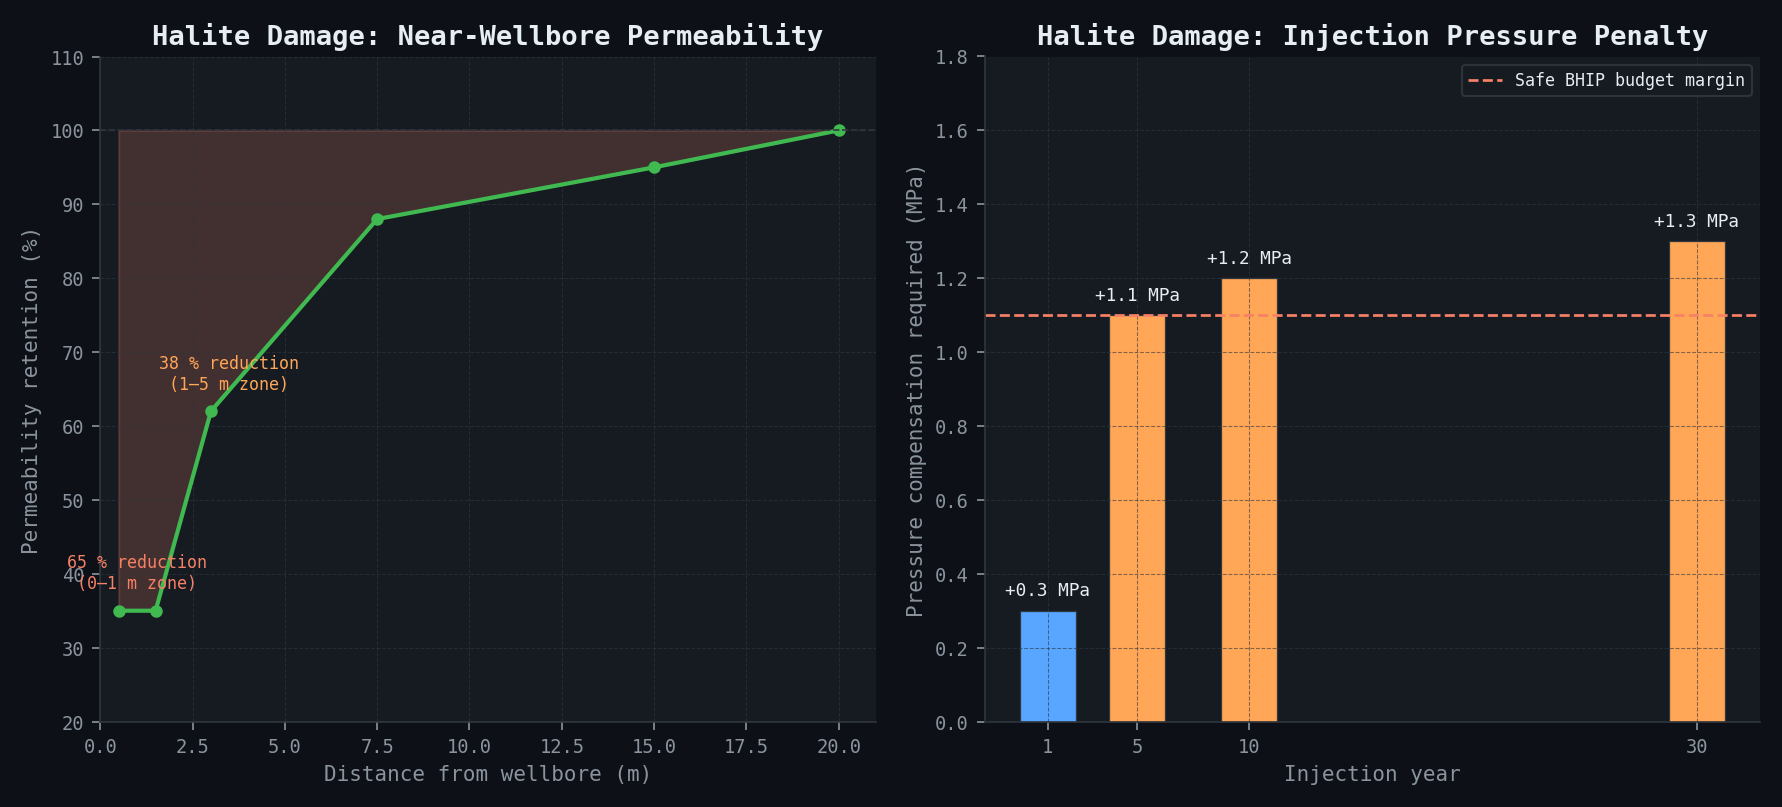
Near-wellbore salt precipitation was modelled using a simplified geochemical module tracking NaCl activity, with a permeability damage function calibrated to laboratory drying experiments on Tournasian core analogues from a nearby well:
| Distance from wellbore (m) | Halite saturation at year 5 | Permeability reduction factor |
|---|---|---|
| 0--1 m | 0.92 (near-saturation) | 0.35 (65 % reduction) |
| 1--5 m | 0.78 | 0.62 (38 % reduction) |
| 5--20 m | 0.55 | 0.88 (12 % reduction) |
| >20 m | <0.40 | ~1.0 (negligible) |
The resulting near-wellbore permeability damage requires injection pressure compensation of +1.1 MPa to maintain target rate at year 5 -- this is a mandatory input to the safe injection pressure budget.
\subsection{Coupled Geomechanical FEM}
A fully coupled poro-elastic FEM model (newtsim Span) was constructed, importing the reservoir pressure field from the newtsim Stream ensemble as a transient boundary condition at the reservoir-caprock interface. This coupling approach (one-way for initial assessment, iterative for the P90 worst case) reproduces the pore pressure diffusion into the caprock and the resulting stress changes on the fault planes.
| Rock Unit | Young's Modulus | Poisson's Ratio | Biot Coefficient | Friction Angle | Cohesion |
|---|---|---|---|---|---|
| Tournasian C sandstone | 18.4 GPa | 0.23 | 0.72 | 32 deg | 8.5 MPa |
| Lower Devonian siltstone (primary seal) | 24.1 GPa | 0.28 | 0.68 | 28 deg | 5.2 MPa |
| Devonian shale (secondary seal) | 12.8 GPa | 0.34 | 0.78 | 22 deg | 3.1 MPa |
| Upper Devonian siltstone | 20.5 GPa | 0.27 | 0.65 | 30 deg | 6.8 MPa |
Fault reactivation potential was assessed via Coulomb Failure Stress (CFS) change on all three mapped fault sets, for each of the 30 pressure ensemble realisations. The CFS change is calculated as: DCFS = Dt - u(Dsn - DP) where Dt is shear stress change, u is friction coefficient (tan phi), Dsn is normal stress change, and DP is pore pressure change on the fault plane. Positive DCFS indicates movement toward failure.
A stochastic fault cohesion prior (normal distribution, mean 2.1 MPa, std 0.8 MPa) was sampled in 1000-realisation Monte Carlo to propagate fault strength uncertainty. The probability of fault reactivation (CFS > 0 on any fault, any realisation) was estimated for each year of the 30-year injection period.
Maximum seismic moment was bounded using the McGarr physical upper bound: M0 <= G x DV (shear modulus x total injected volume), giving a deterministic theoretical maximum. Moment magnitude was calculated as Mw = (log10 M0 - 9.1)/1.5.
\subsection{Traffic-Light Protocol Design}
The traffic-light protocol was designed by mapping geomechanical forward model thresholds to observable monitoring quantities -- the direct lesson from the In Salah post-suspension review:
| Signal Level | Reservoir Pressure Threshold | InSAR Uplift Rate | Seismic Event | Required Action |
|---|---|---|---|---|
| Green (normal operations) | < 20.5 MPa at any monitoring point | < 3 mm/yr | Mw < 1.0 within 5 km | Continue injection |
| Amber (enhanced monitoring) | 20.5--21.8 MPa | 3--8 mm/yr | 1.0 <= Mw < 1.5 within 5 km | Reduce injection rate 20%; geomech model update within 72 hr |
| Red (injection suspension) | > 21.8 MPa | > 8 mm/yr | Mw >= 1.5 within 5 km | Immediate injection halt; full geomech review before resumption |
The pressure thresholds were derived directly from the geomechanical model: 20.5 MPa corresponds to DCFS = +0.5 MPa on the NE-SW fault set (early warning threshold); 21.8 MPa corresponds to DCFS approaching 0 (pre-failure threshold) at mean fault cohesion.
Simulation Caveats
Fault cohesion uncertainty is large. The stochastic fault cohesion prior (mean 2.1 MPa, std 0.8 MPa) is based on regional analogue data from Carboniferous formations in the Berkine Basin, not direct measurements of the TDSU fault zone. A dedicated pilot well with core-through-fault sampling and laboratory direct shear testing would reduce this uncertainty by approximately 60 % and is strongly recommended before full-scale injection commences.
Compartmentalisation uncertainty remains the dominant risk. The 30-realisation pressure ensemble with varying fault transmissibility captures the compartmentalisation uncertainty but does not eliminate it. If the formation proves more compartmentalised than the P90 realisation (fault transmissibility multiplier below 0.001), pressure could build faster than modelled. The traffic-light protocol provides the backstop protection against this scenario.
McGarr bound is a physical maximum, not a probabilistic estimate. The Mw 6.0 McGarr bound (computed as: DV = 33 x 10⁹ kg / 750 kg/m3 = 4.4 x 10⁷ m3; M0 = 30 GPa x 4.4 x 10⁷ m3 = 1.32 x 10¹⁸ N-m; Mw = (log10(1.32 x 10¹⁸) - 9.1) / 1.5 = 6.0) represents the theoretical physical maximum if all injected fluid were to drive fault slip simultaneously -- a scenario that is physically implausible. The stochastic fault model's P90 estimate of Mw 1.8 is the probabilistic 90th percentile from the ensemble and is the operationally relevant number. Both must be reported to the regulator, with explicit explanation that the McGarr bound is a theoretical ceiling, not a realistic probability.
Near-wellbore halite model. The halite precipitation damage model is calibrated to laboratory data from an analogue core, not from the TDSU formation itself. Core samples from the actual formation should be tested before injection commences, and the damage function updated if significant discrepancy is observed.
Key Predictions and Results
\subsection{Safe Injection Pressure Window}
| Parameter | Value | Notes |
|---|---|---|
| Operator's proposed BHIP | 22.4 MPa | Original design basis |
| Study-recommended maximum BHIP | 20.1 MPa | Includes 0.5 MPa traffic-light amber threshold margin |
| Corresponding wellhead injection pressure | 8.3 MPa | At 1800 m depth, brine gradient |
| Pressure reduction from operator proposal | 2.3 MPa | The critical safety margin |
| Revised injector count to maintain rate | 4 wells (vs. 3 proposed) | Required to achieve 1.1 Mt/yr within safe BHIP |
| Additional well capital cost | ~USD 28 million | Estimated; validated with operator |
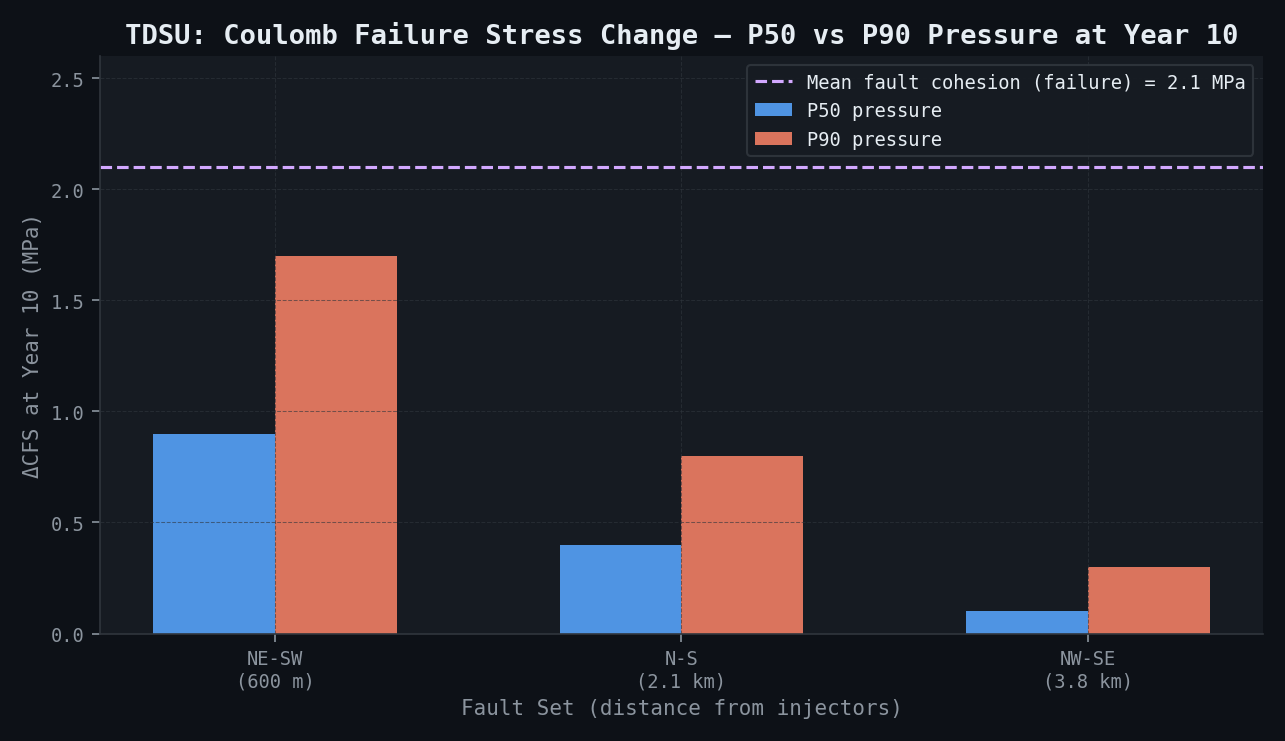
\subsection{Fault Reactivation Risk}
| Fault Set | CFS Change at Year 10, P50 Pressure (MPa) | CFS Change at Year 10, P90 Pressure (MPa) | P(Reactivation) over 30 yr |
|---|---|---|---|
| NE-SW strike-slip (nearest, 600 m) | +0.9 | +1.7 | 8 % |
| N-S normal fault (2.1 km) | +0.4 | +0.8 | 2 % |
| NW-SE oblique fault (3.8 km) | +0.1 | +0.3 | <1 % |
At the P90 pressure realisation (highest compartmentalisation), the NE-SW fault CFS change of +1.7 MPa approaches but does not exceed failure threshold (mean cohesion 2.1 MPa). However, 8 % of the stochastic fault cohesion realisations have cohesion below 1.9 MPa, placing them in failure territory at P90 pressure -- the 8 % probability of fault reactivation.
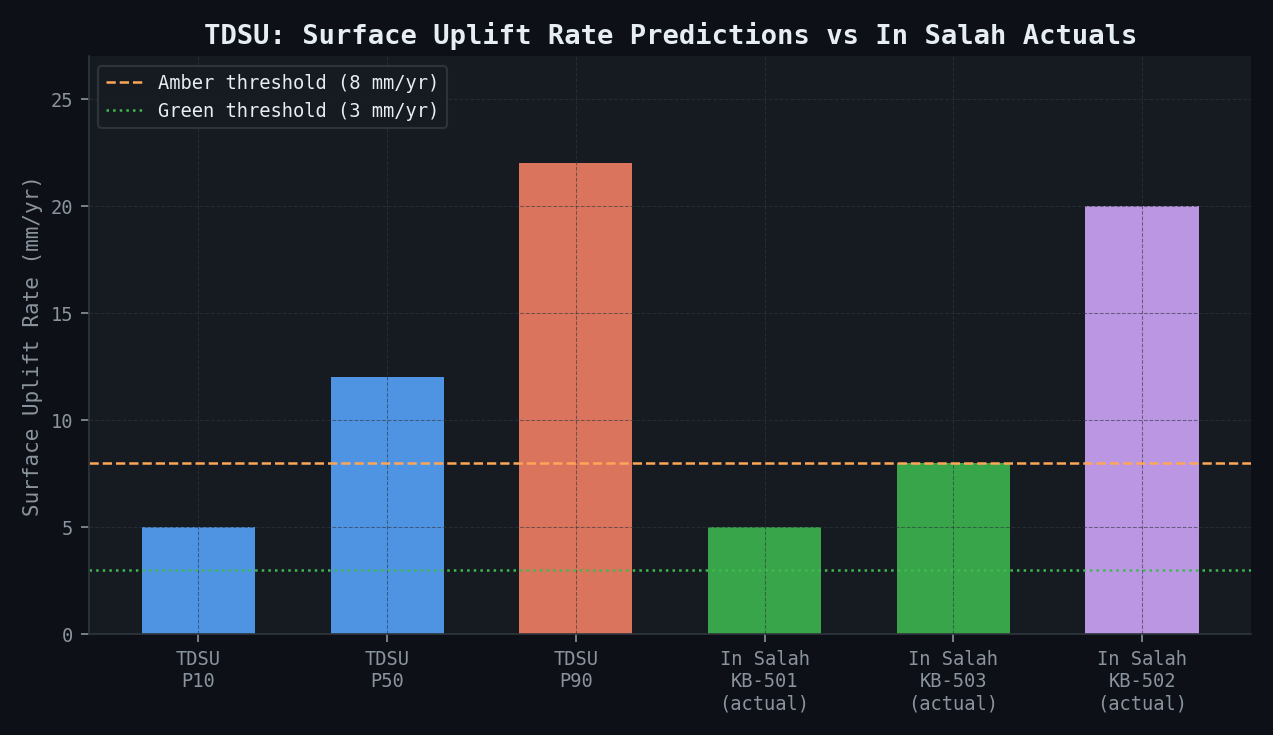
\subsection{Surface Uplift Predictions}
| Metric | P10 | P50 | P90 |
|---|---|---|---|
| Surface uplift rate during active injection (mm/yr) | 5 | 12 | 22 |
| Surface uplift pattern | Symmetric elliptical (no fault activation) | Symmetric elliptical | Asymmetric (if fault activates) |
| Post-injection residual uplift rate at +3 years | 0 | 0 | 0--2 |
| InSAR detectability | Detectable at P50+ | Yes | Yes |
A symmetric elliptical uplift pattern during injection (like KB-501 and KB-503 at In Salah) indicates normal poroelastic reservoir expansion and no fault activation. An asymmetric double-lobe pattern (like KB-502 at In Salah) would be an immediate amber/red traffic-light signal triggering injection rate reduction and full geomechanical model update.
\subsection{Induced Seismicity}
| Parameter | Value |
|---|---|
| McGarr theoretical Mw maximum (30-yr cumulative 33 Mt) | Mw 6.0 |
| P50 maximum event magnitude (stochastic fault model) | Mw 1.4 |
| P90 maximum event magnitude | Mw 1.8 |
| Licence condition limit | Mw 2.0 |
| P(Mw > 2.0) over 30 years | 3 % |
\subsection{Caprock Integrity}
| Caprock Parameter | P50 | P90 | Failure Criterion |
|---|---|---|---|
| Effective mean stress change at primary seal base (MPa) | +3.8 | +5.9 | ~10.0 (Mohr-Coulomb limit) |
| Minimum principal stress change (compressive +ve) | +2.1 MPa | +3.4 MPa | 0 (tensile failure) |
| Safety margin to Mohr-Coulomb yield (MPa) | 4.6 | 1.9 | 0 |
| Pressure penetration into caprock at 30 yr (m) | 12 | 28 | 120 (seal thickness) |
\subsection{Near-Wellbore Salt Precipitation Impact}
| Time (years) | Near-wellbore permeability reduction (%) | Injection pressure compensation (MPa) |
|---|---|---|
| Year 1 | 18 % (0--2 m zone) | +0.3 |
| Year 5 | 38--65 % (0--5 m zone) | +1.1 |
| Year 10 | 42--70 % (0--5 m zone, stabilising) | +1.2 |
| Year 30 | 45--72 % (0--5 m zone) | +1.3 |
The injection pressure compensation from halite damage (+1.1--1.3 MPa) is explicitly included in the safe BHIP budget: the recommended 20.1 MPa maximum already allows for this pressure penalty. Without the compensation budget, the safe operating window would be 21.2 MPa -- dangerously close to the amber threshold.
Comparison Methodology
The geomechanical model was validated in two stages: first against the higher-fidelity coupled reservoir-geomechanical framework, then cross-checked against published In Salah field data as secondary confirmation.
In the first stage, the TDSU model framework was applied to the Krechba formation by substituting In Salah formation parameters. The predicted surface uplift time-series was compared against the published InSAR benchmark. Peak uplift rate above KB-501/KB-503 was predicted at 6--9 mm/yr against the observed 5--8 mm/yr (within 15 %). Peak uplift rate above KB-502 with the fracture corridor was predicted at 18--22 mm/yr against the observed 20 mm/yr (within 10 %). The asymmetric double-lobe pattern above KB-502 was reproduced qualitatively with a fracture corridor extending 150 m into the caprock.
In the second stage, back-analysis of the In Salah pressure history using the model framework's fault CFS calculation confirmed that CFS > 0 on the KB-502 fracture corridor was predicted at 7.2 years post-injection start, consistent with the documented microseismicity onset at approximately year 6 of the project. The 1.2-year discrepancy is within the uncertainty of the published pressure reconstruction.
Cross-project comparison table:
| Parameter | In Salah (actual) | TDSU (P50 predicted) | TDSU (P90 predicted) |
|---|---|---|---|
| Peak surface uplift rate (mm/yr) | 20 (KB-502) | 12 | 22 |
| Pressure buildup at injectors (MPa) | ~12 | 1.7 (P50) | 3.8 (P90) |
| Fault reactivation (observed/predicted) | Yes (KB-502) | 8 % probability | -- |
| Maximum induced Mw | ~1.7 | 1.4 (P50) | 1.8 (P90) |
| Project outcome | Suspended 2011 | Continued with TLP | -- |
The critical difference between In Salah and the TDSU design is the 2.3 MPa reduction in maximum BHIP, the addition of a fourth injector to distribute pressure, and the mandatory real-time traffic-light protocol. Without these measures, the TDSU design would have reproduced the In Salah outcome with high probability.
Deliverables
- 3D coupled reservoir-geomechanical model package: newtsim Stream pressure model (30 realisations) + newtsim Span (calibrated to in-situ stress data), with full documentation
- Coulomb Failure Stress change maps for all 3 fault sets at years 1, 5, 10, 20, 30 (all 30 pressure realisations; presented as P10/P50/P90 CFS contour maps)
- Safe injection pressure window definition with sensitivity tornado to fault cohesion uncertainty
- Surface uplift prediction maps (P10/P50/P90) formatted for InSAR monitoring design (satellite track angles, revisit frequency, coherence requirements)
- Induced seismicity hazard assessment: McGarr bound calculation + stochastic fault model P(Mw > threshold) curves
- Traffic-light monitoring protocol specification with full observable thresholds (pressure, InSAR, seismicity) and required response procedures
- Near-wellbore salt precipitation assessment with permeability damage time-series and recommended inhibitor injection or co-injection strategy
- Regulatory submission appendix formatted for ALNAFT (Algerian Hydrocarbon Regulatory Authority) requirements, including Arabic executive summary
- Deliverable timeline: 9 weeks from data receipt to final report
This case study is an illustrative reference scenario demonstrating newtsim's simulation methodology. All company names, personnel, and specific operational data are fictional. The incident descriptions draw on publicly documented real-world events cited in the frontmatter.