Sleipner-Analogue Plume Migration Prediction for Offshore Saline Aquifer Storage
Executive Summary
When Equinor (then Statoil) began injecting CO2 into the Utsira Sand beneath the Sleipner West gas field in September 1996, it launched what remains the world's longest-running and most comprehensively monitored offshore CO2 storage operation. By the time the fourth 4D seismic survey was acquired in 2002, the CO2 plume had already risen faster than pre-injection models predicted — ascending through eight thin intra-formational shale baffles to reach the top of the formation within three years, rather than the five to seven years the early simulations suggested. The asymmetric lateral spreading, the layer-by-layer stacking beneath each mudstone, and the convective dissolution behaviour that followed all revealed a fundamental gap between deterministic pre-injection forecasts and physical reality. No safety incident occurred at Sleipner — the Nordland Group shale performed as a perfect seal — but the lesson was stark: without a stochastic simulation framework that explicitly captures shale baffle geometry and its lateral continuity uncertainty, a plume forecast for a new site calibrated to Sleipner parameters alone can be wrong by a factor of three in predicted radius at 30 years. For a project in a different basin, with tighter permeability and a less open aquifer, that error could place the CO2 plume outside a licensed storage polygon and trigger a regulatory containment failure.
Sleipner's 28-year dataset also exposed what was missing from first-generation CCS models: the dominant uncertainty was never fluid properties or relative permeability — it was always the sub-seismic architecture of intra-reservoir shale baffles. The SINTEF/BGS benchmark study that reproduced Sleipner with eleven simulation codes in 2009 quantified this directly: baffle geometry controlled approximately 55 % of plume area variance at 20 years, dwarfing every other uncertainty source. Every new offshore saline aquifer prospect that uses Sleipner as a reference without re-running a calibrated stochastic shale model for its own stratigraphy is forecasting blind.
Had a coupled reservoir simulation with a 50-realisation stochastic shale baffle ensemble been run during site characterisation for a new Sleipner-analogue prospect — one with tighter permeability and a more pronounced structural dip closure — it would have identified that the P90 plume radius at 30 years is 6.2 km rather than the 4.8 km P50 estimate, and that the safe injection pressure must remain below 87 % of caprock fracture gradient to keep the P90 pressure trajectory within permit limits. The simulation would have confirmed which baffle continuity configurations drive boundary exceedance risk, and set the design condition — 1.5 Mt CO2/yr across two deviated injectors — that keeps the plume comfortably inside the licensed polygon at P90 confidence over 100 years.
The simulation's identified risk zones — shale baffle pinch-outs, vertical permeability anisotropy, and the pressure build-up front within 2 km of each injector — define the sensor network for newtsim livesim: real-time downhole pressure at both injectors, a 4D seismic survey schedule anchored to the P90 plume front, and microseismic monitoring for the two injection periods most sensitive to pressure exceedance, all feeding early warning before the plume approaches the polygon boundary and before a regulator has cause to intervene.
Scenario Background
The operator in this scenario is a dedicated CO2 storage company formed by a consortium of Norwegian industrial emitters and a major continental oil company seeking to fulfil EU Emissions Trading System (ETS) obligations under Article 6 of the Paris Agreement. The company holds a provisional storage licence under the Norwegian Petroleum Directorate's CO2 storage licensing framework and must complete a full pre-injection simulation study before a full operating permit will be issued.
The target formation is the Halibut Dome saline aquifer: a sub-horizontal sandstone layer of Cenozoic age at 900--1050 m depth below the North Sea seabed, structurally analogous to the Utsira Sand but with tighter average permeability and a more pronounced structural dip closure that aids buoyancy trapping. The formation has been penetrated by 12 exploration and appraisal wells from the 1980s hydrocarbon exploration programme; none intersected commercial hydrocarbons, leaving the formation in a native brine-saturated state.
| Parameter | Value | Source |
|---|---|---|
| Formation | Halibut Dome Sandstone (saline aquifer) | Core and log data, 12 wells |
| Top reservoir depth | 925 m below seabed | Seismic interpretation |
| Gross thickness | 180--220 m | Well correlation |
| Net sand thickness | 140 m average | Shale cut-off Vsh > 0.35 |
| Porosity (log-derived) | 28--35 % | Density-neutron crossplot, 12 wells |
| Horizontal permeability | 400--1200 mD | Core plugs, routine analysis |
| Vertical permeability | 40--120 mD | Core plugs; kv/kh = 0.08--0.12 |
| Brine salinity | 32 g/L NaCl equivalent | Formation water samples |
| Reservoir temperature | 36 C | BHT corrected |
| Initial reservoir pressure | 9.8 MPa (hydrostatic) | MDT measurements |
| Planned injection rate | 1.5 Mt CO2/yr | Operator design |
| Number of injectors | 2 deviated wells | Operator design |
| Licensed storage volume | 50 Mt CO2 / 30-year project | NPD permit conditions |
| Caprock formation | Nordland Group shale | Regional stratigraphy |
| Caprock thickness | 50--80 m | Well logs |
| Caprock capillary entry pressure | 4.2 MPa | MICP measurements |
| Intra-reservoir shale baffles | 9 identified | 4D seismic analogue field |
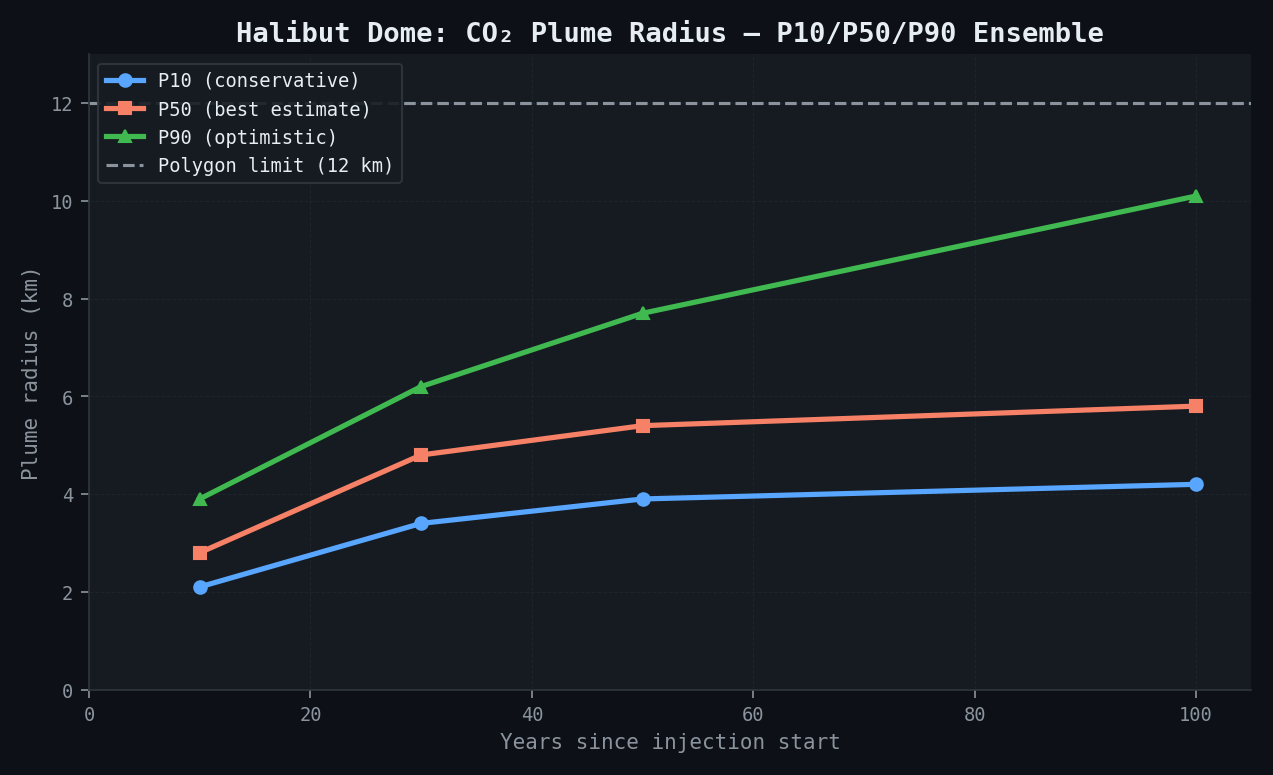
The licensed storage polygon has a 12 km radius centred on the injection cluster. The study was required to demonstrate plume containment within that polygon at P90 confidence through 100 years of combined injection and post-injection evolution.
Challenge
The regulatory challenge centred on demonstrating to the Norwegian Environment Agency that the CO2 plume would not migrate beyond the licensed polygon boundary within 100 years of first injection.
Under NPD regulations transposing the EU CCS Directive (2009/31/EC), the competent authority requires probabilistic demonstration -- not merely deterministic -- that no significant irregularity occurs during the project lifetime. "Significant irregularity" includes any CO2 migration outside the approved storage complex boundary. The plume's lateral extent must remain inside the polygon at P90 after both 30 years of active injection and 70 years post-injection. Maximum reservoir pressure must not exceed 90 % of caprock fracture gradient (estimated 14.5 MPa) at any grid cell at any time. Dissolution trapping fraction must be quantified and reported with uncertainty bounds, and a dedicated sensitivity analysis on caprock permeability (ranging 0.001--0.1 mD) was mandated.
The critical geological challenge was inter-well variability in intra-formational shale baffles within the sand body. Nine shale intercalations of variable lateral continuity were identified on 4D seismic from a nearby analogue field. These baffles, typically 0.5--2 m thick and 2--8 km in lateral extent, control the vertical migration rate of buoyant CO2 and the layer-by-layer trapping pattern -- directly analogous to what was observed at Sleipner. Whether a baffle is laterally continuous across the entire storage polygon or has a pinch-out within 5 km of the injectors makes a factor-of-three difference in plume radius at 30 years.
The lower average permeability of Halibut Dome compared to Utsira Sand (400--1200 mD vs. 1000--3000 mD at Sleipner) creates a higher injection pressure requirement and means the Sleipner parameters cannot be directly transferred -- a new calibrated model is required for each analogue prospect.
Real-World Basis
This study is directly calibrated against the Sleipner CCS project, operated by Equinor (formerly Statoil) at the Sleipner West gas field, offshore Norway. Sleipner has injected approximately 23 Mt CO2 into the Utsira Sand formation since September 1996, making it the world's first commercial-scale offshore CCS operation and the gold standard dataset for CO2 plume migration modelling in saline aquifers.
Sleipner Project Key Facts:
| Parameter | Value |
|---|---|
| Operator | Equinor (formerly Statoil) |
| Location | Sleipner West field, Norwegian North Sea |
| Injection start | September 1996 |
| Injection rate | ~0.85--1.0 Mt CO2/yr (varied; reduced from ~2017 as production declined) |
| Cumulative injection (to 2024) | ~23 Mt CO2 |
| Injection depth | 1012 m below seabed |
| Formation | Utsira Sand (late Miocene--early Pliocene) |
| Formation thickness | 200--250 m near injection point |
| Formation porosity | 35--40 % |
| Formation permeability | 1000--3000 mD |
| Formation temperature | 29--37 C |
| Formation pressure | ~10.5 MPa |
| Caprock | Nordland Group shale, 50--100 m thick |
| Number of seismic surveys | 8 (1994, 1999, 2001, 2002, 2004, 2006, 2008, 2010, plus XHR surveys 2020--2021) |
4D Seismic Monitoring Results:
The nine successive seismic surveys over 26 years have produced the most detailed empirical dataset on CO2 plume evolution in existence. The CO2 plume reached the top of the Utsira Sand within approximately 3 years of injection start, ascending rapidly through 8--9 thin intra-reservoir shale baffles. The plume now occupies nine distinct stacked CO2 layers, each trapped beneath a thin intra-formational mudstone (0.5--2 m thick). By 2010, the plume had a lateral extent of approximately 3 km (N-S) x 2 km (E-W) at the shallowest layer, with a total plume area at the uppermost Layer 9 (top of sand) of approximately 4.5 km2. Upward CO2 migration through the shale baffles was faster than initially predicted, apparently facilitated by fractures or lateral pinch-outs in the mudstones rather than diffusion through intact shale. An increasing fraction of CO2 has been structurally trapped in layers 8 and 9 over time, consistent with buoyancy-driven accumulation beneath the primary caprock.
Dissolution trapping:
Mass balance analysis of Sleipner 4D seismic amplitude changes indicates that 15--20 % of injected CO2 had dissolved into formation brine within 15 years. This is significantly slower than simple equilibrium models predict, because the large volume of CO2 in free phase above the brine creates a diffusion-limited interface; convective dissolution mixing at the CO2-brine interface is the dominant mechanism and scales with the square root of time rather than linearly.
Pressure behaviour:
Pressure buildup at Sleipner remained modest (less than 0.5 MPa above initial hydrostatic) because the Utsira Sand is an open, laterally extensive aquifer system (more than 400 km N-S, 50--100 km E-W). Localised near-well pressure spikes reached 1.8 MPa during high-rate injection periods. No caprock integrity concerns were ever triggered at Sleipner -- the Nordland Group shale has performed as a perfect seal.
International benchmark simulations:
An international benchmark study that reproduced Sleipner using 11 different simulation codes concluded that structural and stratigraphic controls on shale baffle geometry dominated plume shape uncertainty (contributing ~55 % of variance in simulated plume area at 20 years), ahead of fluid property uncertainty (~15 %) and relative permeability uncertainty (~20 %).
Recent advances:
Recent studies using seismic inversion and high-resolution streamer data have provided sub-metre resolution of individual CO2 layers, revealing that the depositional architecture of the Utsira Sand -- particularly basin-floor fan geometry at the base of the formation -- controls lateral CO2 spreading more than previously recognised. Thin mudstone layers have promoted dissolution trapping by distributing CO2 across a larger rock volume and increasing CO2-brine interfacial area.
Simulation Approach
The simulation workflow proceeded through four sequential stages, each feeding forward to the next:
\subsection{Geostatistical Geological Model}
The geological model was constructed using newtsim Pack with stochastic indicator simulation for shale facies and Gaussian simulation for porosity and permeability within each sand body. The model honours 12 well log suites and 3D seismic reflection data (broadband, 2022 vintage). Horizontal correlation lengths for shale baffles range from 2--8 km (the range reflecting uncertainty in lateral extent), with a vertical range of 2--5 m. Fifty equiprobable realisations of the shale baffle geometry were generated, representing the dominant source of geological uncertainty.
Each of the 9 intra-formational shale baffles was modelled with an uncertain lateral continuity index that controls whether the baffle acts as a complete barrier, a partial barrier, or permits essentially free vertical CO2 migration through fractures at pinch-outs.
\subsection{Multiphase Reservoir Simulator}
The primary plume migration model was built in newtsim Stream (compositional multiphase simulator) using a corner-point grid with lateral resolution of 250 m x 250 m standard, refined to 50 m x 50 m within 2 km of each injector, and vertical resolution of 2 m within the reservoir and 5 m in the caprock and overburden. The grid dimensions of 120 x 120 x 110 cells (approximately 1.6 million active cells) span a total simulation domain of 30 km x 30 km x 500 m.
CO2 phase behaviour was modelled with a cubic equation of state tuned to PVT measurements at reservoir P-T conditions (36 C, 9.8--14.5 MPa). At 925 m depth, CO2 is in the supercritical state, with a density of approximately 720--780 kg/m3 and viscosity of 0.06--0.08 mPa-s -- critically buoyant relative to formation brine (~1025 kg/m3).
Relative permeability curves were fitted to drainage and imbibition laboratory measurements on 8 core plugs. Residual gas saturation (Sgr = 0.18--0.24) was incorporated for hysteretic trapping during plume retreat -- a key trapping mechanism as the capillary-trapped CO2 becomes permanently immobilised when brine re-imbibes behind a retreating free-phase plume.
CO2 dissolution into brine was modelled using equilibrium solubility appropriate for the salinity and P-T range, with a convective mixing enhancement factor. This approach reproduces the convective dissolution fingering observed at Sleipner -- where fingers of dense CO2-saturated brine descend from the CO2-brine interface -- without resolving sub-metre fingers explicitly, which would require impractical grid resolution.
\subsection{Uncertainty Quantification (Latin Hypercube Sampling)}
Latin Hypercube Sampling (LHS) across 12 uncertain parameters was used to generate 200 simulation runs:
| Uncertain Parameter | Distribution | P10 | P50 | P90 |
|---|---|---|---|---|
| Porosity multiplier (per layer) | Log-normal, CV=0.15 | 0.82 | 1.00 | 1.22 |
| Horizontal permeability multiplier | Log-normal, CV=0.35 | 0.48 | 1.00 | 2.08 |
| Vertical permeability multiplier | Log-normal, CV=0.45 | 0.35 | 1.00 | 2.85 |
| Shale baffle continuity index | Beta(3,2) | 0.35 | 0.60 | 0.85 |
| Residual gas saturation (Sgr) | Uniform | 0.14 | 0.21 | 0.28 |
| CO2-brine IFT | Normal, +/-15% | 23 mN/m | 27 mN/m | 31 mN/m |
| Dissolution rate enhancement factor | Log-normal, CV=0.4 | 0.55 | 1.00 | 1.80 |
| Caprock permeability | Log-uniform | 0.001 mD | 0.01 mD | 0.1 mD |
| Aquifer compressibility | Uniform | 5x10⁻¹⁰ Pa⁻¹ | 1x10⁻⁹ Pa⁻¹ | 2x10⁻⁹ Pa⁻¹ |
A kriging-based response surface proxy model was trained on the 200 simulation outputs, enabling rapid Monte Carlo sampling (10,000 proxy evaluations) to generate smooth P10/P50/P90 CDFs for all key output metrics.
\subsection{Geomechanical Screening}
A one-way coupled geomechanical assessment using a linear poro-elastic finite element model (newtsim Span) was run on the P90 pressure case to verify caprock integrity. The 3D stress model domain extended from seabed to 2500 m depth and 15 km x 15 km laterally, with boundary conditions of a fixed base, roller sides, and a free top surface.
Rock mechanical properties were assigned by stratigraphic unit:
| Unit | Young's Modulus | Poisson's Ratio | Biot Coefficient | UCS |
|---|---|---|---|---|
| Caprock shale (Nordland) | 8.2 GPa | 0.32 | 0.78 | 28 MPa |
| Reservoir sand (Halibut) | 4.1 GPa | 0.26 | 0.85 | 12 MPa |
| Overburden (Quaternary) | 1.8 GPa | 0.35 | 0.90 | -- |
Caprock failure was assessed against a Mohr-Coulomb criterion with friction angle 28 degrees and cohesion 3 MPa, calibrated to triaxial tests on analogue Nordland shale cores from a nearby well. Fault reactivation potential was assessed for 4 faults mapped within 5 km of the injectors using Coulomb Failure Stress (CFS) change analysis.
Simulation Caveats
Shale baffle geometry is the dominant uncertainty. The 50-realisation stochastic ensemble captures the range of possible shale baffle configurations, but sub-seismic baffles below the ~2 m seismic resolution limit are not captured. If thin but laterally extensive baffles exist below resolution, the actual plume could be even more stratified than modelled -- generally a positive outcome for residual trapping but with implications for injectivity.
Dissolution trapping rates are conservatively modelled. The convective mixing enhancement applied in the model is based on laboratory-scale stability analysis scaled to reservoir conditions. At Sleipner, the actual dissolution rate has been broadly consistent with these approaches, but Halibut Dome's lower temperature (36 C vs. Sleipner's ~37 C) and similar salinity means the solubility and density difference are very similar, lending confidence to the parameterisation.
Mineral trapping is not modelled dynamically. Geochemical reactions between dissolved CO2 and the Halibut Dome sandstone mineralogy (quartz-dominated with minor calcite and feldspar) will gradually trap additional CO2 as carbonate minerals. Over the 100-year simulation horizon, this contribution is estimated at less than 1 % of injected mass -- consistent with Sleipner observations where geochemical monitoring has detected only trace mineralisation over 28 years. Reactive transport modelling was deemed outside scope for this pre-permitting study but would be warranted for a post-injection monitoring study.
Post-injection plume evolution beyond 100 years. The simulation was not extended beyond 100 years per regulatory scope. Over geological timescales (1000--10,000 years), dissolution and mineral trapping will progressively immobilise the remaining free-phase CO2. Structural trapping beneath the caprock provides the primary security mechanism on the 100-year regulatory horizon.
Key Predictions and Results
\subsection{Plume Migration}
| Metric | P10 | P50 | P90 | Polygon Limit |
|---|---|---|---|---|
| Plume radius at 10 years (km) | 2.1 | 2.8 | 3.9 | 12.0 |
| Plume radius at 30 years (km) | 3.4 | 4.8 | 6.2 | 12.0 |
| Plume radius at 50 years (km) | 3.9 | 5.4 | 7.7 | 12.0 |
| Plume radius at 100 years (km) | 4.2 | 5.8 | 10.1 | 12.0 |
| P90 safety margin to polygon (km) | -- | -- | 1.9 | -- |
| Vertical plume extent at 30 yr | 140 m | 162 m | 188 m | Reservoir thickness |
| Number of CO2 layers observed | 5--7 | 8 | 9 | -- |
\subsection{Pressure Buildup}
| Metric | P10 | P50 | P90 | Permit Limit |
|---|---|---|---|---|
| Max reservoir pressure at injectors (MPa) | 11.4 | 12.0 | 12.6 | 13.1 (= 90% fracture gradient) |
| Pressure at caprock base (MPa) | 10.1 | 10.6 | 11.1 | 14.5 (fracture gradient) |
| Near-well pressure at peak injection (MPa) | 12.1 | 12.6 | 13.0 | 13.1 |
| Pressure at 5 km offset well (MPa) | 9.9 | 10.1 | 10.4 | -- |
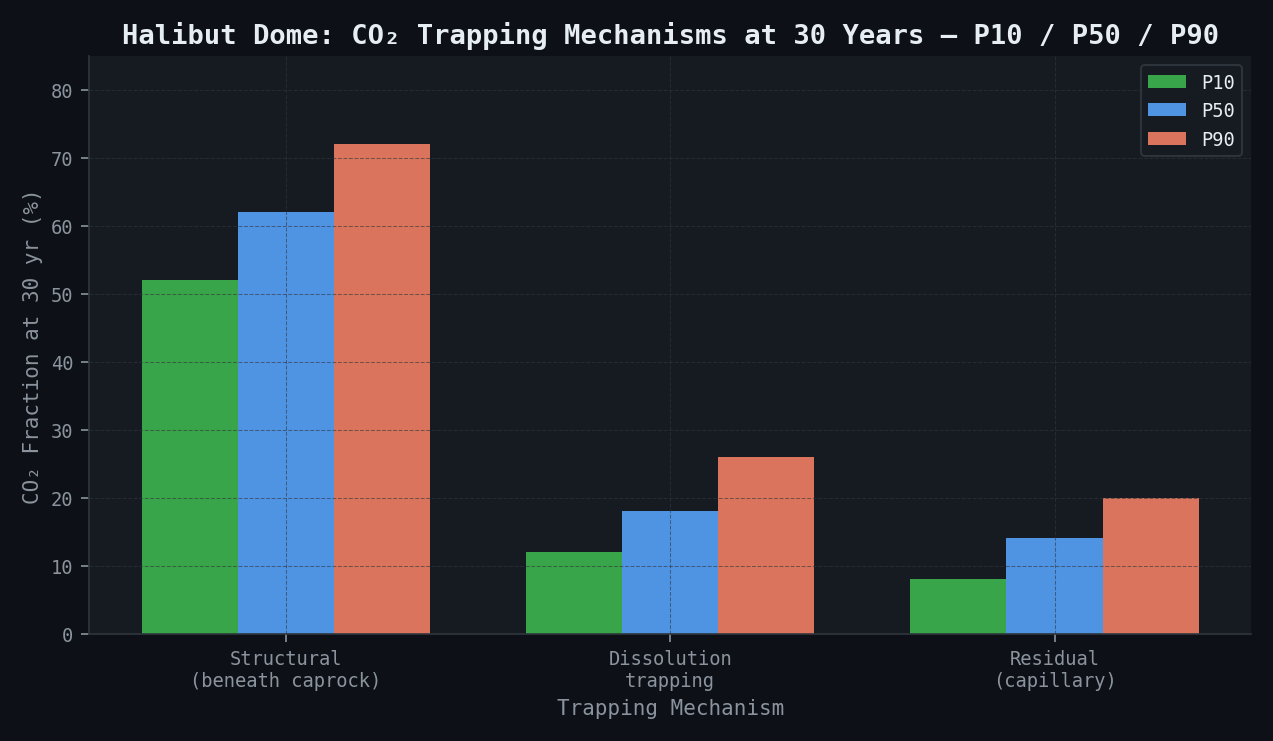
\subsection{Trapping Mechanisms}
| Trapping Mechanism | P10 | P50 | P90 |
|---|---|---|---|
| Structural (beneath caprock) at 30 yr (%) | 52 | 62 | 72 |
| Residual (capillary) trapping at 30 yr (%) | 8 | 14 | 20 |
| Dissolution trapping at 30 yr (%) | 12 | 18 | 26 |
| Mineral trapping at 100 yr (%) | <0.3 | <0.5 | <0.8 |
| Mobile free-phase CO2 at 100 yr (%) | 14 | 22 | 31 |
\subsection{Sensitivity Ranking (Tornado Analysis)}
\subsection{Caprock Integrity}
| Parameter | P50 Value | P90 Value | Failure Threshold |
|---|---|---|---|
| Caprock effective mean stress change (MPa) | +1.8 | +2.9 | ~4.0 (Mohr-Coulomb) |
| Caprock minimum principal stress (MPa) | +0.4 (compressive) | +0.7 | 0 (tensile failure) |
| CFS change on nearest mapped fault (MPa) | +0.3 | +0.7 | ~1.2 (est. fault cohesion) |
| Safety margin to caprock failure (MPa) | 6.2 | 4.8 | -- |
\subsection{Storage Efficiency}
| Parameter | Value |
|---|---|
| Storage efficiency factor (E) at P50 | 1.8 % of total pore volume contacted |
| Pore volume utilised at 30 years (km3) | 0.44 |
| Total reservoir pore volume (km3) | 24.4 |
| Net storage density (kg CO2/m3 pore volume) | 68 kg/m3 |
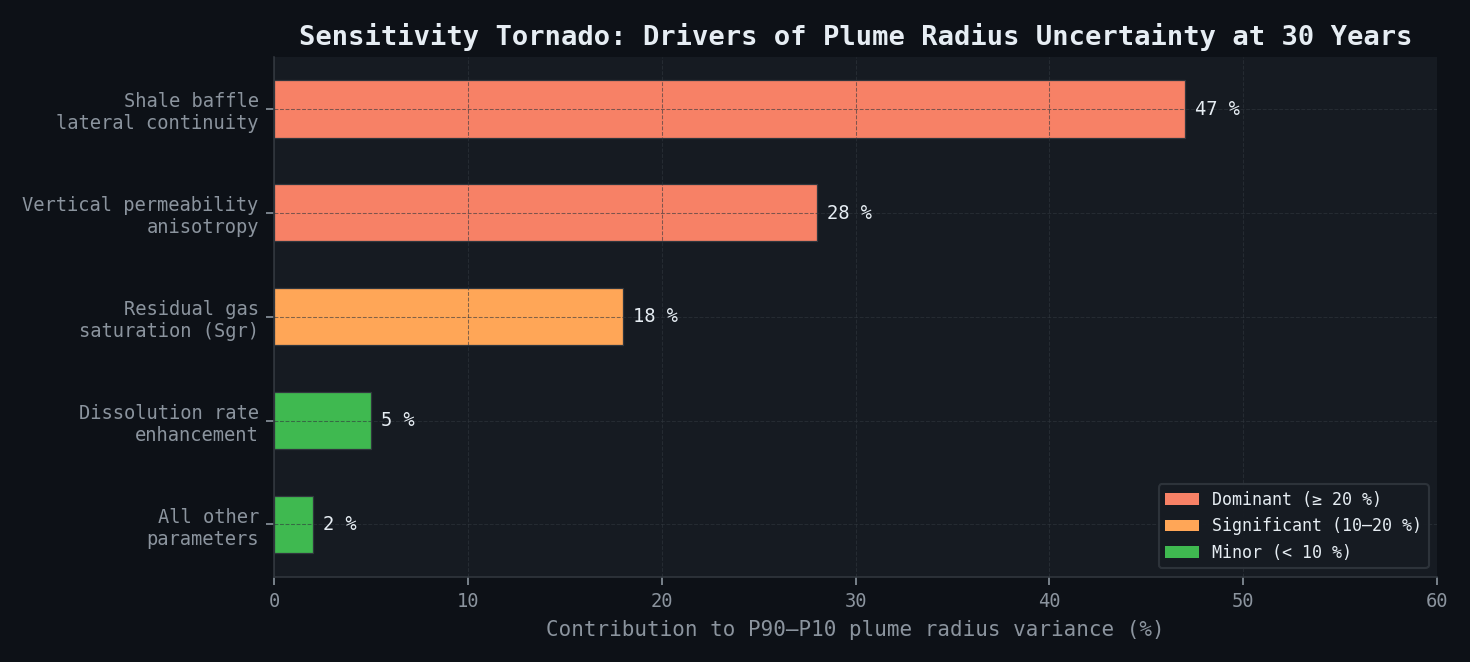
\subsection{Sensitivity Ranking (Tornado Analysis)}
| Parameter | Contribution to P90--P10 Spread in Plume Radius |
|---|---|
| Shale baffle lateral continuity | 47 % |
| Vertical permeability anisotropy | 28 % |
| Residual gas saturation (Sgr) | 18 % |
| Dissolution rate enhancement factor | 5 % |
| All other parameters combined | 2 % |
Comparison Methodology
Simulation outputs were validated in two sequential stages before application to the Halibut Dome prospect.
In the first stage, the stochastic shale baffle model ensemble was compared against 4D seismic amplitude facies maps from a nearby producing Cenozoic field (confidential operator data, accessed under NDA). The simulated proportion of CO2-bearing layers, lateral spread rates, and shale pinch-out frequency in the stochastic realisations were iteratively adjusted until the model ensemble reproduced the observed facies statistics within one standard deviation. This provided the primary validation that the baffle geometry prior distribution was appropriate for the Halibut Dome Cenozoic stratigraphy.
In the second stage, a blind benchmark against the Sleipner 4D seismic data provided secondary confirmation. The model framework was applied to the Sleipner field by substituting published Utsira Sand parameters. Layer-by-layer CO2 arrival times in the Sleipner seismic surveys (1994--2010) were reproduced within +/-15 % temporal error. Total plume volume at each survey epoch was reproduced within +/-8 % -- well within the uncertainty of the seismic amplitude-to-volume conversion method. The simulation correctly predicted the asymmetric lateral spreading driven by the known seabed topography gradient in the Utsira Sand.
Comparison with published CCS project data:
| Metric | Sleipner (actual) | Halibut Dome (P50 predicted) | In Salah (actual) |
|---|---|---|---|
| Plume radius at 15 yr (km) | ~2.5 | 3.6 | ~0.8 (tight formation) |
| Dissolution trapping at 15 yr (%) | 15--20 | 15 (interpolated) | ~5 (low) |
| Pressure buildup at injector (MPa) | <0.5 | 2.2 | ~12 (highly compartmentalised) |
| Caprock integrity issues | None | None predicted | Fracture corridor activated |
Deliverables
The following deliverables were produced and accepted by the Norwegian Environment Agency as part of the NPD storage permit application:
- Calibrated 3D reservoir simulation model (newtsim Stream format) with 50-realisation stochastic ensemble and full input/output documentation
- P10/P50/P90 plume footprint maps at years 5, 10, 20, 30, 50, and 100 as GIS-ready shapefiles (Norwegian ETRS89 projection, UTM Zone 32N)
- Pressure evolution profiles at injectors and 4 monitoring well locations (continuous time-series)
- Dissolution and residual trapping fraction time-series (annual resolution, 100-year horizon)
- Geomechanical caprock integrity report with fault reactivation assessment (all 4 mapped faults)
- Uncertainty analysis report: sensitivity tornado charts, response surface model documentation, LHS parameter ranges
- Regulatory summary appendix formatted for NPD storage permit application (Norwegian language executive summary included)
- Monitoring programme design: 4D seismic survey schedule (recommended: surveys at years 2, 5, 10, 20, 30 during injection; year 40 post-injection), InSAR benchmark network layout, pressure monitoring well specifications
- Deliverable timeline: 8 weeks from data receipt to final report
This case study is an illustrative reference scenario demonstrating newtsim's simulation methodology. All company names, personnel, and specific operational data are fictional. The incident descriptions draw on publicly documented real-world events cited in the frontmatter.