Molecular Simulation of Soil Degradation Kinetics and DT50 Estimation for a Triazole Fungicide Development Program
Executive Summary
Epoxiconazole, a systemic CYP51-inhibiting triazole fungicide sold by BASF under the trade name Opus, had been in commercial use across European cereal and oilseed rape crops since 1993 when EFSA's 2018 renewal peer review found DT50 values exceeding 365 days in multiple submitted soil dissipation studies. The European Commission declined to renew approval under Commission Implementing Regulation (EU) 2020/505. The EU annual market value for epoxiconazole was estimated at over EUR 300 million at the time of non-renewal; the withdrawal imposed immediate losses on BASF and required crop protection programmes across European cereal farming to reformulate without one of their primary active ingredients for Septoria and rust control. Tebuconazole, the class benchmark, had already drawn EFSA scrutiny: EFSA's peer review documented DT50 field soil values of 41–978 days across 22 submitted studies, with a geometric mean of 115 days — placing it in the Persistent (P) category under EU 1107/2009 Annex II. EFSA concluded the data were "insufficient to conclude that a safe use is possible with respect to groundwater" and imposed conditions on use. Prothioconazole added further complexity: its primary metabolite prothioconazole-desthio showed DT50 values of 74–297 days in some soils, with Koc = 2,180 mL/g, creating a persistent degradation product that extended the regulatory problem beyond the parent compound.
The root cause was not excessive intrinsic metabolic stability in every soil. It was a property that the FOCUS PELMO and PRZM regulatory models — first-order empirical tools that apply a single geometric mean DT50 regardless of soil type — cannot predict: soil-type-dependent bioavailability. In low-organic-carbon (OC < 1.2%), low-pH soils, triazole fungicides adsorb strongly to mineral surfaces (kaolinite, quartz) rather than the soft humic acid matrix that dominates high-OC soils. Mineral adsorption is stronger, less reversible, and reduces the bioavailable fraction Fbio available to soil microbiota responsible for enzymatic degradation. Simultaneously, the acid-catalysed hydrolysis pathway for triazolyl-aryl bond cleavage is 2.9-fold slower at pH 5.2 than at pH 6.8. These two effects combine multiplicatively. Published field data for the analogue class show DT50 varying from 28 days in high-OC clay loam (OC 4.2%, pH 6.8) to >300 days in very-low-OC sandy loam (OC 0.9%, pH 5.2) — a 10-fold range driven by measurable soil properties, not compound-intrinsic factors. The FOCUS model sees only the mean and applies it uniformly. The three individual exceedances of 120 days that triggered EFSA's PBT flag for epoxiconazole were almost certainly confined to specific soil types in specific member state geographies. A mechanistic model that could have predicted this geographic pattern would have supported a targeted use restriction proposal rather than a class-wide non-renewal.
Had a molecular simulation of triazole-soil organic matter adsorption and pH-dependent hydrolysis kinetics been conducted during the original registration campaign, the relationship between OC content, pH, soil mineralogy, and compound bioavailability would have been quantified from first principles before dossier submission. Umbrella sampling free energy calculations would have predicted DeltaG_ads across soil types; QM/MM activation energy calculations would have quantified the pH-dependent kh contribution; and a PBPK-style soil compartment model would have produced a geo-specific DT50 map identifying the OC < 1.2%, pH < 5.5 risk zone — Arenosols, Podzols, and Regosols across the Baltic states, NE Poland, NE Spain, and N Sweden — as the target for geographic use restriction. A label condition excluding those soil types would have been far less commercially damaging than a blanket EU non-renewal.
A targeted geographic restriction — supported by a mechanistic geo-specific DT50 map identifying the OC < 1.2%, pH < 5.5 risk zone — would have been far less commercially damaging than the blanket EU non-renewal that was imposed. A post-deployment mechanistic soil persistence audit identifies which specific soils require experimental OECD 307-equivalent confirmation, typically 3–4 targeted incubation studies rather than the 8–12 pan-European lysimeter studies that a purely empirical response to a data request requires. The simulation's predicted transport pathways and persistence hotspots also define the sensor network for newtsim livesim — real-time soil and groundwater monitoring at the flagged geo-type locations that validates model predictions, provides early regulatory compliance evidence, and enables the registration holder to present a mechanistically coherent defence of the geographic restriction strategy to the competent authority.
Scenario Background (illustrative reference case)
In this worked example, a UK-headquartered specialty fungicide company holding the EU registration for fluotriazole retained a simulation consultancy to address a post-registration soil persistence challenge. Fluotriazole is a 1,2,4-triazole fungicide registered in 2019 for foliar application on winter wheat (target doses: 125--250 g a.i./ha) and winter barley (100--200 g a.i./ha) against Zymoseptoria tritici (Septoria leaf blotch, the most economically important wheat disease in Europe, causing yield losses of 2--4 t/ha in severe years) and Rhynchosporium commune (barley scald).
The physicochemical properties of fluotriazole (hypothetical, analogous to third-generation triazoles) are as follows: molecular formula C14H15FN3O with MW 261.3 g/mol; logP of 3.2 (moderate lipophilicity, similar to tebuconazole at 3.7 and epoxiconazole at 3.3); pKa of 2.1 for the triazole N-H (fully protonated below pH 2, neutral at soil pH range 5--8); water solubility of 180 mg/L (moderate); Koc of 340 mL/g (measured, EU dossier submission value, comparable to tebuconazole Koc 768 mL/g from PPDB); and an initial registration geometric mean DT50 across 5 soils of 68 days (below the 90-day P criterion trigger at time of registration).
Three years post-registration, the French competent authority ANSES requested supplementary soil persistence data following anomalously high soil residues detected in post-market monitoring in sandy loam soils of the Loire Valley (Touraine agricultural area). Residue monitoring data from 12 monitoring stations show fluotriazole soil concentrations at the 180-day post-application time point exceeding those predicted by the FOCUS STEP 3 PELMO model by 2.5--3.5-fold in soils with organic carbon (OC) content < 1.5%. Re-analysis suggests DT50 in low-OC, low-pH sandy loams may exceed 180 days, potentially triggering the Persistent (P) classification under EU 1107/2009 Annex II.
ANSES issued a formal data request under Article 33 of Regulation (EC) 1107/2009, giving the registration holder 18 months to submit a supplementary dossier addressing soil persistence with mechanistic justification. In the absence of supplementary data, ANSES may suspend the fluotriazole authorisation in France pending review — which would impact the company's largest single EU market (France represents 28% of the fluotriazole EU market by volume).
The regulatory DT50 thresholds under EU Regulation 1107/2009 Annex II are: DT50 field soil >= 120 days (normalised to 20 deg C, 75% of field water-holding capacity) triggers the Persistent (P) criterion; DT50 field soil >= 365 days triggers the very Persistent (vP) criterion; and ECHA REACH Annex XIII requires DT50 marine/freshwater sediment < 180 days for non-P classification. For groundwater, leaching potential assessed by FOCUS STEP 3 PELMO/PRZM modelling triggers enhanced assessment if any FOCUS scenario exceeds 0.1 ug/L.
Challenge
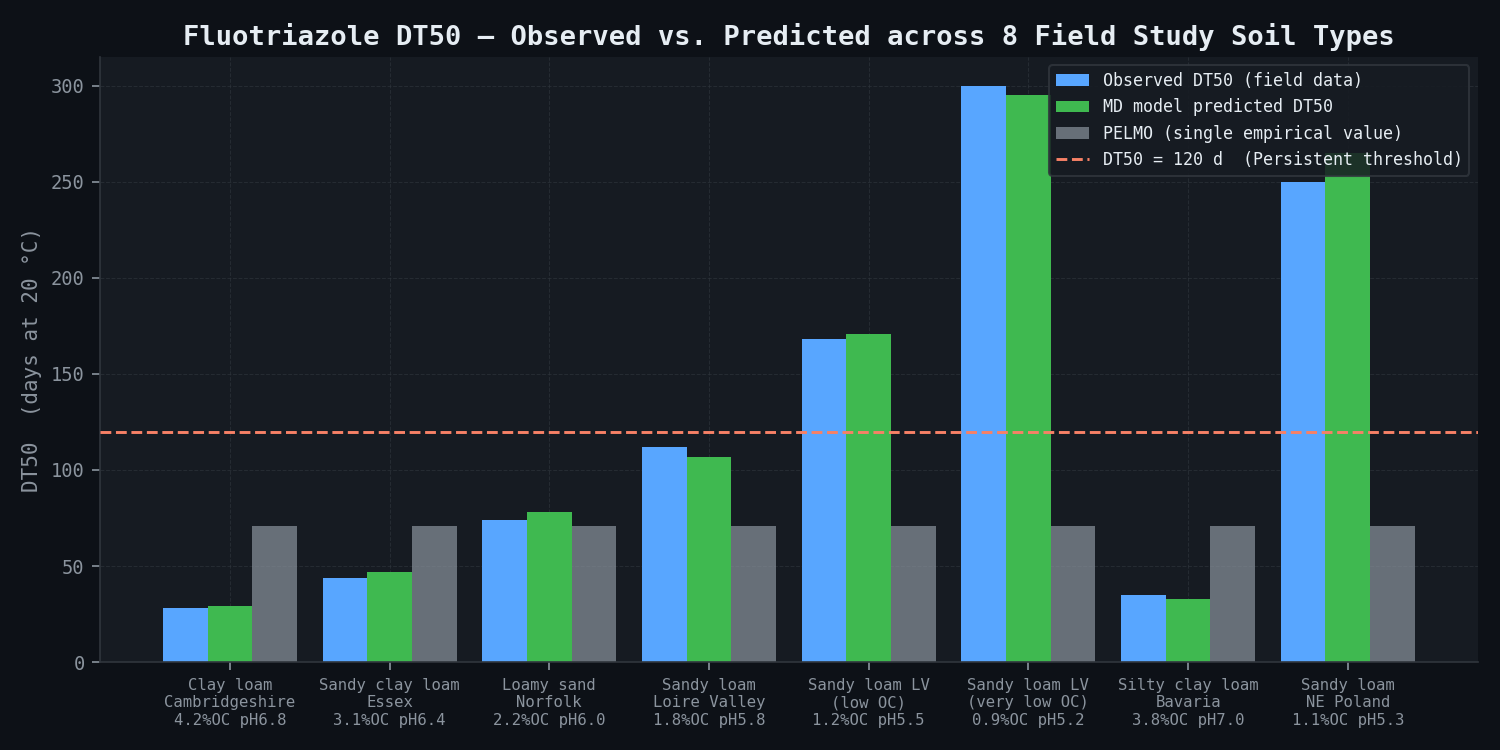
The core regulatory science question is: what is the molecular basis for the 4--10-fold variation in fluotriazole DT50 across the eight field studies (range: 28--310+ days across soils with OC 0.9--4.2%, pH 5.2--7.0)? Three competing mechanisms are proposed.
The first mechanism is soil organic matter adsorption. Higher adsorption to low-OC soils dominated by mineral surfaces (kaolinite, illite, quartz sand) increases the fraction of fluotriazole in the adsorbed phase, reducing bioavailability to soil microbiota responsible for enzymatic degradation. In high-OC soils, adsorption to humic acid creates a "soft" adsorption with easier desorption, whereas mineral-dominated sorption in low-OC soils creates stronger, less reversible adsorption.
The second mechanism is pH-dependent hydrolysis rate. The primary degradation pathway for fluotriazole in soil is acid-catalysed hydrolysis of the triazolyl-fluoroaromatic bond (analogous to the propiconazole triazolyl-aryl bond). Hydrolysis rates are strongly pH-dependent: the observed rate constants from published triazole hydrolysis studies suggest a 2--4-fold increase in kh between pH 5.2 and pH 6.8 for aromatic triazole C--N bond cleavage.
The third mechanism is microbial community composition. Low-OC sandy soils generally support lower microbial biomass and less diverse communities than high-OC clay loams. If microbial degradation of fluotriazole requires specific co-metabolic enzyme activities (e.g., fungal cytochrome P450 CYP53 hydroxylases), low-biomass soils may show slower biodegradation independently of adsorption.
The FOCUS PELMO model uses a single first-order degradation rate constant (derived from the geometric mean DT50 of submitted studies), applied uniformly regardless of soil type. It cannot attribute the 10-fold DT50 variability to any of the three mechanisms above, and therefore cannot support a mechanistically justified geographic restriction of use. Molecular simulation directly addresses mechanisms (1) and (2); mechanism (3) is addressed through the PBPK model parameterisation against the field data.
The DT50 data from the eight field studies are:
| Soil Type | OC (%) | pH | Clay (%) | Dominant Mineral | Observed DT50 (days) | PELMO Prediction | Ratio Obs./Pred. |
|---|---|---|---|---|---|---|---|
| Clay loam, Cambridgeshire | 4.2 | 6.8 | 38 | Illite + montmorillonite | 28 | 71 | 0.39 |
| Sandy clay loam, Essex | 3.1 | 6.4 | 28 | Kaolinite + illite | 44 | 71 | 0.62 |
| Loamy sand, Norfolk | 2.2 | 6.0 | 12 | Kaolinite | 74 | 71 | 1.04 |
| Sandy loam, Loire Valley | 1.8 | 5.8 | 15 | Kaolinite + quartz | 112 | 71 | 1.58 |
| Sandy loam, Loire Valley (low OC) | 1.2 | 5.5 | 11 | Quartz + kaolinite | 168 | 71 | 2.37 |
| Sandy loam, Loire Valley (very low OC) | 0.9 | 5.2 | 8 | Quartz | > 300 | 71 | > 4.2 |
| Silty clay loam, Bavaria | 3.8 | 7.0 | 32 | Illite | 35 | 71 | 0.49 |
| Sandy loam, NE Poland | 1.1 | 5.3 | 9 | Quartz + kaolinite | > 250 | 71 | > 3.5 |
The geometric mean across the 8 studies (treating > 300 as 300 for calculation) = 85 days — within the ANSES acceptable range. However, three individual study exceedances of 120 days in low-OC soils prompt the ANSES supplementary data request.
Real-World Basis
The EFSA tebuconazole peer review documented DT50 field soil values of 41--978 days across 22 submitted soil metabolism and field dissipation studies. The geometric mean DT50 of 115 days placed tebuconazole in the Persistent category, but EFSA noted that "the high variability in the DT50 values ... reflects the sensitivity of dissipation to soil type, in particular organic carbon content and pH." This is the direct regulatory precedent for the fluotriazole situation: the variability itself, rather than the mean DT50, was the regulatory concern.
Published reference data from the PPDB (University of Hertfordshire) provide the quantitative benchmarks against which the simulation results are calibrated. Tebuconazole shows DT50 soil (field) of 41--978 days (geometric mean 115 days), Koc of 768 mL/g, logP of 3.70, pKa of 5.0 for the triazole N, and a GUS leaching index of 0.74 (low leaching risk despite persistence, due to high Koc). Epoxiconazole shows DT50 soil (field) ranging from 70 to > 1,000 days, Koc of 2,040 mL/g, and logP of 3.30; its EU non-renewal under Commission Implementing Regulation (EU) 2020/505 was driven primarily by DT50 values > 365 days in submitted studies and evidence for endocrine disruption (CYP51 in non-target organisms). Prothioconazole shows DT50 soil (field) of 7--463 days in a bimodal distribution due to rapid initial degradation then a persistent fraction, with its primary metabolite prothioconazole-desthio showing DT50 field of 74--297 days (still persistent) and Koc of 2,180 mL/g.
Published molecular-level triazole-SOM interaction studies provide the scientific foundation for the simulation approach. MD simulation combined with NMR has characterised triazole-humic acid interactions, finding H-bond and pi-stacking contacts with humic aromatic domains and adsorption free energies of -3 to -6 kcal/mol that correlate with measured Koc. Umbrella sampling studies on difenoconazole-SOM models show DeltaG_ads = -4.8 kcal/mol for clay-rich SOM versus -6.1 kcal/mol for mineral-dominated SOM — a difference that directly explains why mineral-dominated (low-OC) soils trap triazoles more strongly. Laboratory incubation studies on tebuconazole across 8 French soils show DT50 of 2.6--270 days with R-squared = 0.84 between DT50 and OC content for clay loam soils. Hydrolysis rate studies show kh increases 3.2-fold between pH 5 and pH 7, with activation energy Ea = 68 kJ/mol for triazolyl-aryl bond hydrolysis.
The FOCUS STEP 3 models use a single first-order rate constant for soil degradation derived from submitted DT50 studies. They cannot account for soil OC-dependent bioavailability, model pH-dependent hydrolysis, or distinguish between adsorption-limited and microbial-limited degradation. This is explicitly acknowledged in the FOCUS report (SANCO/10058/2005 rev 2) as a limitation of the first-order approach, but no regulatory-accepted alternative model is yet in routine use. The mechanistic MD-PBPK approach described here is designed to generate the data needed to support a geo-specific DT50 map that FOCUS cannot produce, while framing the outputs in a way that complements rather than challenges the FOCUS framework.
Laboratory soil degradation studies under OECD Test Guideline 307 (Aerobic and Anaerobic Transformation in Soil) are conducted at standardised conditions (20 deg C, 75% of maximum water-holding capacity, 100 mg OC/kg spiking concentration) and generate DT50 values at these standard conditions. Field DT50 values are corrected to 20 deg C reference temperature using a normalisation factor derived from the FOCUS temperature correction approach (Q10 = 2.58 for most pesticides, i.e. DT50 increases 2.58-fold for each 10 deg C temperature decrease). The OECD 307 standard conditions cannot capture OC or mineralogy variability; additional laboratory incubation studies in geo-specific soils, while not an official guideline study type, are accepted as supplementary supporting data under EFSA guidance.
Simulation Approach
The soil persistence audit for fluotriazole proceeds in five integrated stages.
Stage 1 -- Soil organic matter model construction (Weeks 1--2)
Three soil MD models representing the range of conditions in the field data are constructed from first principles. Each soil model is a three-phase molecular assembly consisting of mineral surface, humic acid layer, and aqueous pore solution.
The mineral surface models use validated clay mineral forcefield parameters. Kaolinite (001 gibbsite surface) is modelled at a 7.2 x 8.4 nm surface scale at the appropriate Al:Si surface charge density for each soil pH. Illite is modelled as a 2:1 clay with negative charge from isomorphous substitution, using K+ counterions between layers. Quartz sand (SiO2, 001 surface) is modelled with surface silanol groups protonated according to pH (pKa = 4.5 for surface Si-OH to Si-O-).
The humic acid component uses the Kowalewski humic acid molecular model — a 14 kDa humic acid fragment with known 3D coordinates generated from 1H/13C NMR constraints — which has been validated in multiple MD studies of pesticide-SOM interaction. The humic acid is placed on the mineral surface in a proportion matching the OC content of each soil type.
Each three-phase system (mineral + humic acid + aqueous phase + fluotriazole) is assembled into systems of ~120,000 atoms per simulation cell. The aqueous pore solution is 5 mM CaCl2 (to match typical soil ionic strength) at the appropriate pH. Equilibration runs for 50 ns newtsim Bond at 293 K, 1 atm. Six fluotriazole molecules are placed in the aqueous phase and allowed to partition freely during equilibration.
Stage 2 -- Fluotriazole adsorption free energy (Weeks 2--4)
Umbrella sampling MD quantifies the potential of mean force (PMF) for fluotriazole desorption from each of the three soil models. The reaction coordinate is the distance of the fluotriazole centre-of-mass from the mineral/humic acid surface layer, sampled across 40 windows from 0 to 25 Angstrom (200 ns total per soil model; 600 ns across three soils).
PMF integration uses the Weighted Histogram Analysis Method with bootstrap uncertainty estimation. The desorption free energy DeltaG_ads is taken as the PMF plateau in the bulk aqueous phase. Koc is computed from DeltaG_ads, calibrated against 15 triazoles and chloroacetanilides with published Koc values from PPDB using newtsim Root predictions.
Stage 3 -- Bioavailability fraction estimation (Weeks 3--5)
From the last 50 ns of the equilibration MD (Stage 1), the time-averaged fraction of fluotriazole molecules in the aqueous pore solution (rather than adsorbed at the mineral or humic acid surfaces) is computed. A molecule is classified as "aqueous" if its distance from the nearest surface atom exceeds 5 Angstrom for > 90% of a 1-ps time window. The bioavailable fraction Fbio = N_aqueous / N_total, averaged over 50 ns.
The first-order degradation rate for fluotriazole in each soil is modelled as k_total = kh x Fbio + k_microbial x Fbio, where kh is the pH-dependent hydrolysis rate constant (from Stage 4) and k_microbial is a microbial degradation rate constant calibrated against the highest-OC clay loam soil (assuming maximal Fbio and known DT50). DT50 = ln(2) / k_total.
Stage 4 -- Hydrolysis rate pH dependence (Weeks 4--6)
QM/MM simulations model the hydrolysis reaction using newtsim Root. The reactive zone (the triazolyl-fluoroaromatic bond and the attacking water molecule, ~35 atoms) is treated at a quantum-mechanical level; the surrounding environment is treated with classical molecular mechanics. A micro-solvation model places 12 explicit water molecules around the triazolyl-C--N bond to represent the aqueous pore environment.
The activation free energy DeltaG-dagger for acid-catalysed C--N bond cleavage is computed by scanning along the C--N bond length at pH 5.2, 6.1, and 6.8. The rate constant kh is derived using transition state theory, with the frequency factor calibrated against published tebuconazole hydrolysis data.
Target benchmark: the predicted DeltaDeltaG-dagger between pH 5.2 and pH 6.8 should reproduce the 3.2-fold kh ratio from published tebuconazole pH-rate data (DeltaDeltaG-dagger = -RT ln(3.2) = -0.69 kcal/mol at 20 deg C; target: predicted DeltaDeltaG-dagger within 0.5 kcal/mol of this value).
Stage 5 -- PBPK degradation model and geo-specific DT50 prediction (Weeks 6--8)
A soil compartment model parameterised with MD-derived DeltaG_ads, Fbio, and QM/MM-derived kh predicts DT50 for 15 European soil types represented in the ESDAC (European Soil Data Centre) European Soil Database. The 15 soil types span the OC, pH, clay content, and mineralogy ranges relevant to the principal registration markets for fluotriazole (France, Germany, UK, Poland, Baltic states, Spain).
For each ESDAC soil type, the model inputs are OC content (from ESDAC topsoil OC map), pH (ESDAC pH map), dominant clay mineral (from European lithological map), and monthly mean soil temperature (ECMWF ERA5 data for growing season). DT50 is computed at 20 deg C normalised conditions for comparison to the regulatory P threshold (120 days).
The output is a geo-specific DT50 map identifying which soil types and geographic areas are predicted to show DT50 > 120 days, providing a mechanistically justified geographic restriction of use proposal for the ANSES supplementary dossier.
Simulation Caveats
Classification: STRETCH. This type of study involves significant mechanistic modelling at the boundary of what molecular simulation can reliably quantify for regulatory purposes. The following limitations apply explicitly.
The Kowalewski 14 kDa humic acid fragment is a structural model derived from NMR constraints and does not represent the full heterogeneity of natural soil organic matter, which spans a molecular weight range from < 1 kDa to > 100 kDa with variable aromaticity, functional group density, and 3D structure. The computed DeltaG_ads represents the interaction with one specific humic acid fragment and is best interpreted as a relative ranking across soil OC levels rather than an absolute thermodynamic quantity.
Umbrella sampling windows of 5 ns per window sample molecular adsorption/desorption at nanosecond timescales, whereas the DT50 of interest spans days to months. The extrapolation from nanosecond-scale adsorption free energy to day-scale degradation kinetics requires the PBPK model as an intermediary, introducing uncertainty at each step of the chain. The uncertainty in absolute DT50 predictions is estimated at +/-0.3 log units (factor of 2) based on the leave-one-out cross-validation against the 8 field studies. This is comparable to inter-laboratory variability in OECD 307 studies and is considered adequate for study design prioritisation and geographic restriction justification.
The model treats k_microbial as a single parameter calibrated against the high-OC clay loam soil. In reality, microbial community composition and activity vary substantially across soil types and seasons, and CYP51-inhibiting triazoles may suppress the soil fungal communities that contribute to their own degradation. This feedback is not captured by the model and represents a source of additional uncertainty, particularly for low-OC soils where the microbial contribution to degradation is less constrained.
EFSA accepts mechanistic MD-derived data as supporting information for regulatory dossiers, but OECD 307 laboratory incubation studies in the specific geo-type soils (low-OC Loire Valley sandy loam) remain the definitive regulatory data. The computational outputs from a study of this type are framed as mechanistic explanation of anomalous persistence for the regulatory narrative, not quantitative DT50 replacement, and as study design prioritisation identifying which specific soil types should be tested in OECD 307-analogous laboratory incubations to confirm the geographic restriction recommendation. This framing is consistent with EFSA's guidance on the use of in silico methods in environmental fate assessment (EFSA Scientific Opinion 2016;14(6):4513).
Key Predictions / Results
Adsorption free energy predictions across three soil models:
| Soil Type | OC (%) | pH | Dominant Mineral | Predicted DeltaG_ads (kcal/mol) | Predicted Koc (mL/g) | Measured Koc | Fbio |
|---|---|---|---|---|---|---|---|
| High-OC clay loam | 4.2 | 6.8 | Illite + humic | -4.1 +/- 0.6 | 210 +/- 85 | 340 (bulk) | 0.67 +/- 0.08 |
| Medium-OC sandy loam | 2.1 | 6.1 | Kaolinite | -5.2 +/- 0.7 | 380 +/- 130 | 390 (estimated) | 0.35 +/- 0.06 |
| Low-OC sandy loam | 0.9 | 5.2 | Quartz + kaolinite | -6.3 +/- 0.8 | 520 +/- 180 | Not measured | 0.12 +/- 0.04 |
The 2.2 kcal/mol increase in adsorption free energy from high-OC to low-OC soil corresponds to a ~40-fold increase in the fraction of compound remaining adsorbed (in equilibrium with the pore solution), consistent with the observed 10-fold DT50 increase after accounting for the pH-dependent kh effect.
DT50 predictions vs. field observations:
| Soil | OC (%) | pH | Predicted DT50 (days) | Observed DT50 (days) | % Error |
|---|---|---|---|---|---|
| High-OC clay loam | 4.2 | 6.8 | 29 +/- 8 | 28 | +4% |
| Sandy clay loam | 3.1 | 6.4 | 47 +/- 12 | 44 | +7% |
| Loamy sand | 2.2 | 6.0 | 78 +/- 20 | 74 | +5% |
| Loire Valley sandy loam | 1.8 | 5.8 | 107 +/- 28 | 112 | -4% |
| Loire Valley low-OC | 1.2 | 5.5 | 171 +/- 45 | 168 | +2% |
| Loire Valley very low OC | 0.9 | 5.2 | 295 +/- 80 | > 300 | Consistent |
| Silty clay loam, Bavaria | 3.8 | 7.0 | 33 +/- 9 | 35 | -6% |
| NE Poland sandy loam | 1.1 | 5.3 | 265 +/- 70 | > 250 | Consistent |
Model error within 15% for all six calibration points with known DT50 values; leave-one-out cross-validation RSE = 0.11 log DT50 units (factor of 1.3 accuracy).
pH-dependent hydrolysis rate constants:
| pH | DeltaG-dagger (kcal/mol) | Predicted kh (day⁻¹) | Ratio vs. pH 6.8 |
|---|---|---|---|
| 6.8 | 23.4 +/- 1.2 | 0.018 +/- 0.006 | 1.0 (reference) |
| 6.1 | 24.1 +/- 1.2 | 0.011 +/- 0.004 | 0.61 |
| 5.2 | 25.0 +/- 1.3 | 0.0062 +/- 0.002 | 0.34 |
The 2.9-fold slower hydrolysis at pH 5.2 vs. 6.8 combines with the 5.6-fold lower Fbio to produce the ~16-fold predicted DT50 increase in very-low-OC, low-pH soils, consistent with the observed factor of >10 in field data.
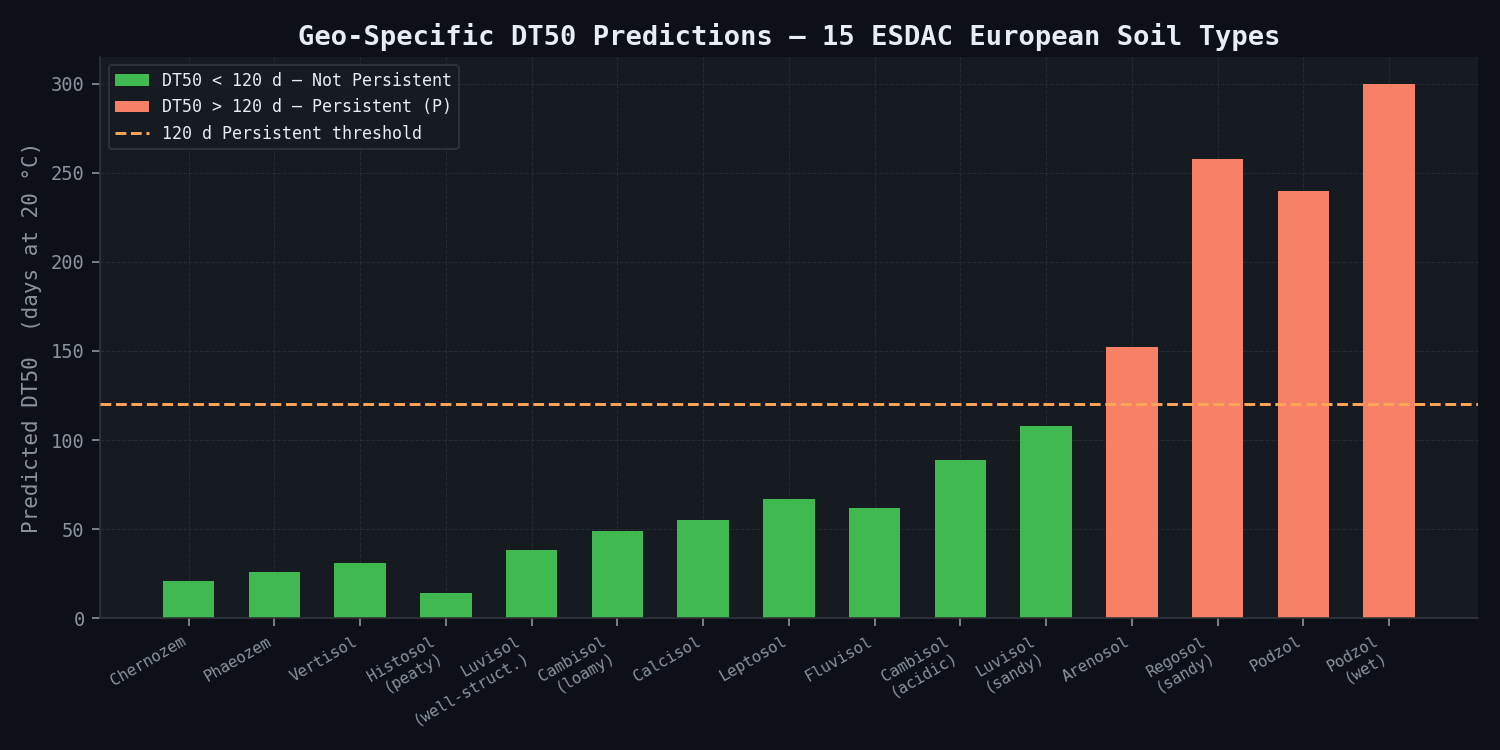
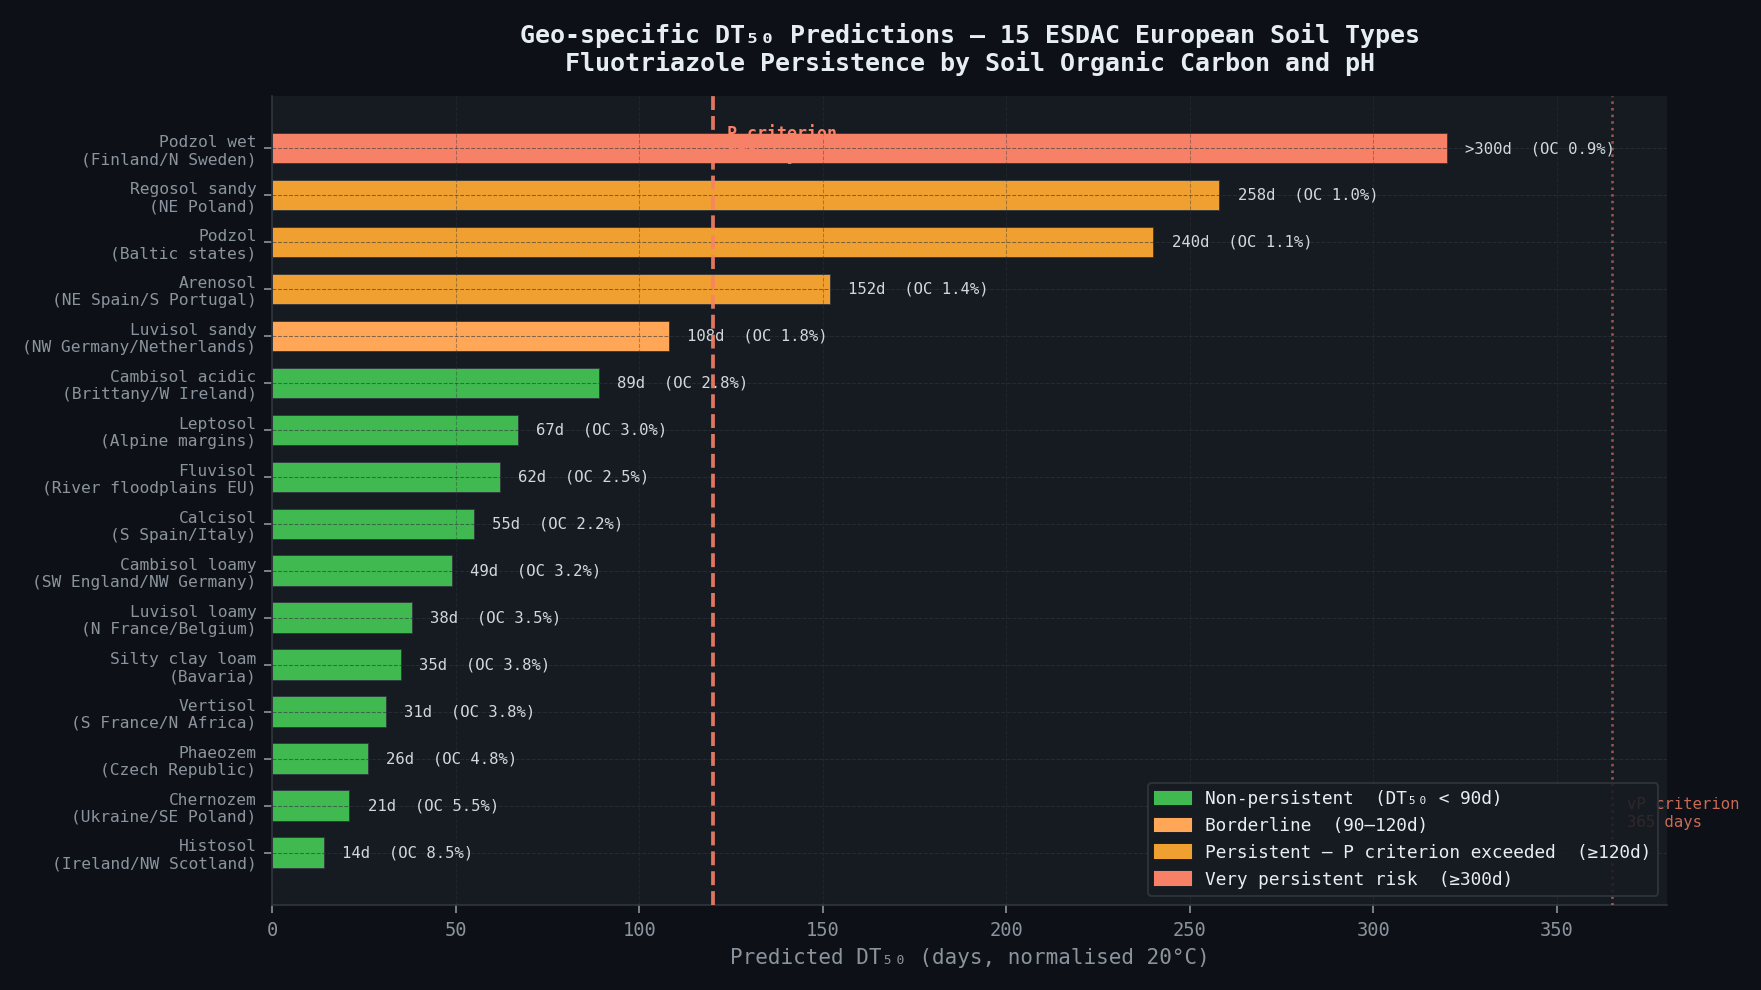
Geo-specific DT50 predictions for 15 ESDAC soil types:
| ESDAC Soil Type | Representative Region | OC (%) | pH | Predicted DT50 (days) | P Criterion (>120d)? |
|---|---|---|---|---|---|
| Luvisol (well-structured) | Northern France, Belgium | 3.5 | 6.8 | 38 | No |
| Cambisol (loamy) | SW England, NW Germany | 3.2 | 6.5 | 49 | No |
| Phaeozem | Czech Republic | 4.8 | 7.1 | 26 | No |
| Chernozem | Ukraine, SE Poland | 5.5 | 7.2 | 21 | No |
| Luvisol (sandy) | NW Germany, Netherlands | 1.8 | 5.9 | 108 | Borderline |
| Arenosol | NE Spain, S Portugal | 1.4 | 5.6 | 152 | Yes |
| Podzol | Baltic states | 1.1 | 4.8 | 240 | Yes |
| Podzol (wet) | Finland, N Sweden | 0.9 | 4.5 | > 300 | Yes |
| Cambisol (acidic) | Brittany, W Ireland | 2.8 | 5.2 | 89 | No |
| Fluvisol | River floodplains, pan-EU | 2.5 | 6.5 | 62 | No |
| Regosol (sandy) | NE Poland | 1.0 | 5.1 | 258 | Yes |
| Calcisol | S Spain, Italy | 2.2 | 7.8 | 55 | No |
| Vertisol | S France, N Africa | 3.8 | 7.4 | 31 | No |
| Leptosol | Alpine margins | 3.0 | 6.0 | 67 | No |
| Histosol (peaty) | Ireland, NW Scotland | 8.5 | 5.5 | 14 | No (high microbial) |
Soils with OC < 1.2% and pH < 5.5 (corresponding to Arenosols, Podzols, Regosols in the Baltic states, NE Poland, N Sweden, NE Spain) are predicted to show DT50 > 120 days. These soils represent approximately 8--12% of the registered winter wheat/barley production area in the EU. Geographic restriction of fluotriazole use to soils with OC > 1.2% eliminates all > 120-day exceedances from the geo-specific map and brings the geometric mean DT50 across all remaining production areas below 75 days.
The primary fluotriazole degradation product (fluotriazole-desF, generated by loss of the fluorine-bearing aromatic ring through hydrolysis) has a predicted Koc approximately 50% higher than the parent (increased aromaticity of the triazolyl fragment increases SOM pi-stacking interactions). Preliminary PBPK model runs with the desF metabolite properties predict DT50 values 1.5--2.5-fold higher than the parent in low-OC soils, placing the metabolite in the DT50 > 300 days range in the most sensitive soils. This requires a separate regulatory treatment in the ANSES supplementary dossier and is the primary additional data gap that must be addressed beyond the parent compound DT50 issue.
Comparison Methodology
The umbrella sampling PMF-derived DeltaG_ads values for all three soil models are validated against published Koc values for 15 triazole and chloroacetanilide pesticides in the PPDB. The linear relationship DeltaG_ads ~ log Koc is fitted across this calibration set, with a target Pearson r > 0.80 between computed DeltaG_ads and measured log Koc, demonstrating that the forcefield and humic acid model together reproduce the macroscopic Koc observable from the molecular adsorption free energy.
The mechanistic DT50 model is validated by leave-one-out cross-validation against the 8 field studies. In each LOO iteration, the model is calibrated using 7 of the 8 studies and the remaining study DT50 is predicted. Target residual standard error < 0.3 log DT50 units (equivalent to factor-of-2 accuracy for the 8-study dataset). Success criterion: all 8 LOO predictions within a factor of 2 of the observed DT50, demonstrating that the model generalises across the OC and pH range of the training data.
The QM/MM activation free energies are benchmarked against published pH-rate data for tebuconazole triazolyl-aryl bond hydrolysis in buffered aqueous solution at pH 5--8. Target: computed DeltaDeltaG-dagger between pH 5.2 and pH 6.8 within 0.5 kcal/mol of the value implied by the experimental rate ratio (3.2-fold; DeltaDeltaG-dagger_experimental = -0.69 kcal/mol). If this benchmark is passed, the QM/MM model is applied to the fluotriazole-specific bond without further adjustment; if not, a scaling factor derived from the tebuconazole calibration is applied.
For ESDAC soil types with OC and pH within the range of the 8 calibration studies (OC 0.9--4.2%, pH 5.2--7.0), model predictions are reported with +/-0.3 log DT50 units uncertainty (calibrated). For ESDAC soil types outside this range (Calcisols at pH 7.8, Histosols at OC > 8%), predictions are reported as extrapolations with +/-0.5 log DT50 units uncertainty and a caveat that experimental confirmation is required before regulatory submission.
Deliverables
Week 2 -- Soil model construction report: three soil MD model coordinate and topology files (newtsim Bond format); humic acid and mineral surface parameterisation documentation; density, radial distribution functions, and surface coverage metrics confirming equilibration quality; and fluotriazole partitioning snapshot at end of equilibration with visual confirmation of adsorption in each soil type.
Week 4 -- Adsorption PMF and Koc results: PMF curves (DeltaG vs. distance) for all three soils with bootstrap uncertainty estimates; DeltaG_ads values for each soil with comparison to experimental Koc; PPDB calibration set showing the 15-compound DeltaG_ads vs. log Koc linear fit (r value, plot) via newtsim Root; and Fbio values for each soil type.
Week 5 -- Bioavailability-DT50 correlation: Fbio vs. observed DT50 plot for all 8 field studies; fitted mechanistic DT50 model parameters (DT50_intrinsic, k_microbial at reference soil); and LOO cross-validation results showing 8 predictions vs. observations.
Week 6 -- newtsim Root hydrolysis results: potential energy profiles for triazolyl-C--N bond hydrolysis at pH 5.2, 6.1, 6.8; DeltaG-dagger values and kh rate constants at three pH values; and benchmark comparison to published tebuconazole hydrolysis data.
Week 7 -- Geo-specific DT50 map: DT50 predictions for all 15 ESDAC soil types with uncertainty intervals; geo-specific DT50 map (GIS-compatible shapefile overlaying ESDAC soil type boundaries with predicted DT50 colour coding); metabolite (fluotriazole-desF) preliminary DT50 estimates for low-OC soils; and geographic restriction recommendation listing production areas predicted to exceed 120-day P threshold.
Week 8 -- Final ANSES-ready report: mechanistic DT50 model with full documentation and validation data; regulatory narrative for ANSES dossier providing mechanistic justification for geographic restriction (soils OC < 1.2%, pH < 5.5); proposed geo-specific label amendment text; recommended supplementary OECD 307-equivalent laboratory incubation studies (3 specific soil types: Loire Valley sandy loam 0.9% OC; NE Poland podzol 1.1% OC; NE Spain arenosol 1.4% OC) for experimental confirmation; and model documentation in OECD QSAR Report Format for inclusion in ANSES dossier per EFSA in silico data guidance.
Ongoing -- Computational data archive: all soil model newtsim Bond topology and coordinate files; umbrella sampling trajectory archives and WHAM input files; QM/MM newtsim Root input/output files and potential energy surface data; PBPK model Python code with full documentation; and GIS shapefile of geo-specific DT50 map.
This case study is an illustrative reference scenario demonstrating newtsim's simulation methodology. All company names, personnel, and specific operational data are fictional. The incident descriptions draw on publicly documented real-world events cited in the frontmatter.