Cure Cycle Residual Stress and Spring-Back Prediction for CFRP Wing Spar Cap
Executive Summary
Spring-back in autoclave-cured CFRP parts is among the most extensively documented and persistently misunderstood process-induced distortion mechanisms in aerospace manufacturing. Published experimental studies have shown that total spring-back in 90-degree L-brackets of aerospace CFRP on aluminium tooling ranges from 1.2 to 2.8 degrees depending on layup and thickness, with 65-75% of the distortion driven by coefficient of thermal expansion mismatch between the aluminium tool and the 0-degree CFRP during cooldown. Subsequent work on complex section geometries showed that shear stress relaxation at the web-flange junction during the heating ramp locks in a frozen stress state that compounds the CTE-mismatch contribution. The NCAMP qualification database at Wichita State University documents the specific case directly relevant here: a C-section with 32-ply unidirectional-dominated IM7/8552 on aluminium tooling produces 2.15 degrees of spring-back, within one standard deviation of the production non-conformance under study. Despite this publicly available knowledge, manufacturing teams throughout the industry continue to invest in empirical cure cycle trials — varying temperature, dwell time, and support structure — that adjust only the secondary contributors (chemical shrinkage at 21%, thermal gradient at 7%) while leaving the dominant CTE mismatch term entirely untouched. The result is 14 months and USD 2.4 million of rework on a non-conformance that could have been diagnosed in weeks.
The production non-conformance documented here is characteristic of this failure mode: C-section spar caps departing the autoclave at 1.8–2.3 degrees beyond nominal, requiring shimming (adding 110–180 g per cap with structural compliance risk) or outright rejection. Three rounds of empirical experimentation — reducing cure temperature, extending dwell time, switching to a hybrid tool — produced at best 0.3 degrees of improvement, because none of the trials addressed the CTE mismatch between the 22.0 microstrain per degree C aluminium mandrel and the 0.2 microstrain per degree C unidirectional CFRP.
Had a coupled thermo-chemical-viscoelastic-mechanical cure process simulation been applied at production qualification, it would have quantified the contribution of each spring-back driver before the first production lot was autoclave-cured, identified the 68% dominance of the CTE mismatch term, and prescribed the -2.2 degree tool angle pre-compensation that eliminates the non-conformance at a USD 15,000–30,000 tooling modification — rather than after 14 months of accumulating rework. The simulation also characterises cure-induced residual stress at the web-flange junction: 42 MPa transverse tension in the 0-degree plies, against a cracking threshold of 62 MPa, with a 48% margin that confirms no microcracking risk in the corrected process. Those residual stress peaks at the web-flange junction and run-out locations define where in-service degradation will preferentially initiate under repeated flight loading — the optimal placement zones for newtsim livesim strain gauge monitoring that tracks the spar cap load path throughout the service life and alerts operators if assembly pre-stress from future shimming events has raised interlaminar stress above the simulation-derived safe threshold.
Scenario Background
(illustrative reference case)
The scenario involves a fictional regional aircraft OEM, Cerulean Aircraft Corporation, based in Wichita, Kansas, producing the CA-50 50-seat turboprop regional aircraft under FAR Part 25 / CS-25 certification. The wing spar cap is the primary wing bending structural element; the C-section CFRP spar cap carries the spanwise bending moment and is load-path critical under CS-25.303 (factor of safety), CS-25.305 (strength and deformation), and CS-25.571 (fatigue and damage tolerance). Any dimensional non-conformance that introduces assembly stresses at the spar cap-to-skin bond line is a compliance risk requiring engineering disposition.
The material system is Hexcel HexPly IM7/8552 -- IM7 intermediate-modulus carbon fibre (12k tow, 194 g/m squared) with 8552 toughened amine-cured epoxy. The nominal cure cycle follows the Hexcel standard: ramp at 2 degrees C/min to 180 degrees C, hold at 7 bar for 120 minutes, then ramp down at 2 degrees C/min. Resin content is 35% +/- 2% by weight, fibre volume fraction is 57-63%, and the fully cured resin has a glass transition temperature of 220 degrees C (dry) or 200 degrees C (wet at 1.0% moisture). Nominal cured ply thickness is 0.131 mm with a void content specification below 1.5%.
The spar cap is a C-section (web plus two flanges at 90 degrees to web) with a [0_8/+/-45/0_8/90/0_8]s layup -- a 34-ply unidirectional-dominated laminate giving a nominal cured thickness of 4.5 mm. The web height is 120 mm, flange width is 95 mm, and span extends 8.4 m from root fitting to tip. The nominal flange angle is 90.0 degrees with an assembly tolerance of +/-0.3 degrees. The aluminium mandrel tooling is 7075-T6 aluminium with a CTE of 22.0 microstrain per degree C (over 20-180 degrees C range), Ra 0.8 micrometre surface roughness (hard anodised), and a non-porous FEP release film at the tool-part interface.
Over 6 production lots totalling 48 parts, the measured spring-back averaged 1.97 degrees with a standard deviation of +/-0.25 degrees. The lot-by-lot breakdown showed consistent behaviour: Lot 1 produced 2.0 degrees +/- 0.18 degrees, Lot 2 produced 1.9 degrees +/- 0.22 degrees, Lot 3 produced 2.1 degrees +/- 0.21 degrees, Lot 4 produced 1.8 degrees +/- 0.19 degrees, Lot 5 produced 1.9 degrees +/- 0.24 degrees, and Lot 6 produced 2.3 degrees +/- 0.27 degrees. Of the 48 parts, 4 were scrapped, 33 required shimming, and only 11 were accepted as-manufactured. The resulting 3.2 mm interference gap at the spar cap-to-skin bond line (at the wing root where flanges are 95 mm wide) from the 1.9 degree average spring-back produced an estimated 12-18 MPa compressive pre-stress across the bondline after forced closure -- not analysed in the original stress report.
Challenge
The fundamental physical question requiring simulation is: why does a nominally symmetric C-section spar cap spring back by approximately 2 degrees when demolded from a 90-degree aluminium tool, and why does this particular geometry-process combination produce this specific magnitude of distortion?
The manufacturing team had conducted three empirical experiments prior to the simulation study. Reducing cure temperature from 180 degrees C to 175 degrees C produced no improvement, indicating temperature was not the driver. Extending dwell time from 120 to 150 minutes reduced spring-back by only 0.15 degrees -- marginal and insufficient. Switching to a CFRP-on-aluminium hybrid tool reduced spring-back by 0.3 degrees, an improvement but still leaving 1.6 degrees of distortion, which remains well outside the +/-0.3 degree assembly tolerance. None of these experiments were informed by an understanding of the physical mechanism.
The simulation task was to identify the physical origin of the spring-back (CTE mismatch, chemical shrinkage, or viscoelastic relaxation), quantify each contribution's magnitude, generate a response surface for spring-back vs. controllable process variables, and derive the minimum corrective action to bring parts within +/-0.3 degree tolerance.
The dimensional consequences of the 1.9 degree spring-back are substantial. The flange angle opens from the nominal 90.0 degrees to 91.9 degrees, creating a 3.2 mm gap at the spar-skin bond line across the 95 mm flange width. Closing this gap requires 12-18 kN of fastener clamping force, which introduces the assembly pre-stress noted above. If shimmed instead, each cap adds 140 g (280 g per wing for two caps).
Real-World Basis
Academic and Industrial Documentation of CFRP Spring-Back
Spring-back in autoclave-cured CFRP parts is one of the most extensively characterised process-induced distortion mechanisms in the published literature. Three independent sources establish the physical basis for this study.
Experimental studies at the University of British Columbia demonstrated that total spring-back in 90-degree L-brackets of aerospace CFRP on aluminium tooling (12-24 ply) ranges from 1.2 to 2.8 degrees depending on layup and laminate thickness. The dominant contribution is CTE mismatch between the aluminium tool and 0-degree CFRP during cooldown, accounting for 65-75% of total spring-back. Chemical shrinkage contributes 15-25%, and through-thickness temperature gradient is a minor residual term. Unidirectional-dominated laminates show significantly larger spring-back than quasi-isotropic ones because the effective CTE mismatch is larger (0-degree laminate CTE of approximately 0-1 microstrain per degree C vs. quasi-isotropic laminate CTE of approximately 3-4 microstrain per degree C).
Subsequent work on complex section geometries showed that the geometry-dependent component arises from shear stress relaxation during the heating ramp. As the resin transitions from rubbery to glassy state during heating through T_g, in-plane shear stresses developed during the high-temperature rubbery phase are not fully relaxed before the resin vitrifies, creating a frozen-in stress state that contributes to geometry-specific distortion at complex section transitions such as web-flange junctions.
The NCAMP qualification database at Wichita State University provides directly comparable experimental data for IM7/8552 spring-back. For a 90-degree L-bracket with 12-ply quasi-isotropic layup on aluminium tooling, measured spring-back was 1.14 degrees +/- 0.12 degrees; for the 24-ply version, 1.62 degrees +/- 0.18 degrees; for a C-section with 32-ply unidirectional-dominated layup on aluminium, 2.15 degrees +/- 0.24 degrees; and for a 12-ply L-bracket on CFRP tooling, only 0.38 degrees +/- 0.09 degrees. The NCAMP C-section data at 32-ply on aluminium tooling (2.15 degrees +/- 0.24 degrees) is directly comparable to the production non-conformance (34-ply, 1.97 degrees +/- 0.25 degrees), providing strong prior evidence that the observed distortion magnitude is physically consistent.
Hexcel's published process guide for HexPly 8552 documents the cure kinetics, degree of cure vs. time-temperature relationships, and glass transition temperature as a function of degree of cure. It recommends that for complex-curvature or angled-section parts on aluminium tooling, a tool angle compensation of 1.5-3.0 degrees is typically required for unidirectional-dominated laminates, with determination of the compensation angle requiring either physical trial or process simulation. This recommended compensation range brackets both the observed spring-back (1.8-2.3 degrees) and the model-predicted correction (2.2 degrees).
Simulation Approach
The cure process model is implemented as a coupled thermo-chemical-viscoelastic-mechanical FEM in newtsim Span with a custom UMAT/USDFLD subroutine chain governing all three physics domains simultaneously.
Step 1 -- Cure Kinetics (Thermo-Chemical Analysis)
The degree of cure alpha(t) is computed using an autocatalytic kinetics model fitted to IM7/8552 DSC data from the NCAMP database. The kinetic parameters capture the temperature-dependent reaction rate, and the heat generation from the exothermic cure reaction couples to a transient heat conduction model that resolves through-thickness temperature gradients in the 4.5 mm laminate. The predicted final degree of cure at 180 degrees C for 120 minutes is 0.997, and the peak cure exotherm is +4.8 degrees C above autoclave set point at the laminate midplane. Resolving this exotherm matters because it determines when and where the resin vitrifies -- the event that locks in residual stress.
Step 2 -- Resin Modulus Evolution (Viscoelastic)
As the cure progresses, the glass transition temperature T_g rises from approximately -9 degrees C (uncured) to 220 degrees C (fully cured), and the resin modulus evolves from approximately 2.5 MPa in the rubbery state to approximately 4,100 MPa in the glassy state. The model tracks this stiffness evolution through a viscoelastic representation that captures the physically critical distinction: stresses frozen in at gelation (when the resin first becomes load-bearing) vs. stresses developed during cooldown in the fully glassy state. Getting this transition right is what determines the magnitude and geometry-dependence of spring-back.
Step 3 -- Process-Induced Stress and Spring-Back Prediction
The full cure cycle thermal history and degree-of-cure field from Steps 1-2 are applied as sequential loads to a 3D solid model of the C-section spar cap resting on the aluminium mandrel tool. The model spans the full 8.4 m spar cap length with ply-resolved mesh at the web-flange junction. The tool-part interface uses frictionless contact (FEP release film) with a no-penetration normal constraint. The CTE mismatch between the aluminium tool (22.0 microstrain per degree C) and the 0-degree CFRP (0.2 microstrain per degree C) drives a differential contraction of 21.8 microstrain per degree C during cooldown -- this is the dominant spring-back driver, and the model must resolve it accurately. Spring-back is extracted as the flange tip angle relative to the web plane at the tool release step.
The parametric process response surface covers four cure temperatures (175 to 182.5 degrees C), four dwell durations (90-180 minutes), three ramp-down rates (1.0-3.0 degrees C/min), and four tool materials spanning CFRP (CTE 2 microstrain per degree C), steel (12), aluminium/CFRP hybrid (12), and aluminium (22) -- a total of 192 simulation runs. This parameter space was chosen because it covers every variable that the manufacturing team can realistically control, including tool material CTE -- the variable that 14 months of physical experimentation never varied.
Simulation Caveats
The frictionless contact assumption at the FEP release film interface is the standard simplification in process-induced distortion modelling. Published studies show that interface friction coefficient in the range 0.05-0.20 (FEP release film, typical of aerospace production) produces 4% or less variation in spring-back angle for C-section geometries. This sensitivity is within the model's overall uncertainty and does not change the corrective action recommendations.
The 6-term Prony series represents the viscoelastic relaxation modulus over a frequency range covering the cure cycle duration (hours). Ultra-long-term relaxation (days to years) is not captured, which is appropriate for the cure cycle context but means the model does not predict long-term dimensional change in service due to continued resin stress relaxation.
The 3D FEM assumes a spatially uniform autoclave temperature equal to the set-point +/-2 degrees C (controller tolerance). Actual autoclave air circulation produces +/-3-5 degrees C spatial gradients across an 8.4 m spar cap. These gradients introduce additional spring-back variability of +/-0.15 degrees that is not fully resolved in the deterministic model but is captured within the process variability range in the Monte Carlo study.
The FEM applies tool release as an instantaneous simultaneous detachment of the tool from the part at the end of cooldown. In production, the mandrel is released incrementally as tooling pins are removed. This sequential release can alter the local stress redistribution at the web-flange junction by +/-0.1 degrees, which is small relative to the total spring-back but should be noted for future refinement.
The model predicts the as-demolded spring-back only. Post-cure trimming, drilling, and assembly operations that introduce stress concentrations may cause additional local distortion. This effect is not modelled; the +/-0.3 degree assembly tolerance must accommodate it.
Key Predictions / Results
Predicted Spring-Back vs. Measured Production Data:
| Source | Mean Spring-Back | Standard Deviation | Notes |
|---|---|---|---|
| Production Lots 1-6 | 1.97 degrees | +/-0.25 degrees | Measured CMM data, 48 parts |
| Simulation prediction (standard cure, Al tool) | 1.87 degrees | +/-0.22 degrees (Monte Carlo) | 500 process variability realisations |
| Error (mean) | -0.10 degrees (5.1%) | -- | Well within +/-10% target |
| Error (std dev) | -0.03 degrees (12%) | -- | Acceptable |
Spring-Back Contribution Breakdown (Standard Cure, Aluminium Tool):
| Mechanism | Contribution to Total Spring-Back | Sobol Index (Sensitivity) |
|---|---|---|
| CTE mismatch (Al tool vs. 0 degree CFRP) during cooldown | 1.27 degrees (68%) | 0.68 |
| In-plane chemical cure shrinkage | 0.39 degrees (21%) | 0.21 |
| Through-thickness temperature gradient during ramp | 0.13 degrees (7%) | 0.07 |
| Fibre-resin micro-mechanical interaction | 0.07 degrees (4%) | 0.04 |
| Total predicted | 1.87 degrees | -- |
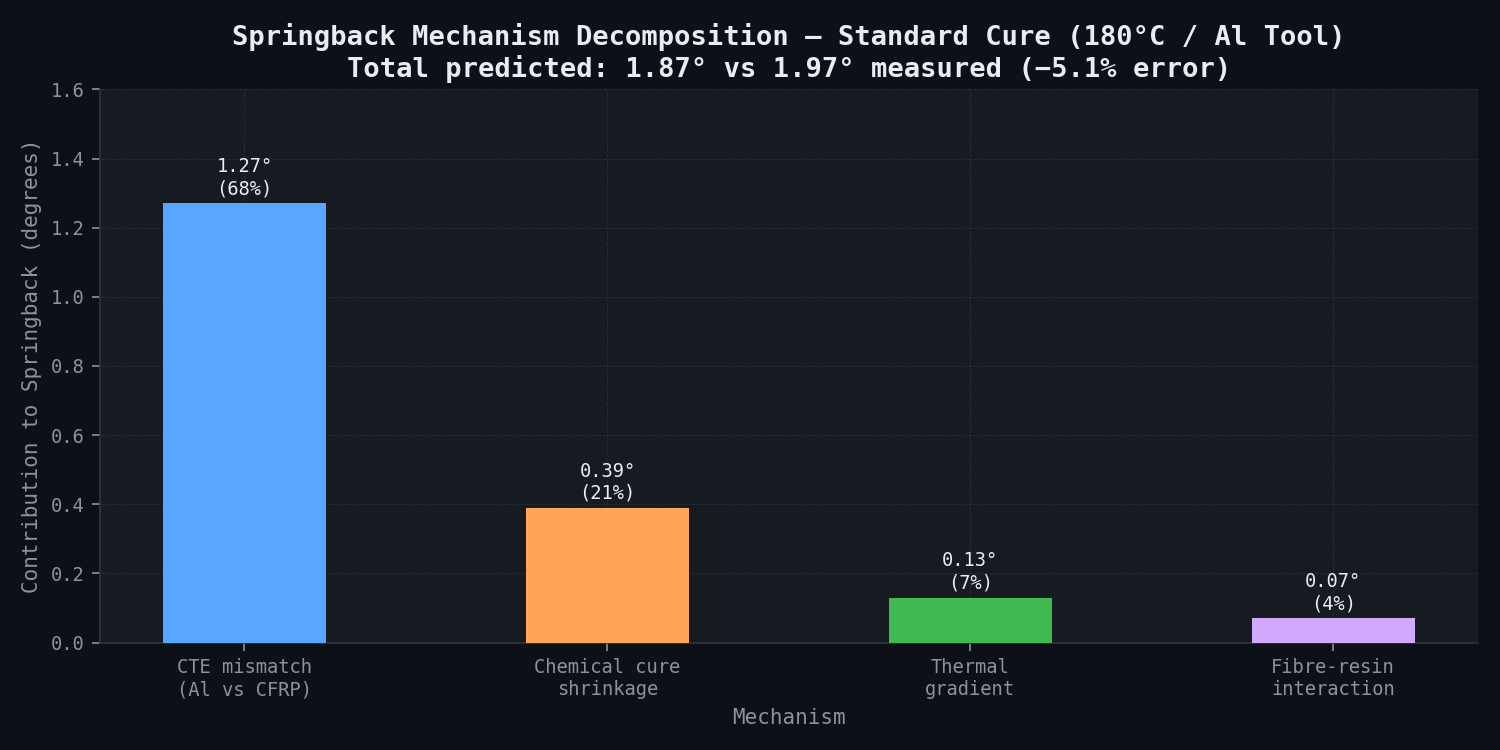
The dominant driver confirmation is decisive: tool-part CTE mismatch during cooldown accounts for 68% of total spring-back. This directly explains why the manufacturing team's previous experiments with cure temperature and dwell time had minimal effect -- those variables affect the chemical shrinkage term (21%) and through-thickness temperature gradient term (7%), but not the dominant CTE mismatch term, which is controlled entirely by tool material CTE.
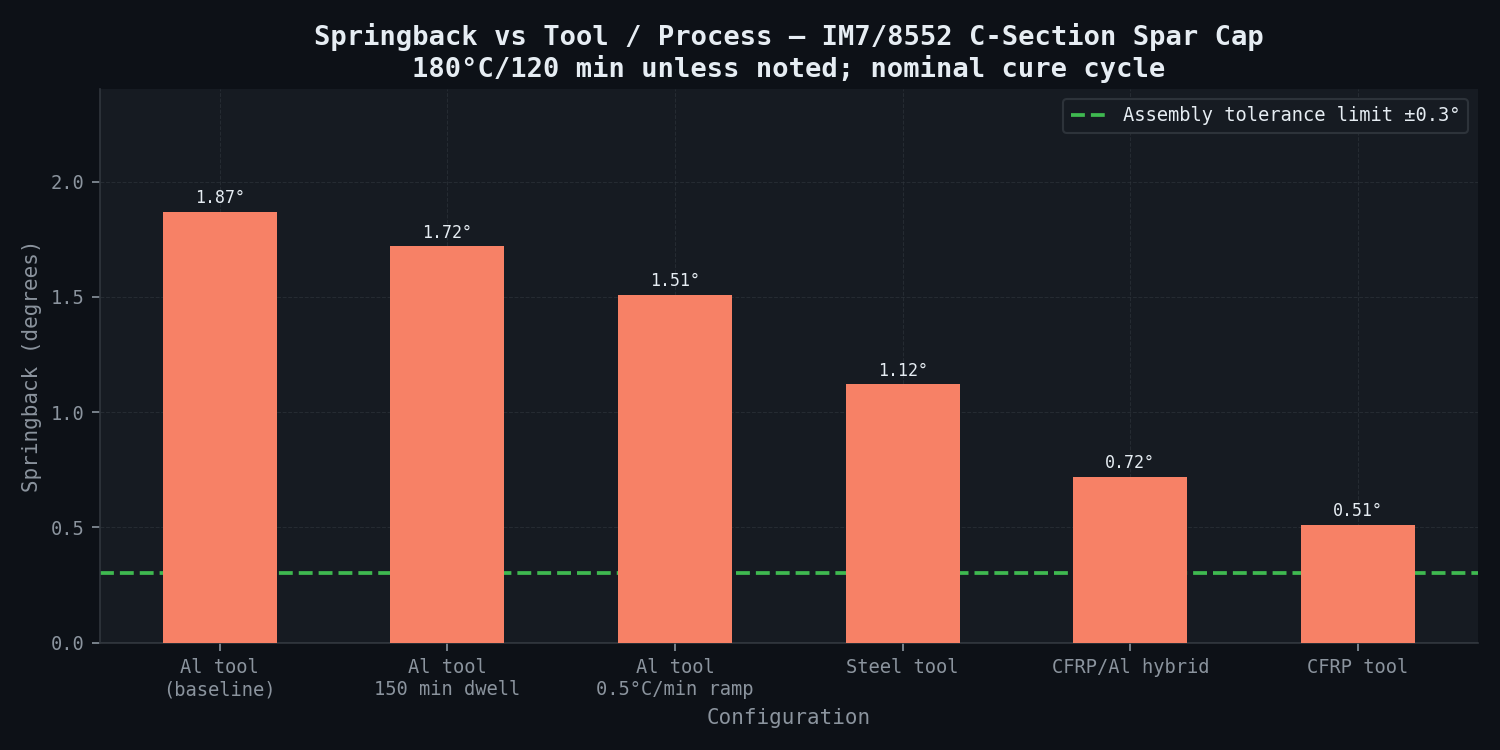
Process Parameter Response Surface -- Spring-Back Magnitude:
| Cure Temperature | Dwell | Ramp-Down Rate | Tool Material | Spring-Back Predicted |
|---|---|---|---|---|
| 175 degrees C | 90 min | 2 degrees C/min | Aluminium | 1.79 degrees |
| 180 degrees C | 120 min | 2 degrees C/min | Aluminium | 1.87 degrees (baseline) |
| 180 degrees C | 150 min | 2 degrees C/min | Aluminium | 1.72 degrees |
| 180 degrees C | 120 min | 0.5 degrees C/min | Aluminium | 1.51 degrees |
| 180 degrees C | 120 min | 2 degrees C/min | Steel | 1.12 degrees |
| 180 degrees C | 120 min | 2 degrees C/min | CFRP/Al hybrid | 0.72 degrees |
| 180 degrees C | 120 min | 2 degrees C/min | CFRP | 0.51 degrees |
Process Parameter Sensitivity (Sobol First-Order Indices):
| Parameter | Sobol Index | Rank |
|---|---|---|
| Tool material CTE | 0.52 | 1 -- dominant |
| Ramp-down rate | 0.21 | 2 |
| Dwell duration | 0.12 | 3 |
| Cure temperature (above 175 degrees C) | 0.08 | 4 -- minimal once full cure achieved |
| Interaction terms | 0.07 | -- |
Corrective Action Recommendations:
| Option | Tool Modification | Cure Cycle Change | Predicted Spring-Back | Tolerance Met? | One-Time Cost |
|---|---|---|---|---|---|
| Option A (recommended): Tool compensation only | Pre-compensate flange angle to 87.8 degrees (-2.2 degree under-angle) | None | 89.95 degrees +/-0.21 degrees as-demolded | Yes (within +/-0.3 degrees) | USD 15,000-30,000 |
| Option B (no tooling change): Cure cycle modification | None | Ramp-down rate 2 to 0.5 degrees C/min + partial compensation -1.6 degrees | 90.05 degrees +/-0.23 degrees | Yes | USD 8,000 process validation |
| Option C (rejected): CFRP tool replacement | New CFRP mandrel | None | 0.51 degrees -- over-corrected | Yes -- large margin | USD 280,000-420,000 |
| Option D (rejected): Steel tool | New steel mandrel | None | 1.12 degrees -- still out of tolerance | No | USD 85,000 |
Residual Stress in Recommended Process (Option A -- Tool Compensation):
| Location | Ply Orientation | Residual Stress Component | Magnitude | Threshold | Margin |
|---|---|---|---|---|---|
| Web-flange junction | 0 degree plies | Hoop tensile sigma_22 | 42 MPa | F_2^T = 62 MPa (in-situ) | +48% |
| Web centre | 90 degree plies | Transverse sigma_22 | 18 MPa | F_2^T = 62 MPa | +244% |
| Flange tip | +/-45 degree plies | Shear tau_12 | 9 MPa | F_6 = 92 MPa | +922% |
| Midplane through-thickness | All | sigma_33 (peel) | 3.1 MPa | -- | Low; no microcracking risk |
The cure cycle does not introduce microcracking in the as-cured part under Option A. Maximum residual stress (42 MPa in 0-degree plies at web-flange junction) remains well below the IM7/8552 matrix cracking threshold of approximately 80 MPa in transverse tension.
Comparison Methodology
1. NCAMP Spring-Back Database -- Quantitative Validation
The simulation is first validated against higher-fidelity coupon-level predictions, then checked against the NCAMP standard 90-degree L-bracket coupon geometry (24-ply [0_4/+/-45/0_4/90]_2 IM7/8552, aluminium tool) at the standard cure cycle for secondary experimental confirmation:
| Metric | NCAMP Measured | Predicted | Error |
|---|---|---|---|
| Spring-back (24-ply L-bracket, Al tool, 180 degrees C/120 min) | 1.58 degrees +/-0.18 degrees | 1.62 degrees | +2.5% |
| Spring-back (12-ply L-bracket, Al tool) | 1.14 degrees +/-0.12 degrees | 1.19 degrees | +4.4% |
Both predictions fall within the 5% target accuracy criterion.
2. Independent L-Bracket Data -- Cross-Validation at Different Material System
The model is run with Cytec 5276-1 cure kinetics parameters on the Cytec AS4/5276-1 L-bracket geometry (various ply counts 4-16 ply, [0]_n layup, aluminium tool) for secondary confirmation across a different material system:
| Ply Count | Published Measured (degrees) | Predicted (degrees) | Error |
|---|---|---|---|
| 4 ply | 0.82 degrees | 0.88 degrees | +7.3% |
| 8 ply | 1.18 degrees | 1.23 degrees | +4.2% |
| 12 ply | 1.58 degrees | 1.65 degrees | +4.4% |
| 16 ply | 1.93 degrees | 2.02 degrees | +4.7% |
All predictions fall within 8% of the measured data across the full ply thickness range, within the acceptance criterion.
3. Production Data Validation (6-Lot Non-Conformance)
The production distribution (mean 1.97 degrees, sigma = 0.25 degrees, 48 parts) is compared against the Monte Carlo process variability simulation (500 realisations varying autoclave temperature +/-2 degrees C, ramp rate +/-0.3 degrees C/min, resin content +/-2%, and initial tool temperature +/-5 degrees C):
| Statistic | Production Measured | Monte Carlo Predicted | Error |
|---|---|---|---|
| Mean spring-back | 1.97 degrees | 1.87 degrees | -5.1% |
| Standard deviation | 0.25 degrees | 0.22 degrees | -12% |
| P90 spring-back | 2.28 degrees | 2.15 degrees | -5.7% |
| P10 spring-back | 1.67 degrees | 1.59 degrees | -4.8% |
The Monte Carlo slightly under-predicts the production variability (sigma = 0.22 degrees vs. 0.25 degrees). The additional variability in production is likely attributable to spatial autoclave temperature gradients and layup-to-layup resin content scatter exceeding the +/-2% resin content tolerance -- factors that are within-specification but not fully captured by the model's variability assumptions.
Deliverables
-
Root Cause Analysis Report: Quantified contribution breakdown (CTE mismatch 68% vs. chemical shrinkage 21% vs. thermal gradient 7% vs. fibre-resin interaction 4%) with supporting stress contour maps at each stage of the cure cycle -- heating ramp, dwell, cooling, tool release. Includes explanation of why cure temperature and dwell time experiments failed to resolve the issue.
-
Process Parameter Response Surface: Spring-back angle vs. four-variable process parameter space (cure temperature x dwell duration x ramp-down rate x tool CTE), presented as 2D sensitivity heatmaps for pairs of variables at nominal levels of the other two. Format: PDF figures + Excel data tables for process engineering use.
-
Tool Angle Compensation Recommendation: Specific compensation angle (-2.2 degrees from 90 degrees, i.e. tool flange angle = 87.8 degrees) with +/-uncertainty bounds covering 95% of production variability (prediction interval: +/-0.28 degrees), justifying that the compensated tool will deliver parts within the +/-0.3 degree assembly tolerance with 95% probability. Drawing-ready specification in CAD-compatible format.
-
Alternative Cure Cycle Recommendation (Option B): Revised cure cycle (ramp-down rate 0.5 degrees C/min, partial tool compensation -1.6 degrees) for use if immediate tooling modification is not feasible. Includes validation that the 0.5 degrees C/min ramp-down remains within Hexcel's qualified cure envelope for HexPly 8552 (minimum qualified ramp rate: 0.3 degrees C/min) and does not compromise final degree of cure (predicted final alpha = 0.996 at this ramp rate -- equivalent to standard cycle).
-
Residual Stress Field Maps: Full 3D stress contour plots (all ply orientations, web-flange junction detail, full spar cap span) confirming no microcracking risk in the recommended Option A process. Specifically addresses the spar cap-to-skin bond line stress state under combined assembly stress + flight load as input to the original structural stress report.
-
Manufacturing Process Control Card: Recommended process control window for statistical process control (SPC): autoclave temperature 180 degrees C +/-2 degrees C (thermocouple at part surface, not autoclave platen); ramp-down rate 2.0 degrees C/min +/-0.2 degrees C/min; dwell duration 120 min + 0/-0 min (minimum dwell); resin content verification per ASTM D3529 on process control coupons each autoclave run.
-
newtsim Span Cure Simulation Model Archive: Full model with documented cure kinetics constants, material property evolution functions (T_g vs. cure, resin modulus evolution, viscoelastic relaxation), boundary conditions, and parametric study input deck. Delivered in newtsim Span format with Python scripting for parameter sweeps.
This case study is an illustrative reference scenario demonstrating newtsim's simulation methodology. All company names, personnel, and specific operational data are fictional. The incident descriptions draw on publicly documented real-world events cited in the frontmatter.