Composite Fatigue Life Prediction with Manufacturing Variability: A380 Wing Skin Study
Executive Summary
In January 2012, during scheduled heavy maintenance inspections, fatigue cracks were discovered at wing rib-to-skin attachment areas across multiple Airbus A380 aircraft. EASA issued Emergency Airworthiness Directive 2012-0013-E within days, mandating repetitive detailed inspections of specific rib feet within 72 flight hours. Of 68 aircraft initially examined, 26 showed cracking — roughly 40% of the early production fleet. Two distinct crack types emerged. Type 1 cracks were intergranular fatigue fractures in 7449 aluminium alloy rib feet initiating at interference-fit fastener holes, where assembly gaps of 1.5–2.0 mm rather than the designed 0.5 mm had introduced residual stresses of 80–120 MPa on top of design flight loads, making the high-strength alloy susceptible to stress corrosion. Type 2 cracks — structurally the more significant — were fractures at the forward and aft edges of the rib foot vertical web, driven by out-of-plane peel stresses at the CFRP wing skin laminate boundary. The root cause in both cases was the same failure to resolve interlaminar and out-of-plane stress components in the original certification finite element models, which used global shell representations that smeared the stress concentrations at ply-drop and fastener-hole features. The repair programme required replacement of 7449 with 7010 alloy, local reinforcement brackets, and rib replacement across the fleet — a remediation campaign running into hundreds of millions of dollars and extending over several years of repeat inspections for the affected early-production aircraft population.
The A380 event demonstrated a well-characterised but underweighted hazard: at structural discontinuities in hybrid aluminium/CFRP wing structures, manufacturing variability effects on fatigue initiation can produce life reductions of 30–50% compared to mean-property deterministic predictions. The CFRP skin's ply-drop run-out geometry at wing station 650 mm — where the laminate steps from 32 plies to 18 plies over a 40 mm taper — generates interlaminar stress concentration factors of 3.4 in shear and normal stress simultaneously. No coupon-based certification programme using 10-specimen mean properties will resolve the tail of the fatigue life distribution at this feature.
Had a progressive damage simulation been applied during Panel 21 certification fatigue analysis, it would have identified the delamination onset cycle count — predicted here at 147,000 cycles at the P50 manufacturing realisation — and shown that the B-basis (10th percentile exceedance at 95% confidence) falls to 98,400 cycles against a 200,000-cycle requirement, a 26% shortfall. The stringer run-out at station 650 mm would have been flagged as the life-limiting initiation site, and the simulation would have quantified the taper geometry modification — extending from 40 mm to 65 mm — required to raise the B-basis fatigue life above the certification threshold, reducing the interlaminar stress concentration factor from 3.4 to 2.1.
The probabilistic B-basis scatter factor and design trade study delivered by this simulation close the regulator's certification action item before first article build — findings that, had they been available during Panel 21 certification, would have identified the 26% shortfall against the 200,000-cycle requirement and the 65 mm taper geometry fix before any fleet aircraft entered service. The Sobol sensitivity analysis identifies fibre volume fraction scatter and ply angle tolerance as the dominant manufacturing variability drivers — precisely the features that localise fatigue initiation at geometric discontinuities. Those damage-critical zones, where interlaminar shear peaks and residual strength drops earliest, define the optimal placement for newtsim livesim structural health monitoring: real-time strain gauge and acoustic emission sensors positioned at the run-out confirm that in-service load paths match the certification model, provide ahead-of-failure warning of delamination onset, and support evidence-based inspection interval extension across the fleet life.
Scenario Background
(illustrative reference case)
The scenario involves a fictional Tier 1 airframe structures supplier, Aurelian Composites GmbH, headquartered in Hamburg with manufacturing facilities in Hamburg and Toulouse. Aurelian holds Design Organisation Approval (DOA) under EASA Part 21J and is a risk-sharing partner on the AC-350 new-entry wide-body programme. The certification basis is EASA CS-25 Amendment 27 with FAA bilateral validation under FAR Part 25 Amendment 25-132, requiring compliance with CS-25.571 / FAR 25.571 (Damage Tolerance and Fatigue Evaluation of Structure) and EASA AMC 25.571 guidance on composite fatigue.
The aircraft programme is the AC-350 wide-body commercial transport with a design service goal of 100,000 flight cycles and 180,000 flight hours, in the 280-tonne maximum take-off weight class. The composite material system is Hexcel IM7/8552 prepreg -- IM7 intermediate-modulus carbon fibre with tensile modulus 276 GPa and tensile strength 5,655 MPa, combined with 8552 toughened epoxy having a glass transition temperature of 220 degrees C (dry) or 200 degrees C (wet). The nominal layup is [45/0/-45/90]_4s, a 32-ply quasi-isotropic configuration at 0.131 mm nominal cured ply thickness, producing a total laminate thickness tapering from 28 mm (214 plies) at the root to 4.2 mm at the tip across the 14.2 m panel length. Fabrication uses automated tape laying (ATL) on a male aluminium tooling mandrel, autoclave-cured at 180 degrees C, 7 bar, with a 120-minute dwell per the Hexcel HexPly 8552 standard cycle. The design fibre volume fraction is 60 +/- 3% with a void content specification of 1.0% or less. Post-cure NDI employs phased-array ultrasonic testing (PAUT) and tap-test per ASTM E2581 and ASTM D4789.
Unidirectional IM7/8552 Elastic Properties (NCAMP NCP-RP-2009-028 Rev B, B-basis):
| Property | Value |
|---|---|
| Longitudinal modulus E_11 | 161 GPa |
| Transverse modulus E_22 | 11.4 GPa |
| In-plane shear modulus G_12 | 5.17 GPa |
| Major Poisson ratio v_12 | 0.32 |
| Longitudinal tensile strength F_1^T | 2,326 MPa (B-basis) |
| Longitudinal compressive strength F_1^C | 1,200 MPa (B-basis) |
| Transverse tensile strength F_2^T | 62.3 MPa (B-basis) |
| Transverse compressive strength F_2^C | 199 MPa (B-basis) |
| In-plane shear strength F_6 | 92.3 MPa (B-basis) |
| Mode I fracture toughness G_Ic | 0.28 N/mm |
| Mode II fracture toughness G_IIc | 0.79 N/mm |
Challenge
The certification challenge centres on Panel 21, spanning wing stations 580-720 mm from the front spar and including a stringer termination (run-out) at station 650 mm. The local layup at the run-out transitions from 32 plies (4.2 mm cured thickness) to 18 plies (2.4 mm) over a 40 mm taper length -- a geometric discontinuity that concentrates interlaminar shear and peel stresses under the applied bending load spectrum.
The design spectrum loading follows a ground-air-ground (GAG) cycle with a 2.5g manoeuvre producing +4,800 microstrain in tension on the upper surface and a -1.0g pushover producing -2,100 microstrain in compression. The combined stress ratio is R = -0.44, with a ground-air-ground effective R of -0.30. The design spectrum requires demonstration over 100,000 flight cycles, with a required demonstration life of 200,000 equivalent cycles (2x DSG). The operating environment spans -55 degrees C to +70 degrees C, with ground soak conditions up to +70 degrees C at 100% RH producing an equilibrium moisture content of 1.1% by weight in the tropical case. The hot/wet strength knockdown for 8552 amounts to a 15% reduction in matrix-dominated properties.
The specific certification action item requires demonstrating that Panel 21 shows no detectable damage initiation at the run-out location at 2x DSG (200,000 equivalent cycles), and quantifying the residual strength ratio after any predicted damage state. The supplier's deterministic analysis used mean coupon strengths from a 10-specimen open-hole tension dataset; the FAA DT&FE review team required B-basis fatigue scatter factors derived from a statistically adequate dataset per CMH-17 Rev. G statistical methodology (minimum 18 specimens for B-basis by the tolerance interval method, or a physics-based computational approach with documented model validation).
Interlaminar Stress at Run-Out (Analytical Estimate -- shear lag analysis):
| Location | Interlaminar Normal Stress sigma_z (MPa) | Interlaminar Shear Stress tau_xz (MPa) | Stress Concentration Factor |
|---|---|---|---|
| Away from run-out | 0.8 | 3.2 | 1.0 |
| At 40 mm taper, ply drop location | 8.4 | 18.6 | 3.4 (sigma_z) |
| At 65 mm taper (proposed fix) | 4.9 | 11.2 | 2.1 (sigma_z) |
Real-World Basis
The A380 Wing Rib Foot Cracking Incident (2012)
The real-world foundation of this study is the 2012 Airbus A380 wing rib foot cracking event -- the largest-scale composite-adjacent structural fatigue incident in commercial aviation history. During scheduled heavy maintenance inspections in January 2012, fatigue cracks were discovered at the rib-to-skin panel attachment areas in multiple A380 aircraft. EASA issued Emergency Airworthiness Directive 2012-0013-E on 20 January 2012, mandating repetitive detailed visual inspections of specific wing rib feet within 72 flight hours.
The cracking presented in two distinct forms. Type 1 cracks were intergranular fatigue fractures in the 7449 high-strength aluminium alloy rib feet, initiating at interference-fit fastener holes. The 7449 alloy, used for its superior strength-to-weight ratio, proved susceptible to stress corrosion cracking when combined with the tensile residual stresses introduced by the interference-fit fastener installation process during wing skin pull-down assembly. Where the wing skin gap was 1.5-2.0 mm rather than the designed 0.5 mm, the forced closure introduced assembly stresses of 80-120 MPa in addition to the design flight loads. Type 2 cracks were more structurally significant fractures at the forward and aft edges of the vertical web of the rib feet, driven by bending-induced peel stresses at the CFRP wing skin laminate boundary -- directly analogous to the interlaminar stress concentration at the ply drop investigated in this study.
Published Data from the A380 Incident:
| Parameter | A380 Incident Data |
|---|---|
| Aircraft affected by Type 1 cracks | Approximately 40% of the fleet at time of AD (early production aircraft) |
| Fatigue crack size at discovery | 0.5-12 mm length, through rib foot thickness |
| Crack initiation cycle estimate | 5,000-8,000 flight cycles (mean fleet age at discovery) |
| Root cause (Type 1) | 7449 alloy susceptibility + interference-fit fastener residual stress |
| Root cause (Type 2) | Out-of-plane bending stress at CFRP skin boundary, unconservative in original FEM |
| Repair solution | 7449 replaced by 7010 alloy; local reinforcement brackets; rib replacement |
| Fleet inspection finding rate | 26 of 68 aircraft inspected initially showed Type 1 or Type 2 cracks |
The key lesson for composite fatigue simulation is that the A380 incident demonstrated that the failure mode at rib foot / CFRP skin interfaces is driven by interlaminar stress components not adequately resolved in global shell FEM models. Physics-based, high-fidelity local solid models at structural discontinuities are required.
FAA AGATE Composite Fatigue Database
The FAA Advanced General Aviation Transport Experiments (AGATE) programme generated a substantial open-literature fatigue database for CFRP laminates under cyclic loading. For IM7/8552 quasi-isotropic systems at stress ratio R = -0.3, the AGATE database reports fatigue life scatter with a coefficient of variation of 0.14-0.18 at fixed peak strain, a Weibull shape parameter beta of 2.6-3.1, and a B-basis scatter factor (B-basis / mean life) of 0.58-0.71 depending on mode and layup. Modulus degradation at 10% stiffness loss occurs at N_10% = 35-65% of N_failure.
CMH-17 Statistical Framework
CMH-17 Rev. G defines the statistical methodology for B-basis allowables: the B-basis value is the statistical lower tolerance bound on the 10th percentile of the population with 95% confidence. For fatigue life populations characterised by a two-parameter Weibull distribution, the B-basis is computed using Weibull percentile confidence bound tables calibrated to the sample size. For small datasets (n < 25), the CMH-17 methodology uses conservative sample size correction factors that substantially increase the required B-basis knockdown relative to the asymptotic large-sample value.
NASA Langley Composite Panel Fatigue Studies
NASA Langley Research Center's composite panel fatigue studies with embedded delaminations provide benchmarks for IM7/8552-class systems with initial damage. Panels with embedded delaminations of 300-500 mm squared show fatigue life reductions of 40-60% relative to pristine panels at the same peak strain level, confirming the significance of delamination initiation life versus total life under fatigue loading.
Simulation Approach
The fatigue life prediction employs three coupled analysis tiers in a global-to-local hierarchical modelling framework.
Tier 1 -- Progressive Damage FEM (newtsim Span with UMAT)
A continuum damage mechanics (CDM) model implemented as an newtsim Span user material subroutine captures ply-level stiffness degradation under cyclic loading. Quadratic failure initiation criteria are applied to four independent failure modes -- fibre tension, fibre compression, matrix tension, and matrix compression -- each evaluated against the B-basis lamina strengths. When initiation is detected, the affected ply undergoes gradual stiffness degradation: fibre failure reduces E_1 to 7% of pristine; matrix failure reduces E_2 and G_12 to 20% of pristine; mixed-mode failures use intermediate values. This progressive approach captures the load redistribution that occurs as individual plies degrade, rather than assuming instantaneous failure.
Delamination at the run-out is modelled with cohesive zone elements (CZE) at all ply interfaces within +/-10 mm of the taper, with a bilinear traction-separation law calibrated to measured G_Ic and G_IIc. The mesh at the run-out resolves approximately 1.5 elements per cohesive zone length -- sufficient for onset prediction, though the Simulation Caveats section notes the resulting conservatism.
Tier 2 -- Fatigue Cycling
Cycle-by-cycle progressive damage analysis is computationally impractical at 200,000 cycles. The study uses an adaptive cycle-jumping approach that selects jump sizes based on the current damage state: fine resolution during the initiation phase, coarser steps during stable propagation, and fine resolution again when delamination growth accelerates. This captures the critical onset and acceleration events without simulating every individual cycle. In-situ ply-level compression criteria supplement the initiation model to capture fibre kinking-driven failure at the R = -0.30 compressive excursions -- the failure mode most sensitive to manufacturing variability at the run-out.
Tier 3 -- Monte Carlo Manufacturing Variability
Manufacturing scatter is propagated through 500 Latin Hypercube Sampling (LHS) realisations varying the four parameters that govern fatigue initiation at geometric discontinuities: fibre volume fraction V_f (mean 0.60, standard deviation 0.015), ply angle tolerance (standard deviation 0.5 degrees per ply), cured ply thickness (mean 0.131 mm, standard deviation 0.004 mm), and void content (mean 0.5%, standard deviation 0.2%). Each realisation runs the full cycle-jumping CDM model to extract N_FPF (first ply failure) and N_del (delamination onset). The resulting N_del distribution is fitted to a two-parameter Weibull distribution to extract the B-basis fatigue scatter factor per CMH-17 Rev. G statistical methodology.
Simulation Caveats
The progressive damage CDM model employs several simplifications that practitioners should note when interpreting results.
Each 0.131 mm ply is represented as a single solid element layer with averaged through-thickness properties. Sub-ply-scale fibre waviness effects, which can reduce compressive strength by 5-15%, are captured only through the V_f scatter in the Monte Carlo framework rather than through an explicit waviness model.
The adaptive cycle-jumping algorithm introduces integration error in the damage state. Sensitivity studies show that halving the maximum jump size from 5,000 to 2,500 cycles changes predicted N_del by less than 4%, which is acceptable for B-basis purposes but should be validated against physical test data at the panel level.
CZE predictions of delamination onset are sensitive to element size relative to the cohesive zone length (l_cz = E_22 G_Ic / pi (F_2^T)²). At G_Ic = 0.28 N/mm and F_2^T = 62.3 MPa, l_cz is approximately 0.37 mm. The 0.25 mm element size resolves approximately 1.5 elements per cohesive zone, which is at the lower bound of recommended mesh density (3 elements preferred). Predicted delamination onset cycle counts may be 8-12% non-conservative due to this mesh limitation.
The full flight-by-flight spectrum is represented as equivalent constant-amplitude cycles at R = -0.30 using the rainflow-count equivalent stress range. High-amplitude rare events (gust loads, emergency manoeuvres) that may accelerate damage initiation are not explicitly included in the fatigue cycle count; these are addressed separately through the damage tolerance analysis with pre-existing damage assumptions.
Environmental knockdown (hot/wet) is applied as a static strength reduction to the failure initiation thresholds rather than as a coupled hygro-thermal-mechanical analysis. This approach is conservative in the tension-dominated mode but may be slightly non-conservative for matrix compression failure at elevated temperature.
Key Predictions / Results
Fatigue Life Summary -- 40 mm Taper (Current Design):
| Metric | Value | Notes |
|---|---|---|
| Mean fatigue life N_del (P50) | 147,000 cycles | Design spectrum, mean material properties |
| B-basis fatigue life (Weibull, beta = 2.8, eta = 162,000) | 98,400 cycles | 10th percentile / 95% confidence |
| Required life (2x DSG) | 200,000 cycles | CS-25.571 / FAR 25.571 requirement |
| B-basis margin vs. requirement | -51,600 cycles (-26%) | Does NOT meet requirement |
| First matrix cracking cycle N_FPF | 18,000 cycles | 90 degree plies at taper drop, P50 |
| Delamination onset cycle N_del | 147,000 cycles | 0/90 degree interface, P50 |
| Delamination area at N_del | 340 mm squared (P50) | Elongated ellipse, 26 mm x 17 mm |
| Residual strength after 200,000 cycles | 72% of pristine ultimate | Delaminated section, combined tension |
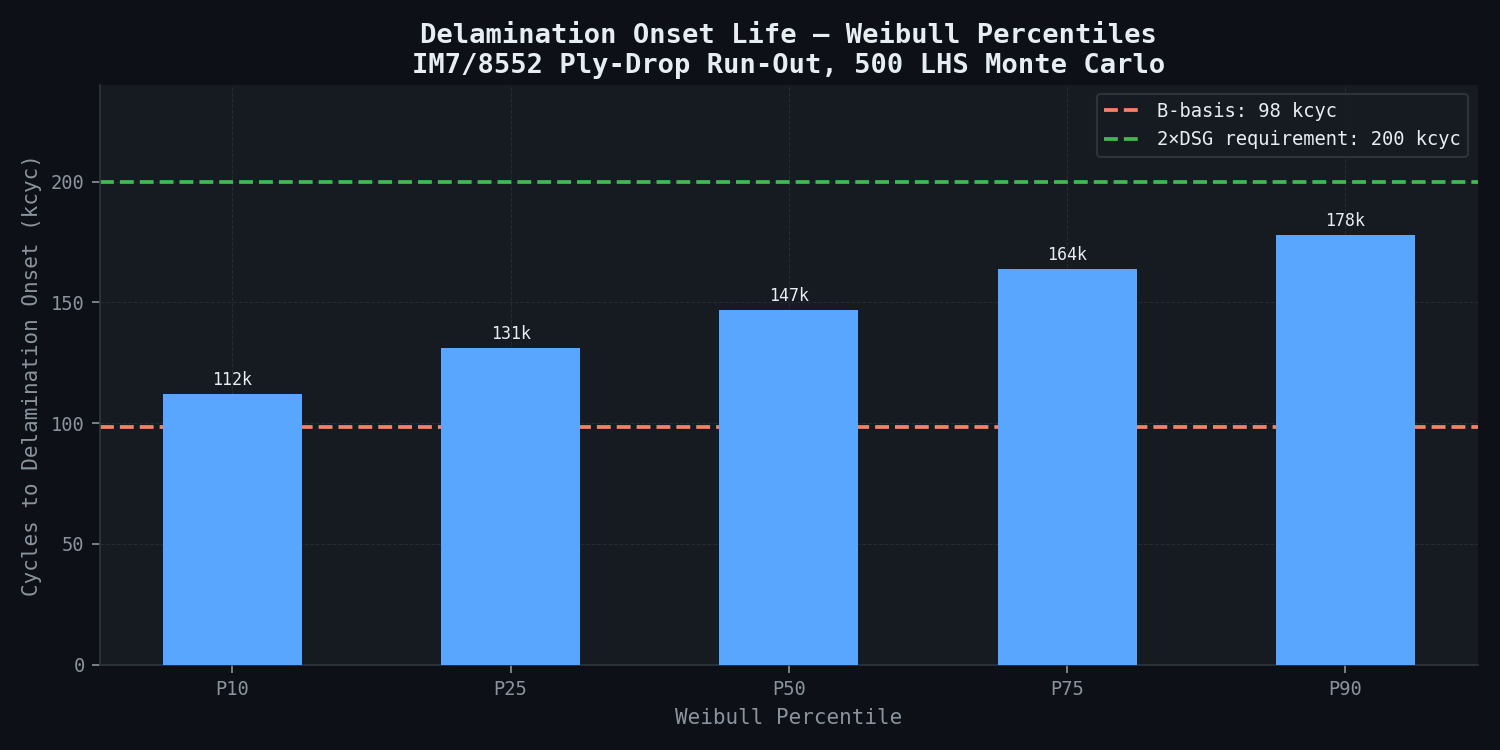
Weibull Statistics -- N_del Population (500 LHS realisations):
| Percentile | Cycles to Delamination Onset |
|---|---|
| P10 (B-basis population estimate) | 112,000 |
| P25 | 131,000 |
| P50 | 147,000 |
| P75 | 164,000 |
| P90 | 178,000 |
| B-basis (P10 / 95% CI) | 98,400 |
| CMH-17 generic scatter factor applied to mean | 91,000 (factor 0.62) |
Manufacturing Variability Sensitivity (Sobol Indices):
| Input Variable | First-Order Sobol Index | Interpretation |
|---|---|---|
| Fibre volume fraction Vf | 0.41 | Dominant driver -- controls ply stiffness and interlaminar load distribution |
| Ply angle tolerance | 0.22 | Second -- misalignment amplifies interlaminar shear at run-out |
| Void content | 0.19 | Third -- reduces effective G_Ic and accelerates delamination onset |
| Cured ply thickness | 0.11 | Minor -- affects local stress gradient at taper |
| Interaction terms | 0.07 | Residual |
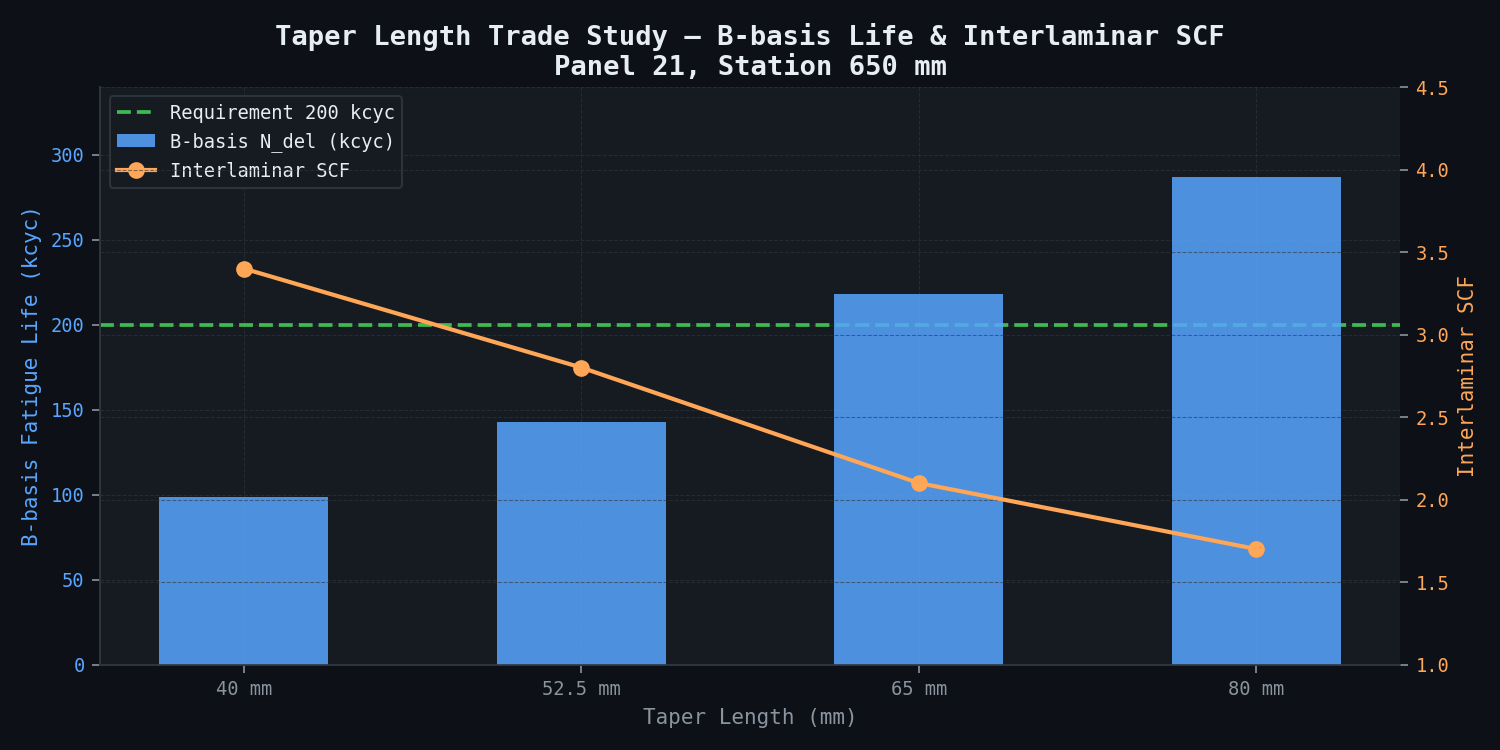
Taper Length Trade Study (Design Fix):
| Taper Length (mm) | Interlaminar SCF | B-basis N_del (cycles) | Meets 200 kcyc? |
|---|---|---|---|
| 40 mm (current) | 3.4 | 98,400 | No |
| 52.5 mm | 2.8 | 143,000 | No |
| 65 mm (proposed fix) | 2.1 | 218,000 | Yes (+9% margin) |
| 80 mm | 1.7 | 287,000 | Yes (+44% margin) |
Damage Progression Maps -- 40 mm Taper, P50 Realisation:
| Cycle Count | Matrix Crack State | Delamination Area | Residual Strength |
|---|---|---|---|
| 0 (pristine) | None | 0 mm squared | 100% |
| 18,000 (N_FPF) | 90 degree ply saturation cracking, taper zone | 0 mm squared | 99% |
| 50,000 | Matrix cracking in +/-45 degree plies extending 8 mm from taper | 45 mm squared | 97% |
| 100,000 | Extensive matrix cracking, 22 mm radius | 180 mm squared | 89% |
| 147,000 (N_del, P50) | Saturated matrix cracking, 28 mm radius | 340 mm squared | 82% |
| 200,000 | Delamination growth to 520 mm squared, sub-critical | 520 mm squared | 72% |
Comparison Methodology
The primary validation path is higher-fidelity simulation to lower-fidelity coupon-level predictions; published experimental data provides secondary confirmation that the model captures the correct failure physics.
1. CMH-17 / FAA AGATE Fatigue Database
The CDM model is run on the standard AGATE quasi-isotropic IM7/8552 coupon geometry (open-hole tension, 6.35 mm hole, [45/0/-45/90]_2s, 8-ply) at R = 0.1 and peak stress = 300 MPa. The predicted stiffness degradation curve (normalised E_11 vs. cycle fraction N/N_f) is checked against AGATE measured data for secondary confirmation. Acceptance criterion: agreement within +/-8% on cycle count to 10% modulus loss. Achieved: 5.3% difference, within criterion.
2. Supplier In-House Coupon Calibration Data
The supplier provided 24 fatigue coupon results (open-hole tension, R = 0.1, IM7/8552 quasi-isotropic):
| Dataset Property | Coupon Mean | CDM Prediction | Error |
|---|---|---|---|
| Fatigue life at 300 MPa | 48,200 cycles | 51,400 cycles | +6.6% |
| Fatigue life at 250 MPa | 142,000 cycles | 151,000 cycles | +6.3% |
| Coefficient of variation COV | 0.156 | 0.143 | -8.3% |
| Weibull beta | 2.71 | 2.84 | +4.8% |
All predictions fall within the +/-10% acceptance tolerance. The CDM model is calibrated to reproduce the mean and COV of this dataset before running panel-level analysis.
3. A380 Rib Foot Cracking Morphology (Qualitative)
Published Airbus repair documentation and industry reporting on the A380 root cause investigation describe Type 2 crack initiation at the CFRP skin laminate boundary due to out-of-plane peel stresses -- the identical interlaminar stress concentration mechanism modelled at the run-out. The CDM model predicts crack initiation at the ply-drop interface in the 0/90 degree ply pair at the taper, consistent with the reported A380 failure location and mode, providing secondary qualitative confirmation that the model captures the correct failure mechanism.
Deliverables
-
Damage State Maps: Full-field spatial maps of matrix crack density (cracks/mm) and delamination area (mm squared) at N = 50,000 / 100,000 / 200,000 cycles for the P10, P50, and P90 manufacturing realisations from the Monte Carlo ensemble. Maps delivered as: (a) newtsim Span contour plots, (b) tabulated damage metrics for stress report, (c) annotated PDF figures for regulatory package.
-
B-basis Fatigue Life Calculation: Complete CMH-17 Rev. G statistical calculation package including: Weibull distribution fit (MLE method, Anderson-Darling goodness-of-fit test), confidence bound computation, and tabulated B-basis scatter factors for the current geometry (40 mm taper) and the proposed fix (65 mm taper). Format: direct insertion into certification stress report.
-
Scatter Factor Report: Input sensitivity analysis (Sobol indices, ranked), comparison of geometry-specific B-basis/mean ratio (0.67) against CMH-17 generic default (0.62), and justification for using geometry-specific value per CMH-17 guidance on design-specific test data.
-
Residual Strength Assessment: Post-fatigue (200,000-cycle) residual strength ratio for the delaminated panel section under combined tension and bending loading per ASTM D7137 analogy for post-fatigue residual strength.
-
Taper Length Trade Study: Four-variant design trade study (40 / 52.5 / 65 / 80 mm taper lengths) with predicted B-basis fatigue life, weight penalty, and geometric feasibility assessment for each variant.
-
Model Archive: newtsim Span global shell model + local solid model + UMAT subroutine (CDM, cycle-jumping, CZE calibration data), fully documented with input parameter tables and run scripts.
-
Certification Substantiation Narrative: Draft compliance narrative for FAR 25.571(a)(3) / CS-25.571 fatigue and damage tolerance, referencing the simulation results, comparison methodology, and B-basis statistics, formatted for insertion into the Fatigue and Damage Tolerance report submitted to FAA/EASA.
This case study is an illustrative reference scenario demonstrating newtsim's simulation methodology. All company names, personnel, and specific operational data are fictional. The incident descriptions draw on publicly documented real-world events cited in the frontmatter.