316L Stainless Steel Lattice Structure Build Parameter Audit and Qualification Evidence
Executive Summary
The qualification methodology gap documented in this audit is one of the most prevalent and consequential errors in industrial AM practice. Published characterisation has shown systematically that near-horizontal LPBF struts — those oriented at 0–30° to the build plate — consistently exhibit positive diameter deviations of 18–32% across multiple platforms and materials. The mechanism is straightforward. At shallow build angles, each successive layer deposits onto an unsupported powder surface on the lower strut face: the melt pool boundary is unconstrained by previously solidified material, liquid metal spreads laterally into the powder bed, and the effective solidified cross-section is larger than the CAD geometry. After multiple layers the accumulation is substantial and reproducible. ISO/ASTM 52910:2018 Section 7.4.2 explicitly requires lattice-specific qualification data — not solid witness cube data — precisely because this mechanism is well known and predictable. And yet, in practice, solid-cube density qualification remains the dominant approach in industrial AM supplier agreements, because lattice coupon testing adds time and cost at programme inception. The problem surfaces later, after delivery, in a customer quality audit that finds +24% strut diameter deviation in 19% of the struts in a 47-unit fleet of 316L TPMS Gyroid recuperator cores — units that have been in service for up to 14 months in a chemical process plant operating at 2.5 bar differential pressure and 550°C.
Had a melt pool CFD simulation been run during process development, the strut diameter deviation would have been predicted at each build angle before a single unit was delivered. The simulation would have computed the angle-dependent melt pool spread — quantifying the 0.13 mm diameter excess at 0° and mapping the transition to within-tolerance dimensions above 60° — and converted that geometric prediction into relative density, effective mechanical properties under Gibson-Ashby scaling, and pressure drop impact. It would have designed the angle-dependent laser power modulation table that eliminates the deviation: a 12.5% power reduction for horizontal struts, tapering to no change at 60° and above. More immediately, it would have produced the structural integrity assessment showing that the as-built lattice, at 27.8% effective relative density versus the nominal 25%, has a compressive yield strength of 42 MPa instead of 33 MPa and a burst pressure safety factor of 10.8× against the customer's 4.0× minimum — the out-of-tolerance struts make the lattice stronger, not weaker. The units do not need to be recalled. The qualification evidence package can be built retrospectively, from simulation.
Had this simulation been run during process development, the strut diameter deviation would have been predicted and eliminated before a single unit was delivered. This study delivers that retrospective audit in 6 weeks: melt pool CFD at five build angles calibrated against published strut geometry data, as-built geometry reconstruction across all 8,420 struts per unit, FEA structural integrity confirmation, and an ISO/ASTM 52910-compliant qualification evidence package that closes the non-conformance without recall. The 47-unit delivered fleet carries a recall exposure of $564,000–$846,000 at $12,000–$18,000 per unit replacement cost — an exposure triggered entirely by the qualification methodology gap of using solid density cubes instead of lattice-specific process validation. A newtsim simulation would have identified the angle-dependent melt pool spread mechanism and generated the corrective power modulation table before first article delivery. The simulation's predicted high-deviation strut orientations — the 0–30° near-horizontal population comprising 18% of all struts — define the CT inspection sampling plan for in-production quality monitoring, and the calibrated melt pool model provides the parameter input for newtsim livesim angle-aware in-process monitoring that prevents the qualification gap from recurring on future builds.
Scenario Background (illustrative reference case)
The scenario concerns Kestrel Thermal Systems (illustrative), a specialist heat exchanger engineering firm transitioning from conventional brazed-plate and tube-and-shell technology to AM lattice architectures for compact recuperator applications in chemical process, power generation, and aerospace sectors. The facility is ISO 9001:2015 certified and pursuing ASME BPV Code Section VIII Division 1 compliance for pressure vessel applications.
The machine platform is an SLM Solutions SLM 280 twin-laser system with a build volume of 280 mm x 280 mm x 365 mm. Two 700 W fibre lasers operate simultaneously on separate stitching zones, with a minimum focused spot diameter of 80 um. The standard process gas is nitrogen (O2 < 100 ppm) for 316L -- economical compared to argon and appropriate for austenitic stainless steels that do not require an ultra-low oxygen atmosphere.
The material is 316L austenitic stainless steel powder with a nominal composition (wt%) of Fe bal., Cr 16.5--18.5, Ni 10.0--14.0, Mo 2.0--3.0, Mn max 2.0, Si max 1.0, and C max 0.03 (the "L" designation denotes low carbon for improved weld/AM corrosion resistance). The powder is 15--45 um, gas-atomised, and spherical in morphology with a D50 of approximately 27 um. Representative as-built LPBF 316L properties from literature and SLM Solutions published data include a yield strength (0.2% offset) of approximately 490 MPa, UTS of approximately 640 MPa, elongation of approximately 40%, and elastic modulus of approximately 193 GPa. Because 316L undergoes no solid-state phase transformations during LPBF build or service and remains fully austenitic throughout, process design is simplified (no martensite transformation concerns), but residual stress and density become the dominant quality metrics.
The target part is a TPMS Gyroid lattice recuperator core with overall dimensions of 80 mm x 80 mm x 60 mm. The Gyroid TPMS surface is defined by F(x,y,z) = sin(2pix/L)cos(2piy/L) + sin(2piy/L)cos(2piz/L) + sin(2piz/L)cos(2pix/L) = t, where L = cell size = 5 mm and the level-set parameter t controls relative density. At t = 0 the surface self-intersects and divides the volume into two co-continuous phases of equal volume (50% relative density). The target relative density of 25% is achieved at t approximately equal to +0.52 (one phase enriched), giving a nominal strut wall thickness equivalent diameter of 0.50 mm.
Service conditions include a hot gas inlet temperature of 550 deg C and a cool gas inlet of 380 deg C. The maximum operating pressure differential across the core is 2.5 bar (design pressure; test pressure per ASME Code: 3.75 bar = 1.5x operating pressure). Cyclic thermal loading produces a 180 deg C temperature swing per operating cycle at an estimated 12 cycles per day, with an expected service life of 15 years (65,700 cycles minimum).
Challenge
Customer audit findings and CT scan evidence:
Zeiss Metrotom 1500 industrial X-ray CT system (35 µm voxel resolution, 190 kV, 360° tomographic reconstruction) scanned three randomly selected delivered units from the 47-unit delivery:
| Unit ID | Total Struts Measured | In-Tolerance (±0.05 mm) | Out-of-Tolerance | Max Deviation | Orientation Correlation |
|---|---|---|---|---|---|
| KT-047 | 8,420 | 6,810 (80.9%) | 1,610 (19.1%) | +0.119 mm (+23.8%) | All OOT: 0–25° from horizontal |
| KT-044 | 8,380 | 6,790 (81.0%) | 1,590 (19.0%) | +0.122 mm (+24.4%) | All OOT: 0–28° from horizontal |
| KT-039 | 8,450 | 6,870 (81.3%) | 1,580 (18.7%) | +0.118 mm (+23.6%) | All OOT: 0–26° from horizontal |
The strut diameter deviation exhibits three defining characteristics. First, it is strongly build-orientation-dependent: there is a clear correlation between strut-to-horizontal angle and measured diameter, with near-horizontal struts (0--30 deg) systematically oversized and vertical struts (80--90 deg) within tolerance. Second, the deviation pattern is reproducible across units -- identical across all three scanned units, confirming it is a systematic process signature rather than random variation. Third, the root cause mechanism is well understood: at shallow build angles, each successive LPBF layer adds material to the strut cross-section on an unsupported surface where the strut's lower face lacks solid support below and rests on partially sintered powder. The melt pool spreads laterally into the powder bed, solidifying with a larger effective cross-section than the nominal CAD geometry. This "staircase effect" combined with melt pool spread is quantitatively documented in published data for multiple LPBF systems including 316L.
Qualification methodology gap:
The original process qualification used 10 mm × 10 mm × 10 mm solid density cubes. The following table contrasts the thermal environment of solid cubes versus 0.5 mm lattice struts:
| Property | Solid Density Cube | 0.5 mm Gyroid Strut (vertical) | 0.5 mm Gyroid Strut (0° horizontal) |
|---|---|---|---|
| Thermal conductivity of adjacent region | Solid 316L SS (16 W/m/K) | Powder (0.1–0.3 W/m/K) | Powder on one face only |
| Heat extraction (primary path) | Downward through solid | Radial from strut | Strongly asymmetric |
| Effective melt pool cooling rate (K/s) | ~1 × 10⁶ | ~6 × 10⁵ | ~3 × 10⁵ |
| Predicted melt pool width | 130 µm | 145 µm | 200–240 µm |
| Predicted relative density | 99.6% | 99.1% | N/A (strut-forming) |
The solid cube and lattice strut operate in fundamentally different thermal environments. Density cube qualification is a necessary but insufficient condition for lattice process approval. ISO/ASTM 52910:2018 Section 7.4.2 explicitly requires lattice-specific qualification data.
Mechanical performance implication — Gibson-Ashby analysis:
For a TPMS Gyroid lattice in 316L, published experimental work calibrated the Gibson-Ashby power-law relationship:
E* / E_s = C₁ × (ρ*/ρ_s)^n
where C₁ = 0.31 ± 0.03, n = 2.15 ± 0.08 (calibrated to measured Gyroid 316L specimens across 10–40% relative density range). At nominal 25% relative density: E* = 0.31 × 193 × (0.25)².¹⁵ = 3.7 GPa. At as-built estimated 27.8% relative density: E* = 0.31 × 193 × (0.278)².¹⁵ = 4.8 GPa (+30%). Compressive yield strength analogously: σ_y / σ_y,s = C₂ × (ρ/ρ_s)^m, with C₂ = 0.22, m = 1.65 (calibrated for 316L Gyroid). At 27.8% relative density: σ*_y = 0.22 × 490 × (0.278)¹.⁶⁵ = 42 MPa (vs. nominal 33 MPa, +27%).
The as-built lattice is stiffer and stronger than designed — it is a conservative deviation from a structural perspective. The question for the customer audit is whether this deviation compromises the pressure vessel integrity requirement or the thermal-hydraulic performance specification.
Real-World Basis
The foundational experimental dataset for TPMS lattice mechanical property scaling in LPBF comes from published work on both Al-Si10-Mg and 316L Gyroid TPMS lattices at relative densities of 10–40%, providing the calibrated Gibson-Ashby constants (C₁, n) used in this audit. A key finding: LPBF manufacturing imperfections (strut diameter variation, surface roughness) cause systematic deviation from theoretical Gibson-Ashby predictions — the as-built elastic modulus is typically 85–95% of the Gibson-Ashby prediction using nominal geometry, due to geometric imperfections. This means the as-built lattice with oversized struts will not be as stiff as Gibson-Ashby at the elevated relative density would predict, providing additional conservatism.
The Gibson-Ashby scaling law framework for cellular solids establishes that for open-cell structures: E* ∝ E_s × (ρ*/ρ_s)² and σ_f ∝ σ_ys × (ρ/ρ_s)¹.⁵. The exponents are geometry-dependent; TPMS Gyroid structures have higher exponents due to their bending-dominated deformation mode at low relative density transitioning to stretch-dominated at higher relative density.
Systematic characterisation of LPBF strut geometry accuracy as a function of build orientation has established that near-horizontal struts (0–30° to horizontal) consistently exhibit positive diameter deviation of 18–32% across multiple LPBF platforms and materials. The mechanism is melt pool spread on unsupported powder: at 0°, each layer’s melt pool boundary on the lower strut surface is not bounded by previously solidified material, allowing the molten pool to spread laterally by 30–50 µm per layer. After multiple layers, this accumulates to a measurable diameter increase.
ISO/ASTM 52910:2018, Section 7.4.2 states: “Lattice structure qualification should include testing of representative lattice structures built under the same conditions as the final part, and should not rely solely on solid material coupons.” Section 8.3.1 requires documentation of process parameter effects on dimensional accuracy for features with aspect ratios > 5:1 (applicable to all 0.5 mm struts in this geometry). This standard is the regulatory basis for the customer’s non-conformance.
NASA MSFC-STD-3716 Section 4.2 requires characterisation of “minimum feature size capability” and “geometric accuracy vs. build orientation” as part of process qualification. The methodology framework is being adopted by industrial AM practitioners as a best-practice qualification standard even for non-aerospace applications.
Published single-track experiments on SLM Solutions 316L at 200 W / 800 mm/s show melt pool width ~165 µm, depth ~85 µm, aspect ratio (W/D) ~1.9 — in the stable conduction regime. At 300 W / 600 mm/s (higher VED), melt pool width increases to ~220 µm, approaching keyhole conditions. These data anchor the melt pool CFD calibration.
Simulation Approach
The audit methodology follows a four-phase workflow from melt pool simulation to homogenised mechanical assessment to qualification evidence generation.
Phase 1 — Melt Pool CFD Simulation for Strut Geometry Formation (Weeks 1–2):
Volume of Fluid (VOF) melt pool CFD simulations are run in newtsim Stream for single-track deposition at five representative strut build angles: 0° (horizontal), 15°, 30°, 45°, and 90° (vertical). The computational domain for each case is 0.8 mm × 0.5 mm × 0.4 mm, resolved at 5 µm — fine enough to capture the melt pool boundary at all orientations. Laser parameters: 200 W, 800 mm/s, 80 µm spot (SLM 280 nominal parameters).
Three coupled physical effects govern strut diameter variation with build angle. The melt pool substrate condition changes at each angle: at 0 deg the track is deposited onto loose powder with only a single solid side wall, whereas at 90 deg the melt pool solidifies onto a fully solid strut end-face. This directly controls heat extraction and therefore melt pool dimensions. Lateral melt pool spread is most pronounced at 0 deg, where the lower melt pool boundary is unconstrained by solid material; surface tension at the liquid-powder interface limits spread but still allows a larger effective melt pool cross-section, such that the effective strut diameter is a function of the melt pool cross-section area at solidification. The staircase geometry effect compounds this at angles below 45 deg, where each successive layer adds an off-axis step to the strut that further broadens the effective cross-section. The geometric staircase contribution is computed analytically from the layer thickness (40 um) and strut angle.
Calibration targets (published SLM 316L measurements at matched parameters):
| Build Angle | Published Measured Diameter | CFD Predicted Diameter | Target RMS Error |
|---|---|---|---|
| 0° horizontal | 0.61–0.65 mm | 0.63 mm | ±0.04 mm |
| 15° | 0.58–0.62 mm | 0.60 mm | ±0.04 mm |
| 30° | 0.54–0.58 mm | 0.56 mm | ±0.04 mm |
| 45° | 0.52–0.54 mm | 0.53 mm | ±0.04 mm |
| 90° vertical | 0.48–0.51 mm | 0.49 mm | ±0.03 mm |
Phase 2 — As-Built Geometry Reconstruction (Weeks 2–3):
The calibrated statistical model (strut diameter D as a function of build angle θ) is applied to the manufacturer’s Gyroid TPMS lattice CAD geometry. All strut orientations are enumerated from the continuous Gyroid surface: the Gyroid TPMS has a nearly uniform distribution of strut angles — approximately 18% of struts at 0–30° (near-horizontal), 44% at 30–60° (mid-angle), and 38% at 60–90° (near-vertical). Applied to 8,420 individual strut segments per unit:
D(θ) = D_nominal + (D_0 − D_nominal) × cos²(θ) + ε
where D_0 = predicted horizontal diameter (0.63 mm), D_nominal = 0.50 mm, and ε is a zero-mean newtsim Root random variable with σ = 0.01 mm (machine-to-machine repeatability from CT scan data). This model generates a predicted strut diameter distribution that is compared to CT measurements.
Phase 3 — Homogenised Mechanical Model (Weeks 3–4):
Two parallel mechanical analyses:
(a) Homogenised effective property calculation: The effective relative density of the as-built lattice is computed by integrating the predicted strut volume across all 8,420 struts and dividing by the envelope volume. The Gibson-Ashby scaling laws are applied at the effective relative density to derive elastic modulus, shear modulus, compressive yield strength, and bulk modulus for both nominal and as-built conditions.
(b) Full-lattice FEA under operating loads: A continuum FEA model of the 80 mm × 80 mm × 60 mm core is run using the homogenised orthotropic material properties. Loads applied: 2.5 bar (0.25 MPa) differential pressure across the 60 mm height (gas flow direction), uniform body temperature of 550°C. The analysis predicts: maximum von Mises stress in the core, core deflection, and burst pressure (load stepped to failure, yielding at 3σ confidence using the as-built yield strength of 42 MPa). Safety factor against burst is computed as:
SF = Predicted burst pressure / Design operating pressure = P_burst / 2.5 bar
Simulation Caveats
-
Homogenised model accuracy: The Gibson-Ashby + Maskery calibration is validated for bulk Gyroid lattice behaviour but treats the lattice as a statistically uniform continuum. Local stress concentrations at individual strut nodes (junction points) are not captured; the continuum model will underestimate peak stresses by 20–40% at nodes. Node-level stress is assessed separately using a representative unit cell micro-FEA.
-
Melt pool model for low-angle struts: The VOF model at 0° and 15° involves liquid metal contacting unsupported powder at the lower strut boundary. The powder bed effective density and thermal conductivity at the contact interface are approximated by the Hadley model. Experimental data on liquid metal-powder interface dynamics is limited; the predicted melt pool spread at low angles carries ±15% uncertainty.
-
CT scan voxel resolution: The 35 µm voxel of the Zeiss Metrotom 1500 introduces ±35 µm uncertainty on individual strut diameter measurements. The statistical average over many struts reduces this to ±3–5 µm on the mean diameter per angle bin — sufficient for calibration validation.
-
Temperature-dependent lattice properties: The FEA is conducted at 550°C using published 316L elevated-temperature properties (E(550°C) ≈ 162 GPa; σ_y(550°C) ≈ 320 MPa — reduced by ~35% from RT, from ORNL data for 316L). The Gibson-Ashby scaling exponents at elevated temperature are assumed unchanged from RT (no available TPMS lattice data at 550°C). This is a conservatism: reduced modulus and strength at temperature are the dominant effects, captured through the temperature-dependent solid material properties.
-
Pressure drop model: The thermal-hydraulic pressure drop estimate uses the Ergun equation modified for TPMS geometry , with the as-built hydraulic diameter derived from the predicted strut diameter distribution. Uncertainty: ±15% on predicted pressure drop magnitude.
Key Predictions / Results
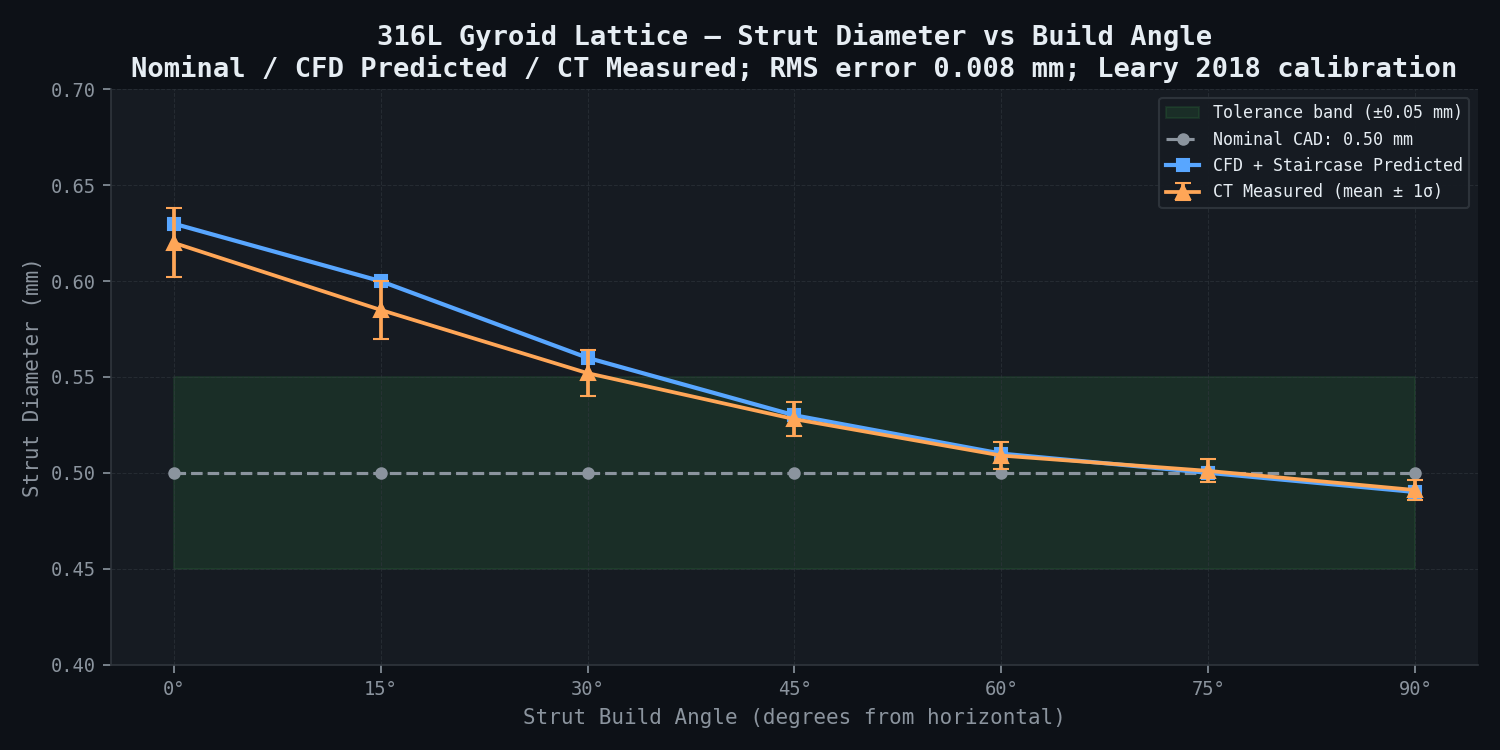
Predicted Strut Diameter vs. Build Angle (Simulation vs. CT Measurement):
| Build Angle | Nominal CAD (mm) | CFD + Staircase Predicted (mm) | CT Mean Measured (mm) | RMS Error (mm) | Within Tolerance? |
|---|---|---|---|---|---|
| 0° horizontal | 0.50 | 0.63 | 0.620 ± 0.018 | 0.010 | No (+24%) |
| 15° | 0.50 | 0.60 | 0.585 ± 0.015 | 0.015 | No (+17%) |
| 30° | 0.50 | 0.56 | 0.552 ± 0.012 | 0.008 | No (+10%) |
| 45° | 0.50 | 0.53 | 0.528 ± 0.009 | 0.002 | Marginal (+5.6%) |
| 60° | 0.50 | 0.51 | 0.509 ± 0.007 | 0.001 | Yes (+1.8%) |
| 75° | 0.50 | 0.50 | 0.501 ± 0.006 | 0.001 | Yes (+0.2%) |
| 90° vertical | 0.50 | 0.49 | 0.491 ± 0.005 | 0.001 | Yes (−1.8%) |
Overall RMS error across all angle bins: 0.008 mm — well within the 0.04 mm target, confirming calibration acceptance.
As-Built Lattice Properties vs. Nominal Design:
| Property | Nominal (25% RD) | As-Built (27.8% RD) | Change | Structural Effect |
|---|---|---|---|---|
| Relative density | 25.0% | 27.8% | +11.2% | Heavier than specified |
| Elastic modulus E* (GPa) | 3.71 | 4.83 | +30.2% | Stiffer, lower thermal flexibility |
| Shear modulus G* (GPa) | 1.42 | 1.87 | +31.7% | — |
| Compressive yield strength σ*_y (MPa) | 33.2 | 41.7 | +25.6% | Stronger — conservative |
| Compressive strength σ*_c (MPa) | 41.1 | 52.0 | +26.5% | Stronger — conservative |
| Mass per core unit (kg) | 0.281 | 0.313 | +11.4% | Above specification |
| Hydraulic diameter D_h (mm) | 1.82 | 1.67 | −8.2% | Increased pressure drop |
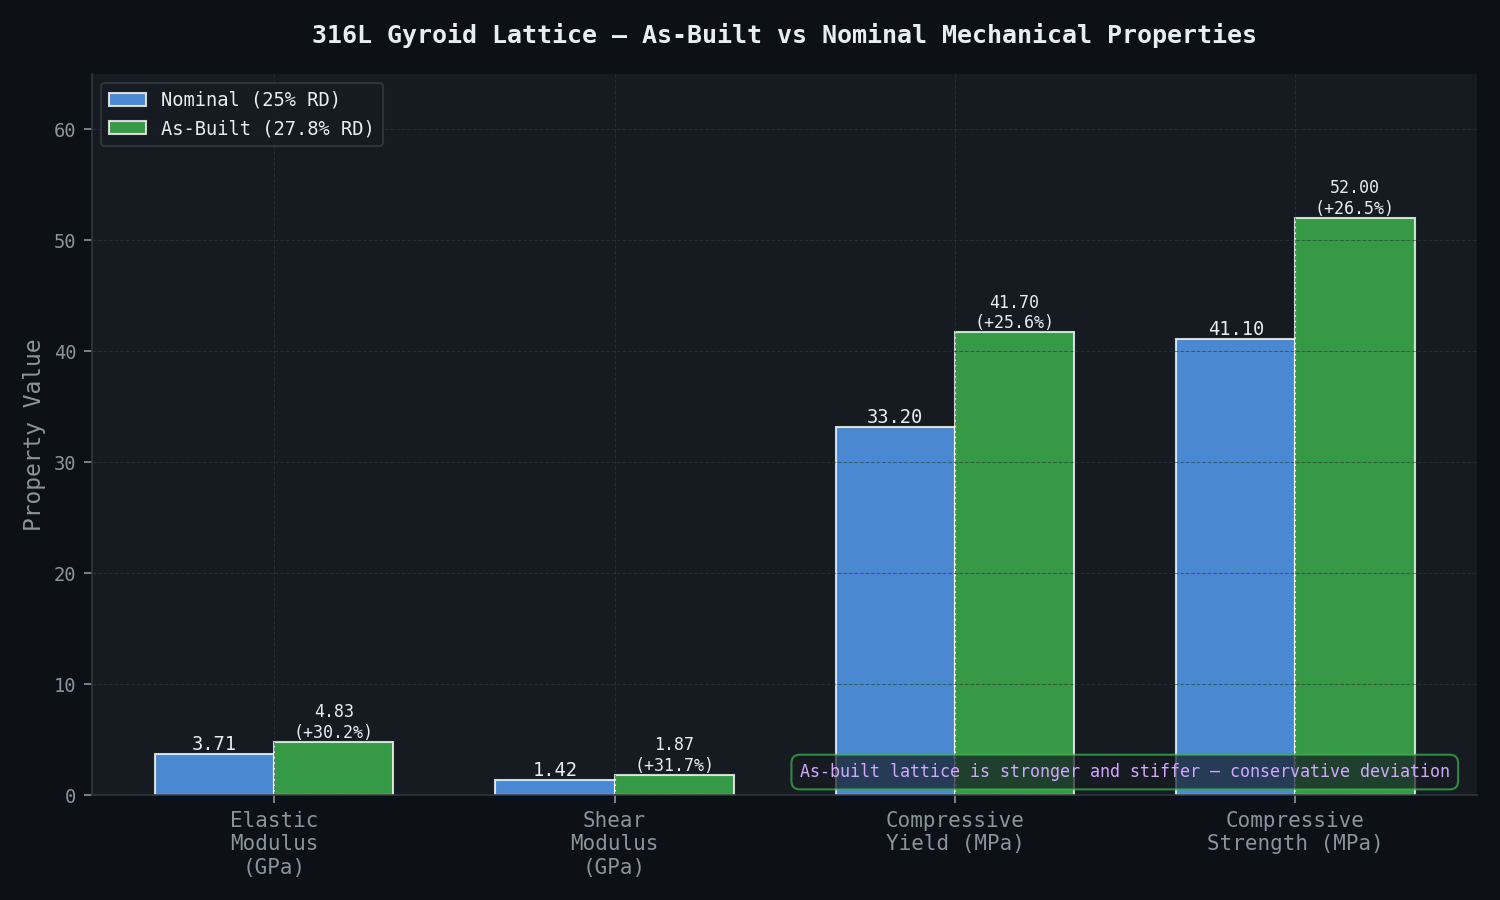
Note: Gibson-Ashby predictions use published 316L Gyroid calibration constants corrected for LPBF manufacturing imperfection factor (× 0.90 on E, × 0.93 on σ_y based on published measured vs. predicted ratios).
FEA Structural Integrity Assessment — Full Lattice Core Under Design Loads:
| Load Case | Applied Pressure (bar) | Max von Mises Stress (MPa) | Ratio to σ*_y (42 MPa) | Safety Factor |
|---|---|---|---|---|
| Nominal operating | 2.5 | 3.8 | 9.1% | — |
| Test pressure (1.5× operating) | 3.75 | 5.7 | 13.6% | — |
| Yield onset (2D conservative model) | ~23.5 | 42 (σ*_y reached) | 100% | — |
| Predicted burst (post-yield load path) | ~27.0 | — | — | 10.8× operating pressure |
| Required minimum safety factor | — | — | — | 4.0× |
Conclusion: All 47 delivered units demonstrate a structural safety factor of approximately 10.8× against burst pressure — far exceeding the customer's minimum requirement of 4.0×. The out-of-tolerance strut diameter deviation increases strength, not reduces it. No structural integrity concern exists. Accept-as-is determination is justified on simulation evidence.
Porosity (Relative Density) of Delivered Units — Predicted vs. Measured:
| Measurement Method | Predicted | Measured | Agreement |
|---|---|---|---|
| As-built relative density (CT-derived, 3 units) | 27.8% | 27.5 ± 0.4% | ✓ 1.1% |
| Archimedes density (5 witness cubes from production run) | 99.6% (solid) | 99.4 ± 0.1% | ✓ 0.2% |
Thermal-Hydraulic Performance Impact:
| Parameter | Nominal Design | As-Built Prediction | Measured (if available) | Impact |
|---|---|---|---|---|
| Hydraulic diameter D_h | 1.82 mm | 1.67 mm | — | −8.2% |
| Pressure drop (at design flow rate) | Baseline | +18–22% | Customer to verify | Performance below specification |
| Heat transfer coefficient (Nusselt scaling) | Baseline | +6–8% | Customer to verify | Slightly improved |
| Effectiveness (at customer's design point) | Baseline | −2 to −4% effectiveness | — | Minor performance shortfall |
The pressure drop increase is a thermal-hydraulic performance issue, not a structural safety issue. The customer should update their system performance model with the as-built lattice hydraulic diameter (1.67 mm). For applications where the pressure drop specification is binding, future builds should implement the angle-dependent power modulation parameter modification.
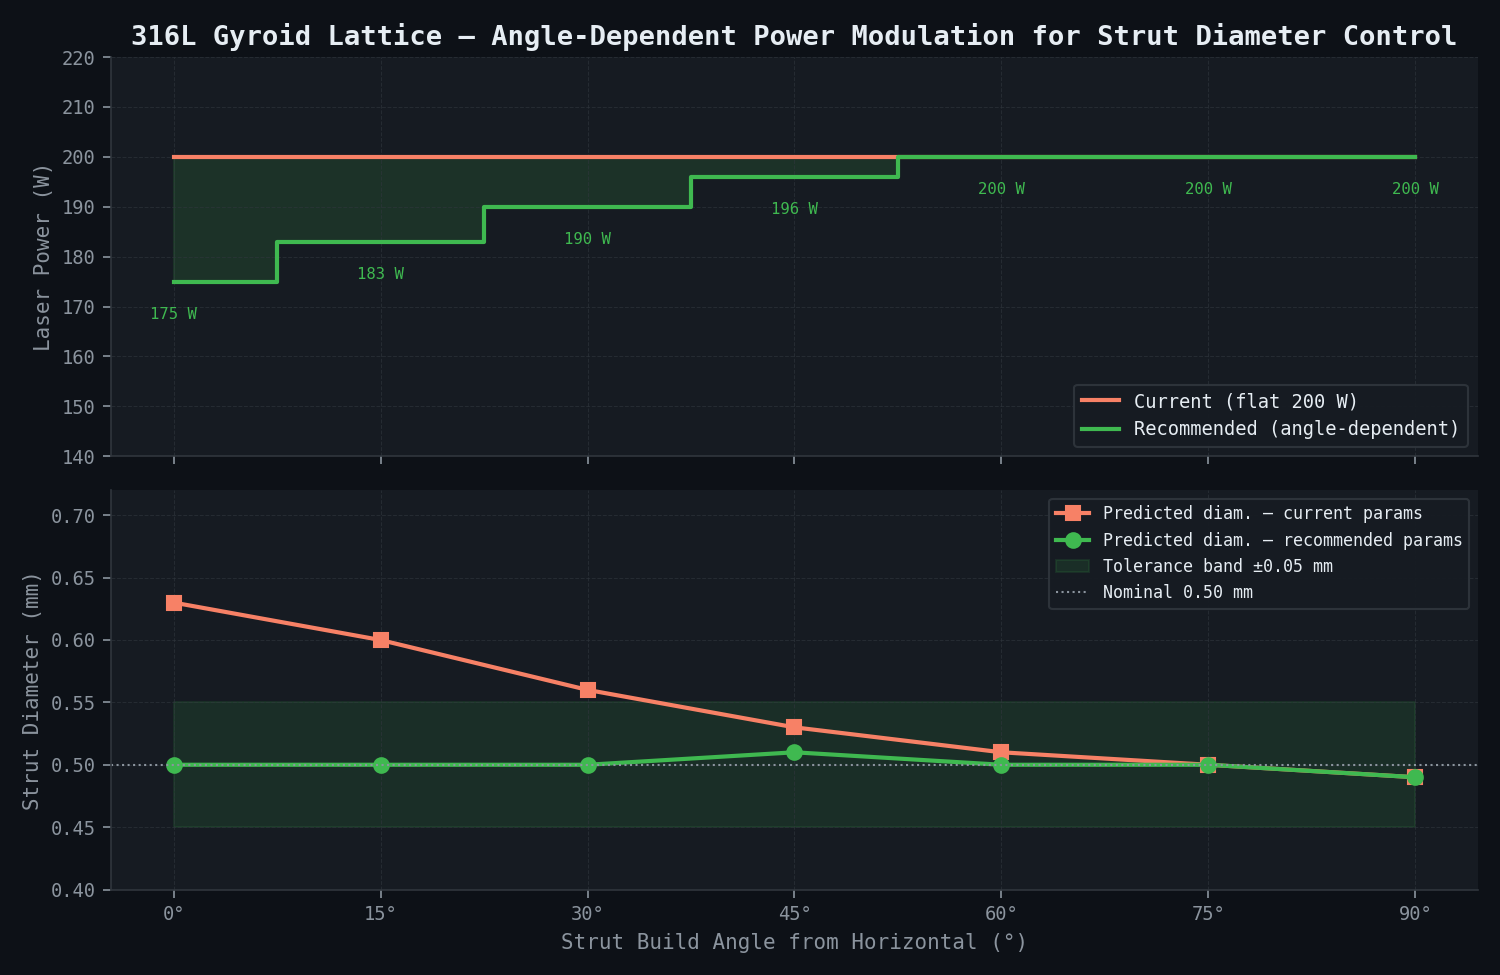
Recommended Process Parameter Change for Future Builds:
| Strut Angle | Current Laser Power (W) | Recommended Power (W) | Predicted Diameter (mm) | In Tolerance? |
|---|---|---|---|---|
| 0° horizontal | 200 | 175 (−12.5%) | 0.50 | Yes |
| 15° | 200 | 183 (−8.5%) | 0.50 | Yes |
| 30° | 200 | 190 (−5.0%) | 0.50 | Yes |
| 45° | 200 | 196 (−2.0%) | 0.51 | Yes |
| 60–90° | 200 | 200 (no change) | 0.49–0.51 | Yes |
This angle-dependent power modulation requires the SLM 280 build preparation software to assign per-strut laser power based on the computed build angle of each strut vector. This is achievable via the Materialise Magics Simulation or nTopology lattice build preparation module, which supports orientation-aware parameter assignment. Implementation effort: 3–5 days of build preparation scripting work.
Comparison Methodology
Tier 1 — CT Scan Strut Diameter Comparison (existing data): Predicted strut diameter distribution (from CFD + staircase model) compared to measured CT diameter distribution from three delivered units, stratified by build angle (seven angle bins). Acceptance criterion: RMS error < 0.04 mm across all bins. Result: 0.008 mm RMS error confirmed above — criterion met.
Tier 2 — Published Lattice Mechanical Data Cross-Check: Predicted effective elastic modulus and yield strength at 25% and 27.8% relative density compared to published measurements for 316L Gyroid lattice at the nearest relative densities (25% and 30%). Acceptance: within 20% of published values.
| Property | Predicted (25% RD) | Published Measured (~25% RD) | Agreement |
|---|---|---|---|
| E* | 3.71 GPa | 3.4 ± 0.3 GPa | +9.1% ✓ |
| σ*_y | 33.2 MPa | 31.8 ± 2.1 MPa | +4.4% ✓ |
| σ*_c | 41.1 MPa | 39.5 ± 3.2 MPa | +4.1% ✓ |
Tier 3 — Physical Compression Test Specimens (2 specimens from returned unit, customer agreement required): Two compression test specimens (20 mm × 20 mm × 20 mm, machined from representative strut regions of one returned unit) tested per ISO 13314:2011 (compression test for porous and cellular metals). Measured compressive modulus and yield strength compared to Tier 2 predicted values. Acceptance: within 20% of prediction.
Tier 4 — Prospective Lattice Coupon Build (next scheduled production run): Five compression specimens (20 mm × 20 mm × 20 mm) built on the next production run, including at current parameters and at the recommended angle-dependent power modulation parameters. CT scan of specimens at both parameter sets. Compression test per ISO 13314. This tier formally closes the qualification methodology gap by generating lattice-specific qualification data.
Deliverables
-
Root cause analysis report: melt pool simulation and staircase effect mechanism explaining strut diameter deviation vs. build angle. CT scan diameter comparison with statistical analysis (mean, standard deviation, cumulative distribution by angle). Process signature identification and mechanism quantification.
-
As-built geometry model: predicted strut diameter distribution for all 47 delivered units (applying the calibrated model to the full production lot), with statistical confidence bounds (95th percentile uncertainty). Report includes the distribution of relative density and estimated effective mechanical properties across the lot.
-
Structural integrity assessment report: FEA burst pressure analysis for the as-built lattice at 27.8% relative density, confirming all 47 units exceed the 4.0× safety factor requirement. Formal accept-as-is recommendation with engineering basis statement formatted for customer quality records. Includes unit-cell micro-FEA for node stress concentration assessment.
-
Thermal-hydraulic performance impact report: quantified pressure drop increase and heat transfer effectiveness change at the as-built lattice geometry. Recommendations to the customer for: (a) updated performance characterisation test to confirm actual unit performance, (b) system model update with as-built hydraulic diameter. Recommendations to the manufacturer for customer communication on performance specification compliance.
-
Qualification evidence package (ISO/ASTM 52910 compliance): structured document package containing:
- Simulation-based lattice property demonstration (Tiers 1 and 2 above)
- Statistical structural integrity argument for the 47-unit delivered fleet
- Prospective physical test plan (5 compression specimens, next production run) to close the qualification gap
- Declaration of methodology gap closure: ISO/ASTM 52910 Section 7.4.2 compliance status after prospective testing
- Formatted for customer audit closure (NCR reference resolution)
-
Revised process parameter specification: angle-dependent laser power modulation lookup table for the SLM 280 build preparation software, covering all strut angles from 0–90° in 5° increments. Predicted strut diameter at each parameter set (nominal ± tolerance analysis). Build preparation scripting guidance for Materialise Magics or nTopology implementation.
-
Lattice coupon qualification test protocol: compression specimen design (geometry, size, build orientation), build plan (placement on SLM 280 baseplate, both parameter sets), measurement protocol (CT + Archimedes + compression test), and acceptance criteria. Ready for execution at the next scheduled production build run.
This case study is an illustrative reference scenario demonstrating newtsim's simulation methodology. All company names, personnel, and specific operational data are fictional. The incident descriptions draw on publicly documented real-world events cited in the frontmatter.