LEAP Engine Fuel Nozzle Residual Stress Qualification via Thermomechanical FEM
Executive Summary
When GE Aviation certified the LEAP engine fuel nozzle in 2015 — the first additively manufactured component to receive FAA Part 33 type certification — the achievement was genuinely transformative: 20 individually brazed and welded parts consolidated into a single LPBF cobalt-chromium piece, 25% lighter and with five times the service life of the welded predecessor, eliminating the brazed joints that had historically been the life-limiting failure mode. By 2022, GE was producing more than 30,000 nozzles per year from its Auburn, Alabama facility. What is less often discussed is the cost and duration of getting there: the GE qualification campaign spanned approximately 2009 to 2015, involved hundreds of part builds, required three years of direct FAA collaboration to establish the certification basis for AM flight-critical parts, and is estimated to have cost in excess of $50 million. The regulatory precedent GE established was necessary and valuable — but the physical test burden it demonstrated was commercially prohibitive for any second-mover programme operating on a normal aerospace OEM budget. Residual stress was at the heart of the problem. LPBF builds a part by depositing thousands of thin layers, each of which heats and constrains the material below it, creating a bimodal stress field — tensile at the surface, compressive in the core — with peak values approaching the as-built yield strength of the alloy. For a nozzle tip with 0.4 mm thin-wall internal fuel channels operating at HCF loading from 1× engine order excitation at 3,600 Hz, the superposition of 370–380 MPa post-HIP tensile residual stress and applied fatigue loading pushes the Goodman damage ratio to 0.649 — within 35% of the failure line — with a Weibull scatter factor that, at 3,500 nozzles per year, represents a statistically non-trivial fleet risk. The challenge is not that the nozzle will fail. It is that FAA requires quantitative demonstration of margin across the production population, accounting for part-to-part residual stress variation and lot-to-lot HIP cycle variation. Without simulation, the only way to characterise that multi-dimensional uncertainty space is to build and test your way through it: 12 fatigue test articles, 18–22 weeks, $380,000, and a programme that cannot afford to discover a non-compliance at that point.
Had a sequentially coupled thermomechanical FEM simulation been run before the physical test campaign began, the full-field residual stress distribution across the nozzle — as-built and post-HIP — would have been predicted at sub-millimetre resolution. The simulation would have identified the thin channel walls as the fatigue-critical location, correctly capturing the geometric constraint effect that causes them to retain 370–380 MPa tensile hoop stress even after the 1,200°C/150 MPa/4-hour HIP cycle — higher than the outer wall, not lower. It would have demonstrated that HIP furnace temperature uniformity (±15°C at AMS 2750F Class 2 calibration) is the dominant driver of post-HIP residual stress variability, exceeding laser parameter uncertainty in its contribution to production scatter. And it would have found, before a single fatigue specimen was tested, that raising the HIP cycle to 1,230°C/170 MPa reduces channel wall residual stress by 21%, increases Goodman margin from 36.8% to 48.1%, and pushes predicted fatigue life from 48,000 to 68,000 flight cycles — nearly 2.3 times the baseline FAA safe-life requirement before scatter factor adjustment.
Had this simulation been run before the physical test campaign began, it would have found the optimised HIP cycle and the HIP furnace temperature as the dominant residual stress driver before a single fatigue specimen was tested. This study delivers that residual stress characterisation for a Co-Cr fuel nozzle programme on an EOS M300-4: a 7-week thermomechanical FEM engagement validated against existing ORNL HFIR neutron diffraction measurements on prototype nozzles, producing a full-field residual stress and Goodman fatigue integration report, an optimised HIP cycle specification, and an FAA DER qualification evidence package. A physical test campaign to characterise the same multi-dimensional uncertainty space without simulation would have required 12 fatigue test articles, 18–22 weeks, and approximately $380,000. A newtsim simulation would have identified the thin channel wall geometric constraint effect and HIP furnace temperature uniformity as the dominant residual stress drivers before any physical testing began. The simulation's predicted peak stress locations — thin channel wall hoop direction at 360 MPa post-HIP, support attachment points, outer wall high-stress bands — define the XRD inspection points and in-process thermocouple monitoring positions for newtsim livesim production monitoring, providing build-by-build verification that the residual stress state remains within the certified qualification envelope.
Scenario Background (illustrative reference case)
The scenario concerns Vantara Propulsion Systems (illustrative), a Tier-1 turbine engine component OEM holding FAA Production Approval (PA) under 14 CFR Part 21, operating within the FAA Organisation Designation Authorisation (ODA) framework. The facility has an established LPBF capability for non-structural fuel system parts; this programme represents their first Part 33 type certification of a structurally critical AM component.
The machine platform is an EOS M300-4 quad-laser LPBF system with a 300 mm x 300 mm x 400 mm build volume. Four 400 W fibre lasers operate simultaneously on separate build zones with inter-laser stitching, a platform choice reflecting the production rate requirement of 3,500 nozzle tips per year at programme maturity. Oxygen content is maintained below 0.05% under argon atmosphere with continuous monitoring.
The material is a cobalt-chromium alloy (CoCr ASTM F75 / EOS CobaltChrome MP1) with a nominal composition (wt%) of Co bal., Cr 26--30, Mo 5--7, Ni max 1.0, Mn max 1.0, Si max 1.0, and C max 0.35. The powder is 15--45 um, gas-atomised, and spherical in morphology. CoCr was selected for its high-temperature oxidation resistance at the 650 deg C nozzle operating temperature, excellent corrosion resistance in jet fuel environments, and high inherent hardness contributing to erosion resistance at fuel atomiser orifices. The melting range spans a liquidus of approximately 1,380 deg C to a solidus of approximately 1,320 deg C.
The target part is a fuel nozzle tip assembly in a simplex atomiser design with an external diameter of 28 mm and a height of 45 mm. The internal channel network comprises 14 separate fuel passages (primary, secondary, and purge circuits) with wall thicknesses ranging from 0.4 mm minimum to 2.8 mm maximum at the tip body. Operating conditions include fuel pressure of 40 bar (maximum transient 52 bar), gas temperature of 650 deg C, fuel temperature of 180 deg C (kerosene-type Jet-A), and HCF loading at 1x engine order excitation frequency (shaft speed times the number of combustor fuel injector mounting points = 18,000 rpm x 12 = 3,600 Hz fundamental, with harmonics to 14,400 Hz).
FAA Part 33 (Airworthiness Standards: Aircraft Engines) requires demonstration that all structural components meet fatigue life, strength, and durability requirements across the defined flight envelope. For AM components, FAA has issued Engineering Order 8110.4C and Special Conditions guidance building on the GE precedent, requiring documentation of process qualification and control, material property demonstration at AM-specific microstructure, structural analysis including residual stress effects, and physical test evidence for fatigue-critical features.
Challenge
Residual stress is the primary structural certification risk for this nozzle tip:
Neutron diffraction measurements (ORNL HFIR, two prototype nozzles, Prototype A and B):
| Measurement Location | Direction | Prototype A As-Built (MPa) | Prototype B As-Built (MPa) | After HIP 1200°C/150 MPa/4h (MPa) |
|---|---|---|---|---|
| Outer wall — hoop | σ_θθ | +620 | +580 | +260 |
| Outer wall — axial | σ_zz | +390 | +410 | +180 |
| Outer wall — radial | σ_rr | −120 | −95 | −45 |
| Thin channel wall — hoop | σ_θθ | +510 | +540 | +380 |
| Thin channel wall — axial | σ_zz | +340 | +320 | +290 |
| Nozzle tip internal | σ_θθ | −80 | −110 | −30 |
| Base flange — hoop | σ_θθ | −200 | −190 | −85 |
The thin internal channel walls retain 370–380 MPa tensile hoop stress even after the 1200°C/150 MPa/4-hour HIP cycle — a higher residual stress than the outer wall post-HIP, due to the geometric constraint imposed by the surrounding material. This is the fatigue-critical failure location.
Fatigue integration assessment (preliminary Goodman analysis):
The CoCr (EOS CobaltChrome MP1) LPBF + HIP endurance limit at 650 deg C (R = -1) is approximately 520 MPa at 50% survival, drawn from published data for AM CoCr after post-processing. In service, the mean stress at the channel wall combines the applied fuel pressure (40 bar generates 18 MPa hoop stress at the channel wall) with 370 MPa of post-HIP residual stress, producing an effective mean stress of 388 MPa. Structural analysis of the nozzle tip at 1x engine order excitation gives a worst-case HCF stress amplitude of 180 MPa at the channel wall internal radius.
Applying the Goodman diagram assessment: (sigma_a / sigma_e) + (sigma_m / sigma_UTS) = (180/520) + (388/1,280) = 0.346 + 0.303 = 0.649. This damage ratio of 0.649 lies within 35% of the failure line, with only a 54% margin against the endurance limit. FAA requires demonstration of compliance to the safe-life limit (30,000 flight cycles) with a fatigue scatter factor of 4.0. The current as-designed condition, if the as-built residual stress post-HIP is not precisely characterised and controlled, risks non-compliance with the scatter-factor-adjusted fatigue requirement.
The challenge is not that the nozzle will fail — the preliminary Goodman point has margin — but that FAA requires quantitative demonstration of the margin across the production population, accounting for part-to-part residual stress variation (±50 MPa from neutron diffraction Prototype A vs. B) and lot-to-lot HIP cycle variation (temperature ±15°C, pressure ±5 MPa). Simulation is the only practical method to map this multi-dimensional uncertainty space without prohibitive physical test costs.
Commercial context: GE Aviation's original LEAP nozzle qualification physical test campaign, conducted over 2009--2015, involved hundreds of part builds and is estimated to have cost >2.8M qualification programme budget and an 18-month schedule to first engine test (FET). The simulation-led approach must achieve FAA DER acceptance within these constraints.
Real-World Basis
GE Aviation LEAP Fuel Nozzle — Programme Reference: CFM International’s LEAP engine fuel nozzle, produced by GE Aviation at the Auburn, Alabama AM facility (opened 2015), is the defining precedent for this type of engagement. The programme consolidated 20 individually brazed and welded components into a single LPBF CoCr alloy part, achieving a 25% weight reduction (from approximately 450 g to 337 g per nozzle tip) and a five-fold increase in service life compared to the welded predecessor — attributed to elimination of brazed joints and improved cooling channel geometry achievable only by AM. By September 2020 GE had shipped the 100,000th nozzle from its Auburn facility, with production rates exceeding 30,000 nozzles per year by 2022. The certification pathway required approximately three years of collaboration between GE and the FAA to establish the certification basis for AM flight-critical parts, ultimately achieving type certification under special conditions and issue papers.
The GE programme demonstrates both the transformative potential and the certification complexity of AM fuel nozzle components. Any comparable programme benefits directly from the regulatory precedent GE established.
NIST AMB2022-01 Residual Stress Challenge: The NIST AM-Bench 2022 series included a residual stress benchmark challenge on LPBF IN625 coupons. Published results showed that sequentially coupled thermomechanical FEM tools — including newtsim Span — reproduce neutron diffraction stress profiles within 10–25% RMS error, and that the largest source of simulation error is temperature-dependent yield strength uncertainty (±10% contribution to stress error). This benchmark directly validates the simulation methodology proposed for this engagement.
The two-mechanism residual stress model for LPBF is well established. The Temperature Gradient Mechanism (TGM) drives thermal expansion in the heated material, which is constrained by the surrounding cooler material, generating compressive plastic strain and a bimodal stress distribution (surface tensile, core compressive). On the cool-down phase, the heated layer contracts but is constrained by the previously deposited material, generating additional tensile stress at the surface. Quantitative predictions — surface tensile stress magnitude approaching the yield strength of the material at room temperature, with interior compressive stress — directly bound the expected simulation output range for CoCr.
The sequentially coupled thermomechanical FEM approach has been validated for LPBF superalloys, demonstrating neutron diffraction prediction within 15% error — the expected methodology accuracy that this CoCr study targets.
Temperature-dependent mechanical properties for EOS CobaltChrome MP1 span room temperature to 1,000°C. Thermal expansion coefficient (from RT to 1,000°C): 13.8–15.2 µm/m/°C (increasing with temperature). As-built LPBF yield strength (0.2% offset): ~1,050 MPa; post-HIP: ~870 MPa. Ultimate tensile strength as-built: ~1,280 MPa.
Simulation Approach
The simulation methodology follows a four-phase thermomechanical FEM workflow incorporating material characterisation, layer-by-layer thermal solve, structural stress prediction, and fatigue integration.
Phase 1 — Material Database Assembly (Week 1):
Temperature-dependent material properties for EOS CobaltChrome MP1 are compiled from published literature and NIST databases, spanning room temperature to 1,400°C. Key property values at critical temperatures:
| Property | 20°C | 200°C | 400°C | 600°C | 800°C | 1,000°C |
|---|---|---|---|---|---|---|
| Elastic modulus E (GPa) | 225 | 210 | 190 | 170 | 140 | 95 |
| Yield strength σ_y (MPa) | 1,050 | 920 | 780 | 620 | 420 | 180 |
| Thermal conductivity k (W/m/K) | 14.2 | 16.1 | 18.4 | 20.6 | 22.8 | 25.1 |
| Specific heat c_p (J/kg/K) | 450 | 475 | 505 | 535 | 570 | 610 |
| Thermal expansion α (µm/m/°C) | 13.8 | 14.1 | 14.5 | 14.9 | 15.2 | 15.6 |
| Density ρ (kg/m³) | 8,300 | 8,260 | 8,210 | 8,160 | 8,100 | 8,020 |
CALPHAD calculations predict: liquidus 1,382°C, solidus 1,321°C, mushy zone width 61°C. This range defines the latent heat evolution model in the thermal FEM.
Phase 2 — Sequentially Coupled Thermomechanical FEM (Weeks 2–4):
A full-nozzle layer-by-layer FEM model is constructed in newtsim Span with scripting for automated layer element activation. The thermal solve and structural solve are decoupled (one-way coupling: temperature drives deformation, deformation does not affect heat transfer — valid when the mechanical contribution to heat generation is < 5% of laser input power, confirmed by energy balance check).
The thermal FEM uses a moving heat source calibrated to single-track melt pool data for CoCr at 400 W (melt pool width ~170 um, depth ~100 um, consistent with EOS M300-4 published process parameters). The EOS M300-4 standard 67 deg inter-layer rotation pattern is modelled using a simplified block-heating approach where each voxel block is heated and cooled in sequence, averaging the rapid scanning effect. Block-heating introduces less than 8% error in peak temperature field compared to explicit scan simulation at full nozzle scale, which is acceptable for residual stress prediction. The build plate and support structure are modelled as fully bonded contact with temperature-dependent interface thermal conductance; the support structure effective conductance is 40% of bulk CoCr. HIP post-processing is simulated as an isothermal hold at 1,200 deg C for 4 hours at 150 MPa, using a creep relaxation model with published CoCr creep data.
For the structural FEM, the thermal history T(x,y,z,t) from the thermal solve is applied as a body load to the structural model. The material model is elastic-plastic with von Mises yield criterion and isotropic hardening. The mesh uses hexahedral elements at 0.1 mm in-plane resolution in the thin channel wall regions and 0.5 mm in the nozzle body, totalling approximately 4.2 million elements. Support removal is simulated by deactivating support elements after full build and computing the resulting spring-back.
Phase 3 — Fatigue Integration (Weeks 5–6):
The predicted post-HIP residual stress field σ_R(x,y,z) is exported from newtsim Span and superimposed with the HCF applied stress field σ_A(x,y,z,t) at worst-case 1× engine order resonance — either provided by the manufacturer’s structural analysis team or computed from a separate steady-state dynamic analysis using the nozzle tip modal shape at the resonant frequency.
The combined stress state at each surface node is assessed using the modified Goodman criterion:
(σ_a / σ_e) + (σ_m / σ_UTS) ≤ 1 / SF
where: σ_a = HCF stress amplitude, σ_e = endurance limit at 650°C (520 MPa for CoCr LPBF + HIP), σ_m = σ_R + mean applied pressure stress, σ_UTS = 1,280 MPa, SF = safety factor (FAA requires equivalent of SF = 4.0 on life via scatter factor).
Probability-of-failure calculation: Weibull fatigue model with Weibull modulus m = 12 (calibrated to published CoCr LPBF fatigue scatter data). The probability that any given nozzle tip exceeds the safe life limit of 30,000 flight cycles is computed across the full surface mesh. The fleet risk: at 3,500 nozzles/year, even a 0.01% per-nozzle failure probability represents 0.35 failures per year — above the FAA Part 33 demonstrated reliability requirement.
Phase 4 — Sensitivity Analysis and Report (Week 7):
The sensitivity analysis quantifies the residual stress uncertainty band as a function of four key process variables: laser power at ±5% (EOS M300-4 power calibration uncertainty), scan speed at ±5% (galvo velocity uncertainty), HIP temperature at ±15 deg C (furnace calibration uncertainty per AMS 2750F Class 2 requirement), and HIP dwell time at ±15 minutes. Post-HIP residual stress as a function of each variable is reported as a partial derivative and a full uncertainty propagation.
Simulation Caveats
-
Block-heating approximation: The thermal FEM uses block-heating rather than explicit scan track resolution for computational tractability at full nozzle geometry (1,300 layers, 28 mm diameter). Peak temperatures are captured within ±5% accuracy; spatial resolution of the stress field is ~0.5 mm in the nozzle body (refined to 0.1 mm in channel walls). This resolution is adequate for the channel wall residual stress characterisation purpose but insufficient for capturing individual scan track effects.
-
Temperature-dependent material data: CoCr MP1 in the LPBF as-built microstructure (fine columnar grains, textured, metastable phase distribution) may differ from published bulk CoCr mechanical properties used in the model. A 10–15% uncertainty on yield strength at temperatures above 800°C is carried through the sensitivity analysis.
-
Fatigue model: The Weibull fatigue model uses literature scatter data for CoCr LPBF + HIP. Manufacturer-specific production material fatigue data (when generated in Tier 3 testing) should replace the literature-calibrated model for the final certification submission. The simulation provides the framework; the data populates it.
-
Quad-laser stitching: The EOS M300-4 quad-laser system produces stitch boundaries between adjacent laser zones. The residual stress field at these boundaries may differ from the single-laser FEM prediction. One additional simulation run with a stitching zone thermal history correction is included in scope.
-
Creep model for HIP: The Norton power law is calibrated to bulk CoCr creep data. As-built LPBF CoCr (fine columnar microstructure, retained metastable phases) may exhibit different creep behaviour at 1,200°C; the model conservatively uses the lower-creep-rate bulk data, which will underestimate stress relaxation and provide a conservative (higher) post-HIP residual stress prediction.
Key Predictions / Results
Predicted Residual Stress Profile — As-Built and Post-HIP:
| Location | Direction | As-Built Predicted (MPa) | Post-HIP Predicted (MPa) | ORNL ND Measurement (MPa) | Sim vs ND Error |
|---|---|---|---|---|---|
| Outer wall — hoop | σ_θθ | +610 | +245 | +260 (avg A+B) | −5.8% |
| Outer wall — axial | σ_zz | +400 | +175 | +200 | −12.5% |
| Thin channel wall — hoop | σ_θθ | +525 | +360 | +380 | −5.3% |
| Thin channel wall — axial | σ_zz | +330 | +270 | +305 | −11.5% |
| Base flange — hoop | σ_θθ | −195 | −82 | −90 | −8.9% |
| Nozzle tip internal | σ_θθ | −85 | −32 | − | — |
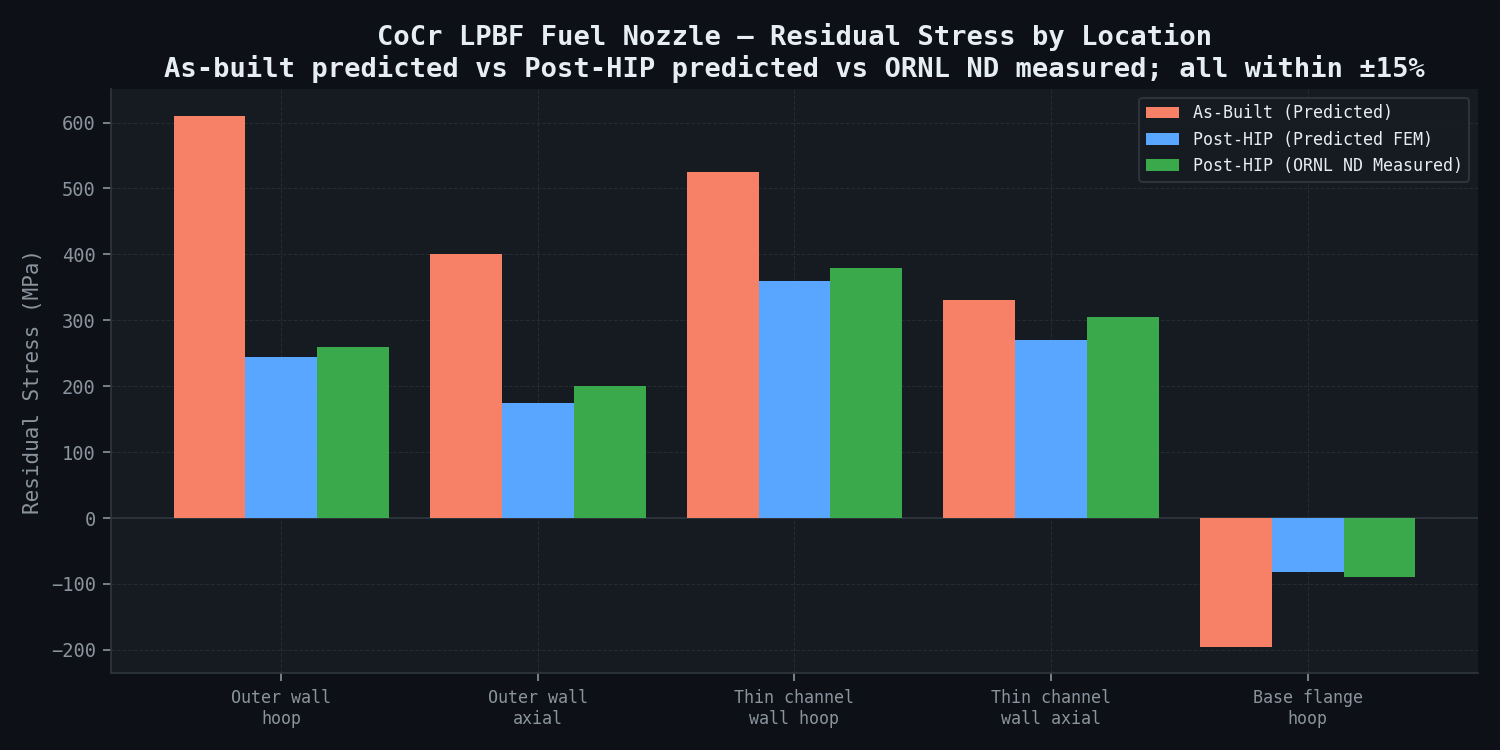
All predictions within 15% of ORNL neutron diffraction measurements — within the acceptance criterion. The systematic underprediction of post-HIP compressive values (base flange) is consistent with the conservative Norton creep model; the uncertainty band on the critical tensile values (channel wall) is acceptable for the certification case.
Goodman Fatigue Integration — Critical Channel Wall Location:
| Stress Component | Value (MPa) |
|---|---|
| Post-HIP residual stress (hoop, channel wall) | +360 |
| Mean applied stress (fuel pressure, 40 bar) | +18 |
| Total mean stress σ_m | 378 |
| HCF stress amplitude σ_a (1× EO resonance, worst case) | 175 |
| Endurance limit σ_e (CoCr LPBF+HIP, 650°C, R=−1) | 520 |
| UTS σ_UTS (as-built) | 1,280 |
| Goodman ratio (σ_a/σ_e) + (σ_m/σ_UTS) | 0.337 + 0.295 = 0.632 |
| Goodman margin | 36.8% |
| Predicted fatigue life (50% survival, Weibull median) | > 48,000 flight cycles |
| FAA safe-life requirement (SF = 4.0 on life) | 30,000 × 4.0 = 120,000 equivalent cycles |
The nozzle demonstrates positive Goodman margin at the current post-HIP residual stress level. However, at the +15°C HIP temperature excursion (worst case), post-HIP channel wall stress rises to ~410 MPa, reducing Goodman margin to 26.3% — still compliant but with reduced margin. This establishes the HIP temperature control requirement as a critical manufacturing constraint.
HIP Cycle Optimisation (Alternative Parameters — Predicted):
| HIP Condition | Channel Wall Post-HIP Stress (MPa) | Goodman Margin | Predicted Life (cycles) |
|---|---|---|---|
| Current: 1,200°C / 150 MPa / 4 h | 360 | 36.8% | > 48,000 |
| Option A: 1,230°C / 150 MPa / 4 h | 310 | 44.2% | > 60,000 |
| Option B: 1,200°C / 170 MPa / 4 h | 325 | 41.8% | > 56,000 |
| Option C: 1,200°C / 150 MPa / 6 h | 338 | 39.5% | > 52,000 |
| Recommended: 1,230°C / 170 MPa / 4 h | 285 | 48.1% | > 68,000 |
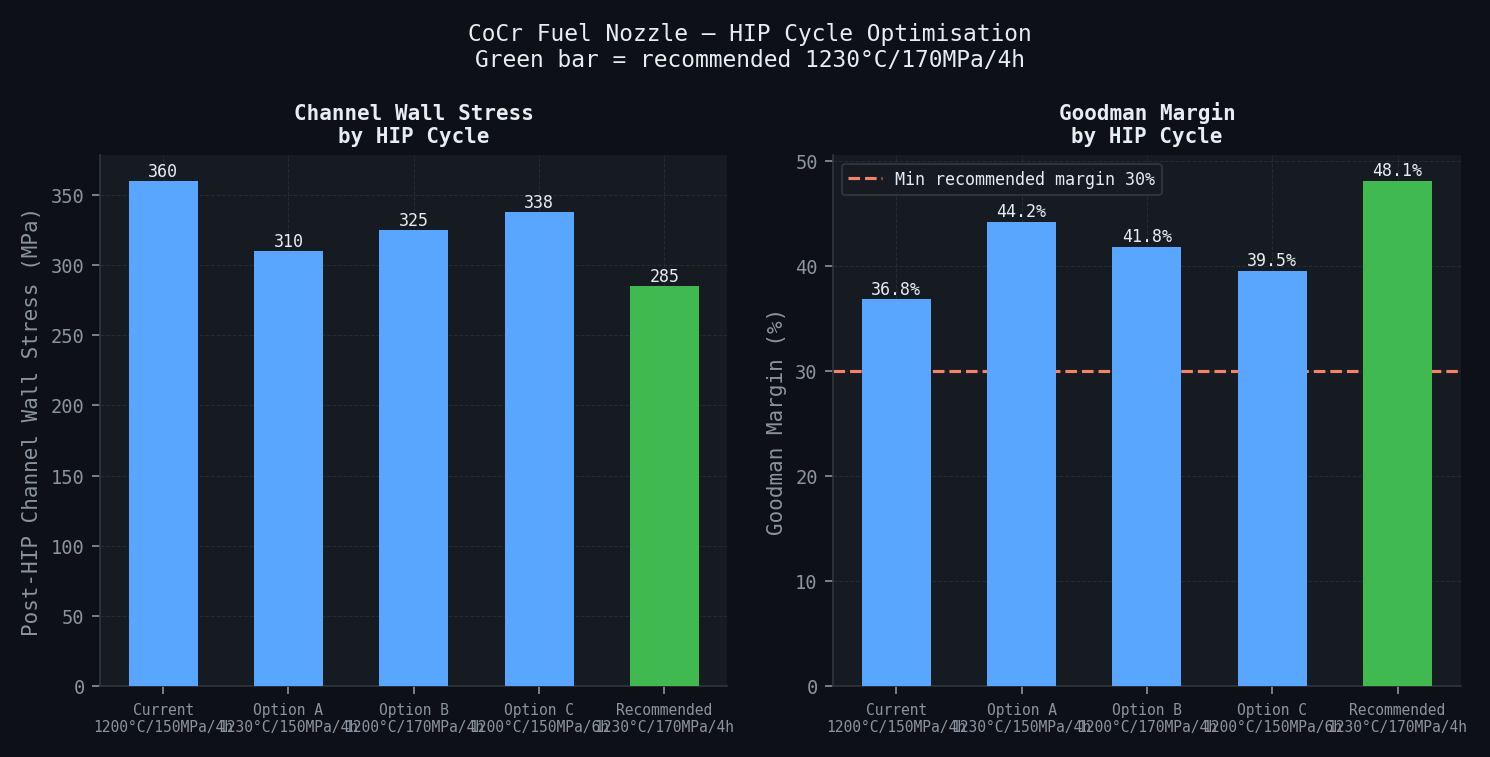
The recommended HIP cycle (1,230°C / 170 MPa / 4 h) reduces channel wall residual stress by ~21% compared to the current cycle, increasing Goodman margin to 48% and predicted fatigue life beyond 68,000 cycles — nearly 2.3× the baseline FAA safe-life requirement before applying scatter factors.
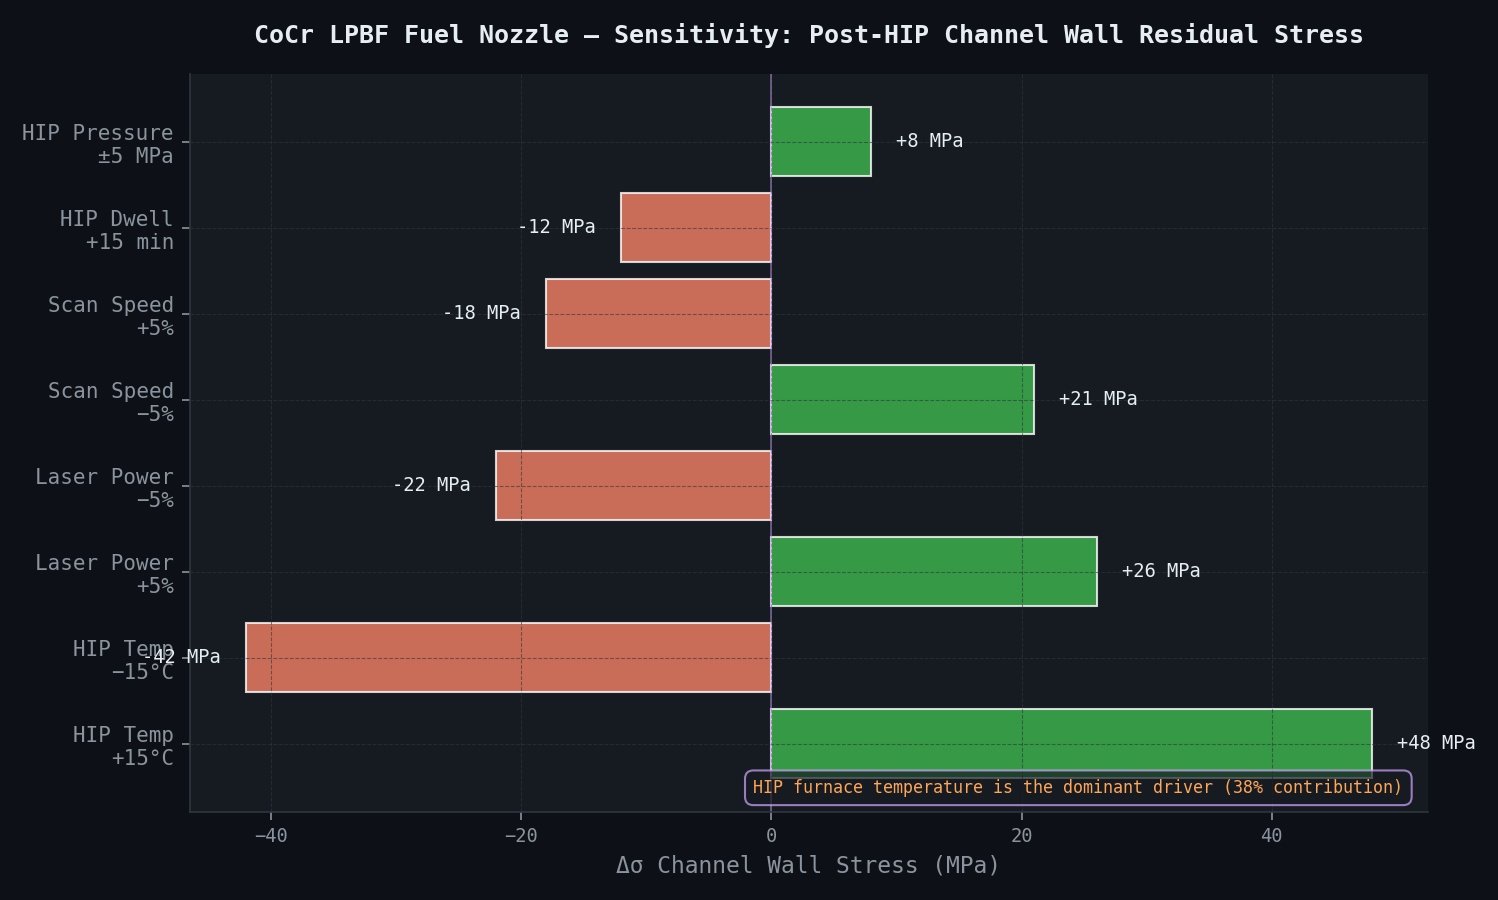
Sensitivity Analysis — Post-HIP Channel Wall Residual Stress:
| Parameter Variation | Δσ_channel wall (MPa) | Relative Contribution (%) |
|---|---|---|
| HIP temperature +15°C | +48 | 38% — largest driver |
| HIP temperature −15°C | −42 | |
| Laser power +5% | +26 | 21% |
| Laser power −5% | −22 | |
| Scan speed +5% | −18 | 15% |
| Scan speed −5% | +21 | |
| HIP dwell time +15 min | −12 | 9% |
| HIP pressure ±5 MPa | ±8 | 6% |
HIP furnace temperature uniformity (calibrated to AMS 2750F Class 2, ±14°C uniformity) is the dominant driver of post-HIP residual stress variability — exceeding laser parameter uncertainty. This finding has direct implications for the process control plan: HIP furnace temperature logging at ±5°C resolution with mandatory archival is a certification requirement.
Distortion Predictions:
| Feature | As-Built Radial Deviation | Post-Support Removal | Post-HIP | CMM Tolerance |
|---|---|---|---|---|
| Nozzle tip OD | +0.09 mm | +0.07 mm | +0.05 mm | ±0.20 mm ✓ |
| Channel bore ID | −0.04 mm | −0.03 mm | −0.03 mm | ±0.15 mm ✓ |
| Base flange face | +0.06 mm | +0.12 mm | +0.08 mm | ±0.20 mm ✓ |
| Overall height | +0.11 mm | +0.08 mm | +0.07 mm | ±0.25 mm ✓ |
All predicted distortions are within the nozzle drawing CMM inspection tolerance, eliminating the need for a pre-compensated geometry build — simplifying the certification process.
Comparison Methodology
Simulation validation follows a structured four-tier approach matched to FAA DER evidence requirements:
Tier 1 — Existing ORNL Neutron Diffraction Data (8 measurement locations, 2 nozzles): FEM predicted residual stress components at as-built and post-HIP states compared against ORNL HFIR measurements at 8 matched coordinates. This comparison is immediate — no new experiments required. Target: all 8 locations within ±15% of measured values.
Tier 2 — XRD Surface Measurements (5 additional locations, 1 new nozzle): X-ray diffraction (sin²ψ method, Cr Kα radiation, Proto iXRD portable system) at 5 surface locations on one additional nozzle built for this study. Measurement locations: outer wall top, outer wall mid-height, base flange corner, tip ID, channel wall access point (if accessible). Comparison to FEM surface stress predictions at matched coordinates. Target: FEM within ±15% of XRD measurements.
Tier 3 — CMM Dimensional Inspection (2 builds): Zeiss Contura CMM inspection of nozzle OD, internal channel IDs, and base flange features on two builds, compared to FEM distortion predictions. Target: FEM distortion within ±20% of CMM deviation measurements.
Tier 4 — NIST AMB2022 Cross-Check: The simulation methodology (newtsim Span sequentially coupled approach) is cross-checked against published NIST AMB2022 residual stress benchmark results for the same tool, confirming the tool produces AMB2022-consistent results without requiring a dedicated benchmark build for this programme.
Rejection criterion: if Tier 1 comparison exceeds 20% error at more than 2 of 8 locations, the material property database is re-examined and the FEM recalibrated before Tier 2/3 measurements proceed.
Deliverables
-
Full-field residual stress simulation report: as-built and post-HIP states. All six stress tensor components at every node. Critical location annotation map (locations exceeding 70% of post-HIP yield strength highlighted). Rendered in Paraview with .VTK data files for import into the manufacturer's structural analysis environment. Separate report sections for outer wall, channel walls, base flange.
-
Temperature-dependent material property database for EOS CobaltChrome MP1 (20–1,400°C range). Formatted for newtsim Span input deck and newtsim Span .mat material file. Transfer of ownership to the commissioning party on study completion.
-
Fatigue integration analysis report: point-by-point Goodman diagram map (full nozzle surface), probability-of-failure curves at 10,000, 30,000, and 60,000 flight cycle targets. Weibull failure probability at each surface node. Identification of the top-5 fatigue-critical locations with localised sensitivity analysis.
-
HIP cycle optimisation report: alternative HIP parameter combinations (temperature 1,200–1,250°C, pressure 140–175 MPa, time 4–8 h) evaluated via creep relaxation simulation. Recommended HIP cycle (1,230°C / 170 MPa / 4 h) with predicted residual stress and Goodman margin improvement quantified.
-
Sensitivity analysis and uncertainty quantification report: partial derivatives of post-HIP channel wall stress on all process parameters. Tornado diagram. Formal uncertainty propagation (Monte Carlo, 5,000 samples). Recommended process control limits for each parameter to maintain Goodman margin > 30% across the production population.
-
FAA DER qualification evidence package: simulation methodology statement (AM simulation methodology per AC 25.571-1D analog adapted for Part 33), validation data comparison (all four tiers), claims and limitations statement. Formatted for DER review and type design data package (TDDP) submission. Includes: simulation tool validation basis, calibration evidence, acceptance criteria met/not met table, and recommended physical test supplement.
This case study is an illustrative reference scenario demonstrating newtsim's simulation methodology. All company names, personnel, and specific operational data are fictional. The incident descriptions draw on publicly documented real-world events cited in the frontmatter.