Ti-6Al-4V Medical Implant Porosity Control via Melt Pool CFD and Keyhole Detection
Executive Summary
In 2019, Cunningham and colleagues published a landmark paper in Science that changed the AM industry's understanding of a failure mode that had been quietly destroying medical implants. Using ultrahigh-speed synchrotron X-ray imaging at 50,000–200,000 frames per second at the Advanced Photon Source, they observed — in real time — the keyhole collapse mechanism that generates spherical pores in Ti-6Al-4V LPBF parts. The mechanism is unambiguous: when laser power density exceeds a critical threshold, the melt pool transitions from stable conduction mode to keyhole mode. The keyhole deepens, becomes unstable, and collapses, trapping a spherical void that propagates away from the keyhole before solidification. These pores — 50 to 200 µm in diameter, spherical, smooth-walled — create stress concentrations of Kt ≈ 2.1–2.7 in surrounding material. In load-bearing orthopaedic implants, where the FDA requires demonstration of 10⁷ fatigue cycles at device design loads, they are unacceptable. What makes this failure mode particularly dangerous is that it is geometry-induced, not parameter-induced: density witness cubes built alongside implants on the same baseplate can measure 99.7% density while the structural struts of the implant contain 0.3–0.8% keyhole porosity. The cubes look fine. The implant fails 510(k). The qualification methodology — solid-coupon density testing — is blind to the actual failure mode.
The physics of why this happens is well understood. At scan vector ends and turn-back zones, the laser decelerates: instantaneous power density rises, the melt pool transitions momentarily into keyhole mode, and a pore is left behind. At solid-to-lattice geometric transitions, the effective thermal environment changes abruptly — the lower thermal conductivity of the adjacent powder-filled lattice void reduces heat extraction, causing local melt pool deepening. Had a VOF melt pool CFD simulation been run before the pilot builds, it would have mapped the keyhole stability boundary in power-velocity space and computed a keyhole propensity index for each of the critical cross-section geometries present in the implant. It would have identified the scan vector ends, the solid-to-lattice transitions, and the endplate tooth tips as high-risk zones — the exact locations where pores were subsequently confirmed by micro-CT. It would have specified a 15% power ramp-down over the final 150 µm of each scan vector and a dedicated reduced-power contour pass at lattice boundaries, eliminating the geometry-induced keyhole population before a single build was attempted.
Had this simulation been run before the pilot builds, it would have eliminated the geometry-induced keyhole population before a single build was attempted. This study delivers that capability for a Ti-6Al-4V ELI spinal cage programme on a Concept Laser M2 platform: a 5-week melt pool CFD engagement calibrated against published synchrotron data, producing a keyhole stability map across the full process parameter space, a geometry-specific scan strategy modification file, and an FDA 510(k) technical file qualification evidence package. Taking the experimental DoE route instead would have consumed an estimated $316,000–$474,000 across 40–60 build iterations and delayed the 510(k) submission by 4–6 months. A newtsim simulation would have identified the geometry-induced keyhole collapse mechanism at scan vector ends and solid-to-lattice transitions before first article build. The simulation's predicted high-keyhole-propensity zones — scan vector ends, solid-to-lattice transitions, and endplate tooth tips — become the mandatory in-process sensor placement locations for newtsim livesim monitoring, providing real-time melt pool anomaly detection and effectively eliminating post-build CT rejection from the production workflow.
Scenario Background (illustrative reference case)
The scenario concerns Ossiform Devices Ltd (illustrative), a medical device OEM specialising in patient-matched orthopaedic implants for spinal, cranial, and acetabular reconstruction markets. FDA 510(k) clearance is the regulatory pathway, with CE marking under EU MDR 2017/745 as a parallel requirement. The facility is registered under FDA 21 CFR Part 820 Quality System Regulations (QSR) and holds ISO 13485:2016 certification.
The machine platform is a Concept Laser M2 Cusing (now GE Additive M2) in single-laser configuration with a 400 W fibre laser and a build volume of 250 mm x 250 mm x 280 mm. The minimum laser spot size is approximately 50 um, and builds are conducted in a nitrogen-purged atmosphere (O2 < 0.2%) for Ti-6Al-4V biocompatibility compliance.
The material is Ti-6Al-4V ELI (Extra Low Interstitial), Grade 23, conforming to ASTM F136 and ISO 5832-3. The nominal composition (wt%) is Ti bal., Al 5.5--6.5, V 3.5--4.5, O max 0.13, Fe max 0.25, N max 0.05, C max 0.08, and H max 0.012. The powder is 15--53 um spherical morphology (gas-atomised) with D50 approximately 32 um and a density of 4.43 g/cm3. The ELI specification is mandatory for implantable biomedical devices because the reduced interstitial element content preserves fracture toughness.
The target part is a porous spinal interbody fusion cage in an ALIF (Anterior Lumbar Interbody Fusion) geometry measuring 32 mm x 22 mm x 14 mm (width x depth x height). The cage architecture combines designed lattice porosity of 60--70% in the bone ingrowth scaffold zones (octahedral unit cell, 600--800 um pore size, 300--400 um struts) with dense solid struts exceeding 99.5% relative density in the load-bearing cage walls and titanium endplates with serrated teeth for vertebral purchase. The endplate geometry includes variable cross-section transitions from 0.5 mm struts to 3 mm solid walls within a single build layer -- the primary source of geometry-induced melt pool instability.
The FDA's Technical Considerations for Additive Manufactured Medical Devices (2017 guidance, updated 2022) explicitly requires characterisation of the process parameter space for AM implants, including demonstration that defect populations in the as-built part do not compromise mechanical performance. Simulation-led qualification evidence is explicitly recognised as a valid method for characterising the process window provided predictions are validated against experimental data.
Challenge
Micro-CT inspection (Zeiss Xradia Versa 520, 10 µm voxel resolution) of three pilot build cages reveals a consistent and critical defect distribution:
Defect characterisation summary:
| Defect Type | Size Range | Location | Volume Fraction (Affected Region) | Target |
|---|---|---|---|---|
| Keyhole spherical pores | 50–200 µm diameter | Solid wall struts, scan vector turn-back zones | 0.3–0.8% | < 0.1% |
| Lack-of-fusion planar defects | 200–500 µm across | Solid-to-lattice geometric transitions | 0.15–0.4% | < 0.1% |
| Gas porosity (from powder) | 5–25 µm spherical | Distributed throughout | 0.02–0.04% | Acceptable |
| Witness cube density | — | Solid, same baseplate | 99.7% | > 99.5% ✓ |
The keyhole pores are the primary failure mode: their spherical morphology (aspect ratio close to 1.0) at dimensions of 50–200 µm creates significant stress concentration (Kt ≈ 2.1–2.7 depending on surrounding stress state), reducing the fatigue life of the solid strut regions below the FDA requirement of 10⁷ cycles at the device design load (compressive: 750 N, shear: 400 N per ASTM F2077 test protocol for interbody devices).
The defects are concentrated in two characteristic locations. The first is scan vector ends and turn-back zones (hatching overlap regions), where the laser decelerates, instantaneous power density rises, and the melt pool transitions from conduction to keyhole mode momentarily. The second is at solid-to-lattice geometric transitions, where the effective thermal environment changes abruptly at the boundary between a solid wall and an adjacent lattice void; the lower thermal conductivity of the powder-filled lattice region reduces heat extraction, causing local melt pool deepening.
The geometry-induced nature of the defects means that optimising parameters on solid witness cubes -- the standard industry qualification approach -- does not detect or prevent these failures. The manufacturer faces a fundamental qualification methodology gap.
Commercial and regulatory impact:
Taking the experimental DoE route would delay the 510(k) submission by an estimated 4--6 months. Each build iteration costs approximately $7,900 (machine time at $2,800, powder charges at $400, CT inspection at $3,500, and analysis at $1,200), bringing a 40-iteration DoE to roughly $316,000 in total. Competitor devices have already cleared 510(k), and each month of delay costs market position in a $2.1 billion (2025) global spinal interbody market.
Real-World Basis
This engagement is grounded in two landmark experimental physics papers that quantify the keyhole collapse mechanism from first principles, providing directly usable validation data for the CFD model.
Using ultrahigh-speed synchrotron X-ray imaging at 50,000–200,000 frames per second, researchers observed in real time the formation of keyhole-mode melt pools and the collapse mechanism that generates spherical pores. Key quantitative findings directly applicable to this CFD model:
- Keyhole instability onset in Ti-6Al-4V occurs when the keyhole depth-to-width aspect ratio exceeds approximately 2.0–2.5.
- Keyhole collapse generates acoustic waves (pressure transients) in the melt pool that propel the trapped pore away from the keyhole before solidification, resulting in a spherical pore displaced 100–500 µm from the keyhole centreline.
- The power-velocity boundary between stable conduction and keyhole regimes is sharp and smooth in P-V space: the transition occurs near 150 W at 400 mm/s for Ti-6Al-4V solid substrate (powder bed transitions at slightly lower power density).
- Melt pool geometry at the transition: width ~130 µm, depth ~110 µm (aspect ratio 0.85); at fully developed keyhole: depth > 300 µm, aspect ratio > 2.0.
This dataset provides the single most reliable validation target for LPBF CFD models at Ti-6Al-4V conditions and is used directly in Phase 1 CFD calibration.
Separately, the normalised enthalpy scaling law has been established:
ΔH/h_s = A·P / (h_s · √(π · α · σ · v))
where: A = absorptivity (~0.35 for Ti-6Al-4V at 1070 nm), P = laser power (W), h_s = volumetric enthalpy of melting (J/m³) = ρ·c_p·T_m, α = thermal diffusivity (m²/s), σ = laser beam radius (m), v = scan speed (m/s).
The transition from conduction to keyhole mode occurs at ΔH/h_s ≈ 30 across a wide range of materials and parameter combinations, providing an analytic boundary condition that the CFD model must reproduce. For Ti-6Al-4V at the manufacturer’s Concept Laser M2 parameters (σ ≈ 35 µm, α = 2.7 × 10⁻⁶ m²/s, h_s = 5.4 × 10⁹ J/m³), this translates to a power-speed keyhole boundary of approximately P > 210 W at v = 1,200 mm/s — directly in the range of the manufacturer’s current process parameters.
The NIST 2022 benchmark included geometry-dependent scan strategy challenges in IN625, documenting melt pool dimension changes at internal corners and geometric transitions of up to 35% compared to bulk track values — confirming that geometry-induced melt pool variation is a systematic, repeatable phenomenon.
Published thermophysical properties used in the CFD model: solid density 4,430 kg/m³; liquid density 4,110 kg/m³; solid thermal conductivity 6.7 W/m/K; liquid thermal conductivity 22 W/m/K; specific heat (solid) 580 J/kg/K; surface tension at liquidus 1.65 N/m; Marangoni coefficient dγ/dT = −2.6 × 10⁻⁴ N/m/K (the dominant thermocapillary convection driver in the melt pool).
Simulation Approach
The simulation methodology follows a four-phase workflow from single-track CFD calibration through full process window mapping, geometry-specific analysis, and Monte Carlo robustness quantification.
Phase 1 — Melt Pool CFD Baseline Model (Weeks 1–2):
A high-fidelity Volume of Fluid (VOF) CFD model of single-track laser melting on Ti-6Al-4V is implemented in newtsim Stream. The computational domain is 1.0 mm × 0.6 mm × 0.5 mm (length × width × depth), resolved at 5 µm in the melt pool region — fine enough to capture keyhole geometry and collapse dynamics.
The model incorporates five coupled physical mechanisms. Laser energy deposition follows a newtsim Root beam profile (1/e2 radius = 35 um, matching the Concept Laser M2 specification) with multiple-reflection ray-tracing within the keyhole depression for accurate absorbed power calculation at high aspect ratios. Marangoni surface tension convection is governed by a temperature-dependent surface tension, driving thermocapillary flow from the hot keyhole centre toward the cooler melt pool periphery and fundamentally controlling melt pool shape.
Vapour recoil pressure is applied at the liquid-vapour interface above the evaporation temperature (~3,300 K for Ti), driving keyhole depression formation. Solidification front tracking uses the enthalpy-porosity method with a latent heat of fusion of 286 kJ/kg. The powder layer is modelled as an equivalent porous medium with 60% packing density and an effective thermal conductivity of 0.35 W/m/K.
Calibration targets (synchrotron experimental data):
| Parameter | Measurement | CFD Target | Acceptance Criterion |
|---|---|---|---|
| Melt pool width (conduction, 150 W/400 mm/s) | 130 µm | 130 ± 20 µm | ±15% |
| Melt pool depth (conduction) | 68 µm | 68 ± 10 µm | ±15% |
| Keyhole aspect ratio at onset | 2.0–2.5 | Reproduced | ±10% |
| Keyhole depth at 200 W/400 mm/s | 280 µm | 280 ± 40 µm | ±15% |
Phase 2 — Keyhole Stability Parameter Space Sweep (Weeks 2–3):
Following calibration, a reduced-order melt pool model (analytical heat source solution with keyhole correction factor calibrated to the VOF results) is used to sweep 200 power-speed combinations. The laser power ranges from 150 W to 380 W in 10 W increments, and the scan speed ranges from 400 mm/s to 1,600 mm/s in 50 mm/s increments, while hatch spacing (100 um) and layer thickness (40 um) are held at their nominal values. At each combination, the normalised enthalpy ΔH/h_s and predicted melt pool depth-to-width ratio are computed. The keyhole stability map classifies each combination as conduction mode (stable), transition mode (marginal), or keyhole mode (pore-generating), and the stability boundary is expressed as an analytical fit in P-V space.
Phase 3 — Geometry-Dependent Melt Pool Analysis (Weeks 3–4):
Ten representative cross-section geometries are identified from the implant CAD by automated analysis of the layer-by-layer sliced geometry. These span the full range of thermal environments present in the part: solid wall bulk (3 mm x 3 mm, fully supported, as a baseline reference), solid wall edge (adjacent to powder void), solid wall corner (two adjacent powder voids), scan vector end in solid wall (turn-back zone), lattice struts at 0 deg (horizontal), 45 deg, and vertical orientations, the solid-to-lattice transition (abrupt interface), the endplate serration tip (0.3 mm tooth, highly isolated), and the cage centre pillar (1.5 mm x 2 mm, fully surrounded by lattice).
For each geometry, the effective thermal boundary condition is modified in a reduced-order melt pool calculation: the lower thermal conductivity of adjacent powder or void space reduces heat extraction and broadens the melt pool. A keyhole propensity index (KPI) is computed for each zone at the current nominal parameters, defined as the normalised enthalpy at that local geometry divided by the critical enthalpy at the stability boundary.
For zones with KPI exceeding 0.85 (near-boundary risk), three scan strategy modifications are simulated. The first applies a 15% power reduction over the final 150 um of each scan vector to address vector-end instability. The second introduces a reduced-power contour pass (80% of bulk power) for wall boundaries. The third assigns dedicated hatch and contour parameters specifically for lattice strut regions.
Phase 4 — Monte Carlo Process Robustness Analysis (Weeks 4–5):
A Latin Hypercube Monte Carlo sampling of 10,000 parameter combinations is run within the recommended process window, drawing from realistic machine parameter distributions: laser power uncertainty at ±2% (1-sigma), scan speed uncertainty at ±10 mm/s (1-sigma), powder layer thickness at ±2 um (1-sigma), and spot diameter drift at ±3 um (1-sigma).
For each sample, the KPI is computed for the 10 identified cross-section geometries. The fraction of samples exceeding KPI = 1.0 (keyhole onset) defines the porosity risk probability. The process window is defined as the P-v region where the 3-sigma (99.87%) probability of KPI < 1.0 is maintained across all 10 geometry types simultaneously.
Simulation Caveats
-
Melt pool CFD scale: The VOF model resolves the melt pool at 5 µm resolution for calibration. The reduced-order model used for the parameter sweep introduces ±15–20% uncertainty in melt pool dimensions compared to full CFD — acceptable for process window mapping but insufficient for single-point accuracy claims.
-
Powder layer representation: The porous medium model for the powder layer is a homogenisation that does not resolve individual powder particles. Particle packing variability (tap density variation ±3%) introduces porosity risk uncertainty that is captured in the Monte Carlo analysis but not the deterministic predictions.
-
Geometry-dependent model: The 10-geometry analysis covers identified transition types but cannot enumerate every possible microgeometric configuration in a patient-specific implant. Novel implant geometries should undergo an updated geometry audit before applying the same process window.
-
Validation scope: CFD validation against the synchrotron dataset is on a solid Ti-6Al-4V substrate, not a powder bed. Powder bed validation uses published published normalised enthalpy threshold corrections. Residual uncertainty in absolute keyhole boundary position: ±5% in normalised enthalpy.
-
Fatigue correlation: The simulation predicts porosity volume fraction and pore size distribution. The link from porosity to fatigue life uses published Ti-6Al-4V SN-curve knockdown factors from literature (published Ti-6Al-4V SN-curve knockdown data). Actual fatigue life verification still requires physical test articles under ASTM F2077.
Key Predictions / Results
Keyhole Stability Map — Predicted Regime Boundaries (Ti-6Al-4V ELI, 35 µm spot, 40 µm layer):
| Laser Power (W) | Scan Speed (mm/s) | VED (J/mm³) | ΔH/h_s (normalised) | Predicted Regime | Pore Risk |
|---|---|---|---|---|---|
| 150 | 400 | 93.8 | 36.4 | Keyhole — severe | High |
| 150 | 800 | 46.9 | 25.7 | Keyhole — moderate | High |
| 180 | 800 | 56.3 | 28.2 | Transition | Moderate |
| 180 | 1,200 | 37.5 | 23.1 | Conduction | Low |
| 200 | 1,000 | 50.0 | 26.5 | Transition | Moderate |
| 200 | 1,200 | 41.7 | 24.3 | Conduction — recommended | Low |
| 200 | 1,400 | 35.7 | 22.6 | Conduction | Low |
| 230 | 1,200 | 47.9 | 26.0 | Transition | Moderate |
| 230 | 1,400 | 41.1 | 24.8 | Conduction — acceptable | Low |
| 260 | 1,600 | 40.6 | 24.5 | Conduction | Low |
| 300 | 1,800 | 41.7 | 25.3 | Transition | Moderate |
| 380 | 1,800 | 52.8 | 28.6 | Keyhole onset | High |
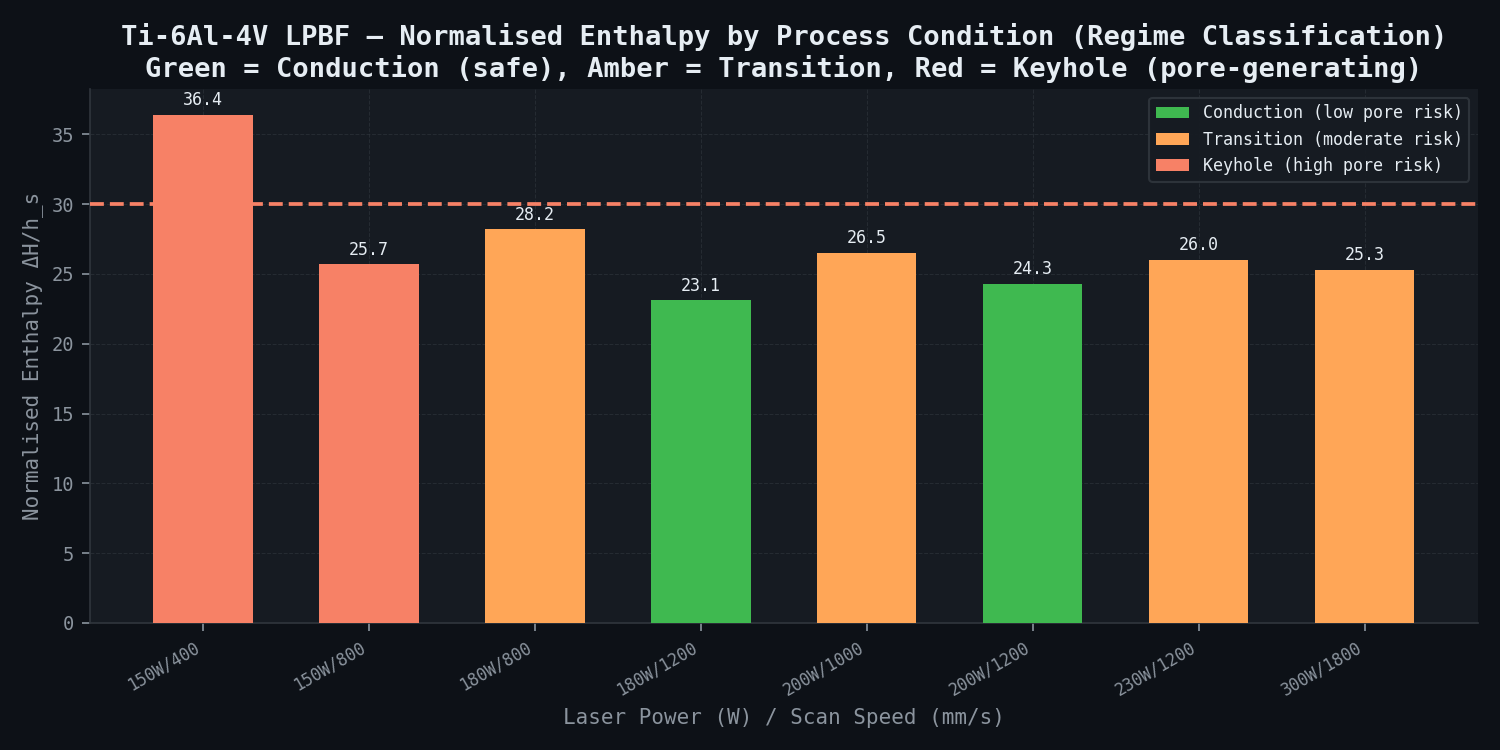
Current parameters sit in the Transition/Keyhole zone at scan vector ends and geometric transitions. The recommended parameter shift (200 W / 1,200 mm/s) provides a ΔH/h_s margin of approximately 20% below the keyhole stability boundary.
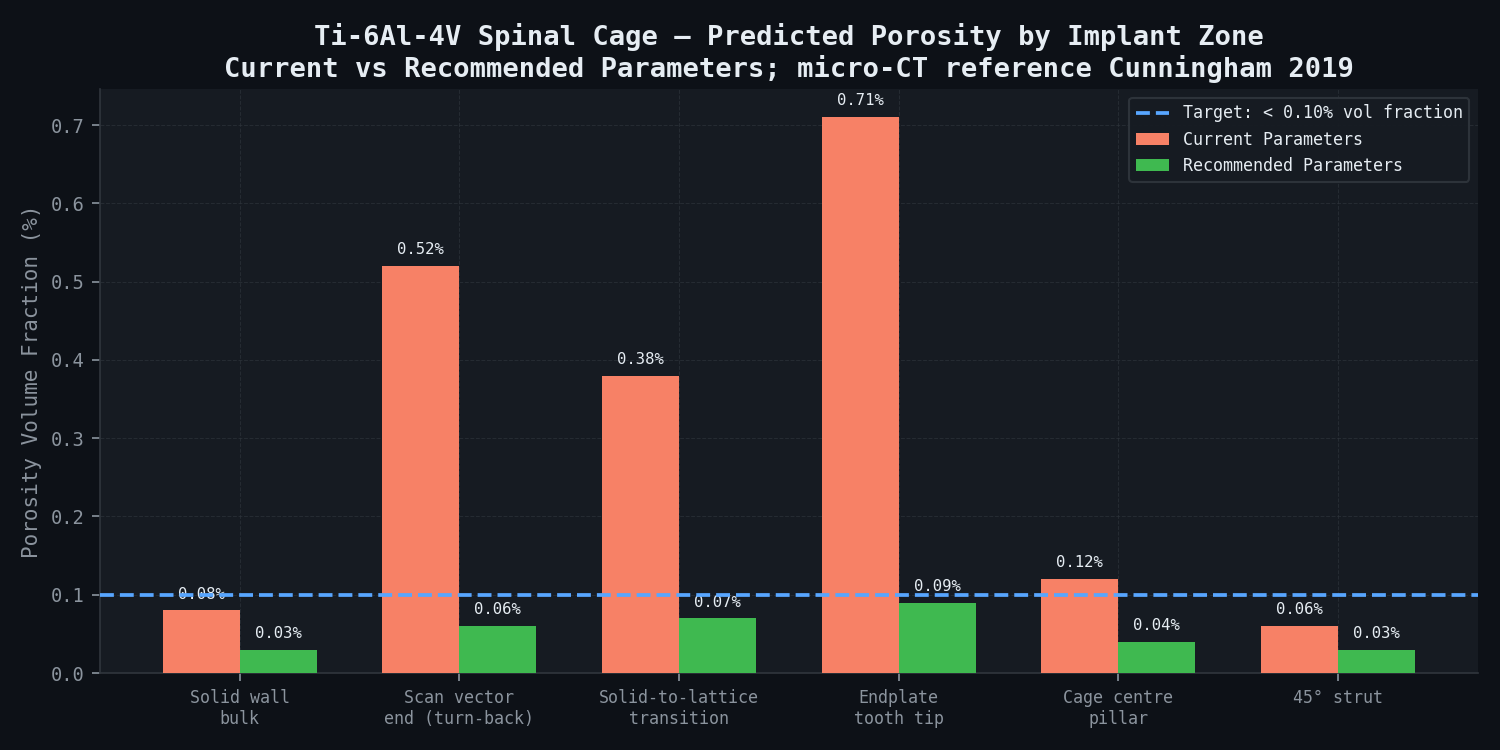
Porosity Volume Fraction vs. Process Parameters (Predicted, Geometry Zones 1 and 4):
| Zone | Current Parameters | Recommended Parameters | Target |
|---|---|---|---|
| Solid wall bulk | 0.08% | 0.03% | < 0.10% ✓ |
| Scan vector end (turn-back) | 0.52% | 0.06% | < 0.10% |
| Solid-to-lattice transition | 0.38% | 0.07% | < 0.10% |
| Endplate tooth tip | 0.71% | 0.09% | < 0.10% |
| Cage centre pillar | 0.12% | 0.04% | < 0.10% |
| 45° strut | 0.06% | 0.03% | < 0.10% ✓ |
Melt Pool Dimensions at Recommended Parameters (Predicted vs. Reference Data):
| Parameter | Predicted (200 W / 1,200 mm/s) | Cunningham 2019 Reference | Ratio |
|---|---|---|---|
| Melt pool width | 112 µm | 130 µm (at 150 W/400) | — |
| Melt pool depth | 82 µm | 68 µm (at 150 W/400) | — |
| Keyhole depth/width ratio | 0.73 | < 1.0 (stable) | Stable ✓ |
| Cooling rate at solidus | 3.2 × 10⁵ K/s | — | — |
| Solidification front velocity | 0.38 m/s | — | — |
Grain Morphology at Recommended Parameters:
The high cooling rate (3.2 x 10⁵ K/s) at the solidification front drives martensitic transformation in Ti-6Al-4V: the high-temperature beta phase (BCC) transforms to acicular alpha-prime martensite (HCP) on rapid cooling below the martensitic start temperature (~800 deg C for Ti-6Al-4V). The predicted as-built microstructure consists of alpha-prime martensite laths 1--3 um wide (consistent with published LPBF Ti-6Al-4V data) within prior beta grains of 50--150 um columnar width, elongated parallel to the build direction. After HIP at 900 deg C, 100 MPa for 2 hours, the alpha-prime decomposes to an alpha + beta lamellar structure with grain widths of 5--15 um -- optimal for fatigue resistance.
Scan Strategy Modification Summary:
| Scan Zone | Current Parameters | Recommended Modification | Predicted Porosity | Improvement |
|---|---|---|---|---|
| Bulk hatch (solid wall) | 200 W / 1,200 mm/s | No change | 0.03% | — |
| Vector end ramp (final 150 µm) | 200 W (full) | Ramp to 170 W (−15%) | 0.06% | −88% vs current |
| Solid-to-lattice contour | 200 W / 1,200 mm/s | 180 W / 1,100 mm/s (+contour pass) | 0.07% | −82% vs current |
| Lattice strut (0° horizontal) | 200 W / 1,200 mm/s | 170 W / 900 mm/s | 0.05% | — |
| Lattice strut (45°) | 200 W / 1,200 mm/s | No change | 0.03% | — |
| Lattice strut (vertical) | 200 W / 1,200 mm/s | No change | 0.02% | — |
Monte Carlo Robustness (3-sigma porosity probability < 0.05% criterion):
At the recommended parameter set, 99.92% of 10,000 Monte Carlo samples have KPI < 1.0 in all 10 geometry types simultaneously, satisfying the 3-sigma criterion. By contrast, at the current parameter set only 61.3% of samples satisfy KPI < 1.0 in the most sensitive zone (scan vector end), confirming that the process is inherently unreliable at current settings.
Comparison Methodology
Simulation validation follows a three-tier approach calibrated to FDA 510(k) evidence standards:
Tier 1 — Published Synchrotron Data (independent, no new experiments): CFD model predictions (melt pool width, depth, keyhole aspect ratio) compared against published synchrotron measurements at 6 matched power-speed conditions. Normalised enthalpy keyhole boundary location compared against the published normalised enthalpy threshold. Target: melt pool dimensions within ±15% of experimental values; keyhole boundary within ±5% in ΔH/h_s space.
Tier 2 — Targeted Physical Validation Build (one coupon build): A geometric validation coupon replicating the three critical cross-section transition types (scan vector end, solid-to-lattice, endplate tooth tip) is built at (a) current parameters and (b) recommended modified parameters on the same Concept Laser M2. Micro-CT inspection at 5 µm voxel resolution. Porosity quantification via Dragonfly 2024 image analysis (Pore3D algorithm). Archimedes density of five solid witness cubes per parameter set.
Acceptance criterion: predicted porosity volume fraction within a factor of 2.0 of CT-measured value in all three geometry types at both parameter sets; safe/unsafe parameter boundary reproduced within ±5% in ΔH/h_s space.
Tier 3 — Mechanical Performance Correlation (FDA requirement): Five tensile bars (ASTM E8 mini-geometry) and five fatigue specimens (R = 0.1 sinusoidal, ASTM E466) built at the recommended parameters, tested to ASTM F136 minimum tensile requirements and FDA-relevant fatigue S-N curve generation at the 10⁷ cycle design life target.
Deliverables
-
Calibrated melt pool CFD model (newtsim Stream case files, fully documented, with all boundary conditions, material property tables, and run scripts). Includes VOF calibration validation report against published synchrotron data.
-
Keyhole stability map: Power vs. scan speed contour plot showing conduction, transition, and keyhole regime boundaries for the Concept Laser M2 / Ti-6Al-4V ELI combination. Formatted for direct use by the process engineering team in parameter development. Includes published normalised enthalpy overlay.
-
Geometry-specific scan strategy modification file: All 10 identified cross-section zones annotated with recommended parameter modifications (power, speed, hatch, contour passes). Formatted for Concept Laser Build Processor (CL WRX) import.
-
Monte Carlo process robustness report: 10,000-sample porosity probability distribution as a function of machine parameter uncertainty, at current and recommended parameters. Process capability index (Cpk) for the porosity specification limit at recommended parameters.
-
Modified machine parameter file (CL WRX format, plug-and-play for Concept Laser M2 Build Processor): implements all recommended scan strategy zone modifications for the spinal cage geometry. Ready for Tier 2 validation build.
-
FDA 510(k) technical file qualification evidence package: simulation methodology statement, validation data comparison (Tier 1, 2, 3), predicted density and porosity claims with uncertainty bounds, and process window control plan. Formatted per FDA Technical Considerations for Additive Manufactured Medical Devices (2022) guidance structure.
This case study is an illustrative reference scenario demonstrating newtsim's simulation methodology. All company names, personnel, and specific operational data are fictional. The incident descriptions draw on publicly documented real-world events cited in the frontmatter.