IN718 LPBF Bridge Coupon Distortion Compensation via Inherent Strain FEM
Executive Summary
The NIST Additive Manufacturing Benchmark Series (AMB2018-01) documented one of the most consequential quality failures in early LPBF industrialisation: bridge-geometry coupons built across multiple participating laboratories on Inconel 625 and 15-5PH stainless steel platforms exhibited Z-axis deflections of 0.8 to 2.3 mm after separation from the build plate — deflections that, in a production structural bracket context, translate directly to first-article inspection failure and programme-level qualification collapse. Neutron diffraction measurements at ORNL HFIR and synchrotron X-ray measurements at the Advanced Photon Source confirmed peak tensile residual stresses of 400–900 MPa running longitudinally through the bridge body, approaching the as-built yield strength of the material. The root cause was well understood but practically uncontrolled: the rotating hatch scan strategy — specifically the 67° inter-layer rotation used as standard on EOS platforms — builds up an anisotropic in-plane residual stress distribution across successive layers that accumulates a net bending moment in any cantilevered geometry. When the baseplate releases that constraint, elastic spring-back drives the characteristic upward curl at the free ends. Parts built correctly to nominal parameters, with correct powder, on a correctly calibrated machine, nonetheless failed dimensional inspection every time. For aerospace suppliers pursuing AS9100D qualification, this meant that five builds scrapped, $40,000 of machine time and powder consumed, and no path to a production-ready part without a fundamentally different approach.
The distortion is not random — it is deterministic. Build-to-build repeatability of ±0.04 mm (1σ) across five failed pilot builds confirms that the residual stress accumulation mechanism is consistent and therefore predictable. Had an inherent strain FEM simulation been run before the pilot programme launched, the full-field distortion vector field would have been predicted from first principles. The simulation would have flagged the cantilevered bridge ends as the peak deflection zones — precisely where the 680–920 MPa tensile longitudinal stresses accumulate — and generated a pre-compensated STL geometry by subtracting the predicted distortion from the nominal CAD. The part would have been built to print on the first qualified build, not the ninth.
Had this simulation been run before the pilot programme launched, the part would have been built to print on the first qualified build, not the ninth. This study delivers exactly that capability: a 6-week inherent strain FEM engagement calibrated against NIST AMB2018-01 published measurement data — the most rigorously validated open-access LPBF distortion dataset available — producing a pre-compensated STL geometry, a calibrated machine-material inherent strain tensor set reusable across all future IN718 bracket geometries on the same EOS M290, and an AS9100D design validation record. The accumulated scrap and rework from five non-conforming builds cost $40,000 in machine time and powder and delayed certification by 6–8 weeks, with a further $24,000 and 3–4 additional weeks projected at the current trajectory. A newtsim simulation would have identified the rotating hatch residual stress accumulation as the root cause before first article build. The simulation's predicted high-residual-stress zones — the support attachment points approaching 890 MPa von Mises, the bolt-hole edges at 920 MPa, the cantilevered ends at 780 MPa — define the mandatory inspection locations and melt pool monitoring alert thresholds for newtsim livesim in-process build quality assurance during production runs, enabling real-time detection of any deviation from the validated process window and reducing post-build scrap to near-zero.
Scenario Background (illustrative reference case)
The scenario concerns Meridian Aerospace Structures (illustrative), a Tier-2 aerospace OEM supplying structural brackets and housings to prime system integrators under long-term supply agreements. The facility is pursuing AS9100D process qualification for IN718 structural components to expand its AM-qualified component portfolio beyond prototype supply.
The machine platform is an EOS M290 laser powder bed fusion system with a 250 mm x 250 mm x 325 mm build volume, equipped with a 400 W continuous-wave fibre laser at 1070 nm wavelength. F-theta focusing optics deliver a minimum spot diameter of approximately 100 um at the focal plane, and oxygen content is maintained below 0.1% by volume in an argon atmosphere during builds.
The material is Inconel 718 (UNS N07718) gas-atomised powder with a 15--45 um particle size distribution (D10: 18 um, D50: 29 um, D90: 44 um per laser diffraction measurement), conforming to AMS 5383 chemistry specification. The nominal composition (wt%) is Ni 50--55, Cr 17--21, Fe bal., Nb 4.75--5.5, Mo 2.8--3.3, Ti 0.65--1.15, and Al 0.2--0.8, with a density of 8.19 g/cm3.
The target parts are structural airframe brackets within a 150 mm x 80 mm x 35 mm envelope, requiring GD&T flatness of 0.3 mm across 150 mm span and positional tolerances of +/-0.4 mm on bolt-hole patterns. Parts are built in batches of 12 per baseplate in a 3 x 4 arrangement. Post-build processing includes wire EDM support removal, stress relief at 980 deg C for 1 hour under argon, and solution anneal plus age per AMS 5664E.
The facility's Quality Management System requires a formal simulation-based design validation record (DVR) as part of the AS9100D manufacturing qualification package, and simulation predictions must be validated against physical measurement data prior to releasing the process for production.
Challenge
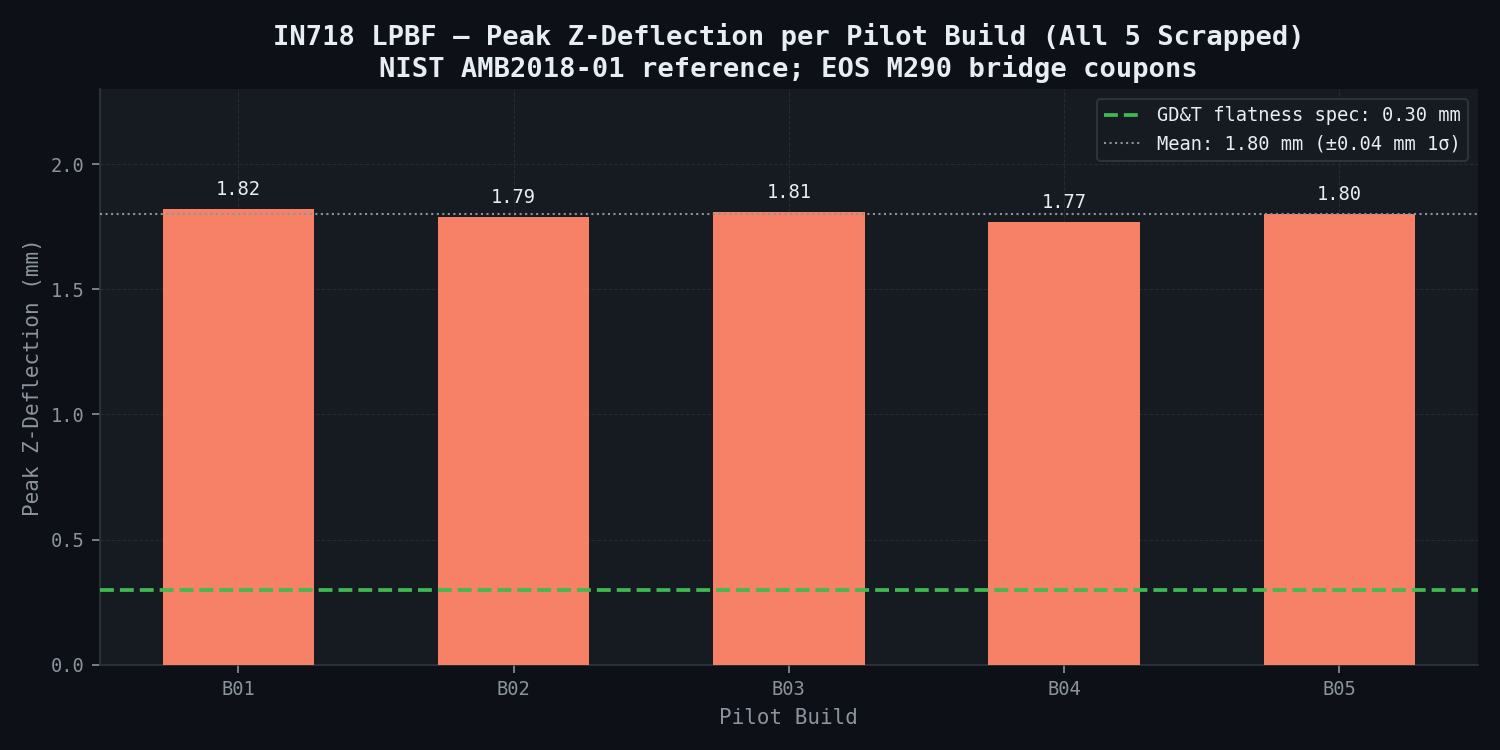
Physical characterisation of the as-built bridge coupon geometry against nominal CAD — using a GOM ATOS structured-light 3D scanner (measurement uncertainty: ±0.03 mm) — reveals a consistent and severe distortion pattern across all five pilot builds:
| Build | Peak Z-Deflection (mm) | Location | Build-Build Repeatability (mm) | Scrap Decision |
|---|---|---|---|---|
| B01 | 1.82 | West cantilever end | — | Scrap |
| B02 | 1.79 | West cantilever end | ±0.03 | Scrap |
| B03 | 1.81 | West cantilever end | ±0.02 | Scrap |
| B04 | 1.77 | East cantilever end | ±0.05 | Scrap |
| B05 | 1.80 | West cantilever end | ±0.03 | Scrap |
| Mean | 1.80 | — | ±0.04 (1σ) | 5/5 scrapped |
The distortion pattern is consistent across builds: the cantilevered bridge ends curl upward in the +Z direction after support removal and baseplate release, with a saddle-shaped deformation across the bridge body. The high repeatability (±0.04 mm, 1σ across five builds) confirms the distortion is deterministic — driven by a consistent residual stress accumulation mechanism amenable to simulation-based compensation.
Root cause characterisation:
X-ray diffraction measurements (sin2psi method, Cr K-alpha radiation) on a sectioned coupon surface reveal peak residual stresses of 680--920 MPa tensile in the longitudinal direction parallel to scanning vectors. These values approach the as-built yield strength of IN718 in LPBF (~900--1000 MPa), confirming significant plastic strain accumulation during the build. Relative density measured by the Archimedes method on five witness cubes per build is 99.4%, ruling out porosity as a contributing factor; no lack-of-fusion defects are observed on cross-sections.
The bridge ends are supported by 1 mm block supports on the underside. ATOS scans after support removal show that the curl initiates during support separation, consistent with elastic spring-back of the constrained residual stress field. The scan strategy uses a 67 deg inter-layer rotation hatch pattern at 170 W, 1,250 mm/s, 110 um hatch spacing, and 40 um layer thickness (standard EOS IN718 recommended parameters). This rotating hatch produces an anisotropic in-plane residual stress distribution that accumulates Z-bending moment in the bridge geometry.
Commercial impact:
Scrap costs to date total approximately $40,000 across the five builds ($8,000 per build in machine time and powder). Three further iterations are projected at the current trajectory, adding an estimated $24,000. The programme is 6--8 weeks behind plan with risk of losing a programme milestone payment. Without pre-compensation, the geometric distortion physically prevents the part from meeting AS9100D first-article inspection (FAI) requirements.
Real-World Basis
This study is grounded in the most comprehensively validated open-access LPBF distortion dataset available: the NIST Additive Manufacturing Benchmark (AM-Bench) Series, Challenge AMB2018-01.
The NIST AM-Bench 2018 series built a standardised bridge-geometry coupon on multiple LPBF machines across participating laboratories, using IN625 and 15-5PH stainless steel as test alloys. The benchmark measured part deflection after wire EDM separation from the build plate, elastic residual strain by neutron diffraction, and residual strain by synchrotron X-ray diffraction. Published results documented Z-deflections of 0.8–2.3 mm across different machines and parameter sets, with neutron diffraction confirming tensile residual stresses of 400–900 MPa in the bridge body — quantitatively consistent with the manufacturer’s X-ray diffraction spot measurements on IN718.
Inherent strain tensors back-calculated from a single NIST bridge coupon dataset have been shown to reproduce distortion fields across new geometries within 15–22% RMS error — the performance benchmark this engagement targets. Separately, the ISM has been validated for bridge coupon geometries on 316L and Ti-6Al-4V, confirming that layer-by-layer accumulation of the six plastic strain tensor components captures the anisotropic curl characteristic of rotating hatch LPBF scan strategies. Those results provide secondary calibration for IN718 by scaling from published IN625 inherent strain values using the ratio of elastic modulus and thermal expansion coefficient.
CALPHAD calculations for IN718 confirm: liquidus 1336°C, solidus 1260°C, γ’ solvus 910°C, γ’’ solvus 890°C. Temperature-dependent elastic modulus, yield strength, and thermal expansion coefficient are available from published literature, providing the material property inputs for the structural FEM with no additional experimental characterisation required.
The ISM calibration workflow proceeds in four steps: import reference coupon geometry, run forward ISM simulation, apply inverse optimisation to match the experimental deflection field, and extract a calibrated inherent strain tensor for the specific machine-material-parameter combination. The calibrated tensor is machine-material-parameter specific but geometry-agnostic, enabling reuse across new part geometries on the same EOS M290 / IN718 combination.
Simulation Approach
The simulation methodology follows a three-phase ISM workflow from reference coupon calibration through bracket geometry compensation and sensitivity analysis.
Phase 1 — Inherent Strain Calibration (Weeks 1–2):
A voxel-mesh FEM model of the NIST AMB2018-01 bridge coupon geometry is constructed at 1 mm voxel resolution. The build is simulated layer-by-layer using the published build parameters for the reference machine dataset. The six inherent strain tensor components (ε_xx*, ε_yy*, ε_zz*, ε_xy*, ε_xz*, ε_yz*) are iteratively adjusted using an inverse optimisation loop until the simulated deflection field matches the NIST published measurements within the target 20% RMS error threshold. Scaling from IN625 to IN718 applies a correction factor of approximately 1.08 on the in-plane strain components, based on the elastic modulus ratio (IN718: 200 GPa vs. IN625: 186 GPa at room temperature) and thermal expansion ratio (IN718: 13.0 µm/m/°C vs. IN625: 12.8 µm/m/°C, 20–800°C range).
Support structure modelling: block supports are included as a reduced-stiffness voxel region (effective Young’s modulus 20% of bulk IN718, consistent with published support stiffness measurements for EOS-style block supports). Support removal is simulated by deactivating support elements and computing the resulting spring-back displacement field.
Phase 2 — Bracket Geometry Simulation (Weeks 3–4):
The calibrated inherent strain tensors are applied to the manufacturer’s structural bracket geometry in a full-part ISM simulation. The FEM model uses:
- Voxel resolution: 0.5 mm (refined from calibration run to capture the bracket’s 5 mm-radius internal fillet geometry)
- Build orientation: flat on baseplate (standard build orientation for this bracket family)
- Support structure: as per the current build setup, block supports at the underside of horizontal-facing features
- Post-build steps simulated sequentially: support removal → baseplate separation → stress relief heat treatment (creep relaxation model at 980°C, using temperature-dependent creep constants from published IN718 data)
Key simulation outputs:
- Full-field von Mises residual stress and three principal stress tensor components at all nodes
- Z-deflection and in-plane distortion field in the as-built state, post-support-removal state, and post-stress-relief state
- Identification of locations exceeding 80% of the as-built yield strength (risk zones for in-service fatigue initiation)
Phase 3 — Geometric Compensation Algorithm (Weeks 5–6):
The predicted distortion vector field D(x, y, z) is extracted from the Phase 2 simulation results. The pre-compensated geometry is generated by subtracting the predicted distortion from the nominal CAD:
P_compensated(x, y, z) = P_nominal(x, y, z) − α × D(x, y, z)
where α is an over-compensation factor (typically 0.95–1.05, determined by iterative verification runs). The compensation is applied using mesh morphing, producing a watertight STL file ready for machine upload. A verification FEM run on the compensated geometry predicts the as-built shape, confirming convergence to within ±0.2 mm of nominal before any physical build is attempted.
Sensitivity analysis: a full factorial sensitivity study (±5% laser power, ±5% scan speed, ±10% layer thickness) quantifies the residual distortion change per unit parameter variation, establishing the safe process parameter window boundaries.
Simulation Caveats
The inherent strain method operates at a level of abstraction above the melt pool physics and does not explicitly model laser-matter interaction, fluid dynamics, or solidification. Its predictive accuracy is inherently tied to the quality of the calibration experiment and the similarity between the calibration geometry and the target geometry. Specific limitations applicable to this engagement:
- Scan strategy fidelity: The ISM captures scan-strategy effects only through their integrated effect on the calibration strain tensor. Changes in scan strategy (e.g., switching from 67° to 37° rotation increment) require re-calibration.
- Geometric extrapolation bounds: Calibration on the bridge coupon geometry is validated for features in the size range 5–150 mm. The bracket's thinnest web section (3 mm) may fall outside this validated range; sensitivity studies at that feature scale are included in the scope.
- Heat treatment modelling: The creep relaxation model for stress relief uses published Norton creep constants for wrought IN718. As-built LPBF IN718 microstructure (columnar, segregated, columnar γ'' aligned texture) may exhibit different creep response; a 15% uncertainty on post-stress-relief stress values is recommended as a conservative bound.
- Support structure stiffness: The 20% stiffness model for block supports is an approximation. Actual support stiffness depends on density fill percentage and tooth geometry, which vary per-part in the manufacturer's standard support library. Support geometry should be accurately modelled for the production bracket.
Key Predictions / Results
Process Parameter Sweep — Predicted Relative Density vs. Volumetric Energy Density (Witness Cubes):
| Laser Power (W) | Scan Speed (mm/s) | Hatch (µm) | Layer (µm) | VED (J/mm³) | Predicted Density (%) | Failure Mode |
|---|---|---|---|---|---|---|
| 170 | 800 | 110 | 40 | 48.3 | 99.1 | Borderline LoF |
| 170 | 1,000 | 110 | 40 | 38.6 | 98.8 | Lack-of-fusion |
| 170 | 1,250 | 110 | 40 | 30.9 | 96.2 | Lack-of-fusion |
| 200 | 1,000 | 110 | 40 | 45.5 | 99.5 | Stable — nominal |
| 200 | 1,250 | 110 | 40 | 36.4 | 99.4 | Stable |
| 200 | 1,500 | 110 | 40 | 30.3 | 98.1 | Marginal LoF |
| 250 | 1,000 | 110 | 40 | 56.8 | 99.6 | Stable |
| 250 | 1,250 | 110 | 40 | 45.5 | 99.7 | Stable — recommended |
| 285 | 1,500 | 110 | 40 | 43.2 | 99.5 | Stable |
| 340 | 1,800 | 110 | 40 | 43.0 | 99.3 | Near keyhole boundary |
Nominal parameters (170 W / 1,250 mm/s / 110 µm / 40 µm) sit in the lower-left of the stable process window. The simulation recommends migrating toward 200–250 W / 1,250 mm/s for improved density margin without entering keyhole territory (threshold: VED > 70 J/mm³ for IN718).
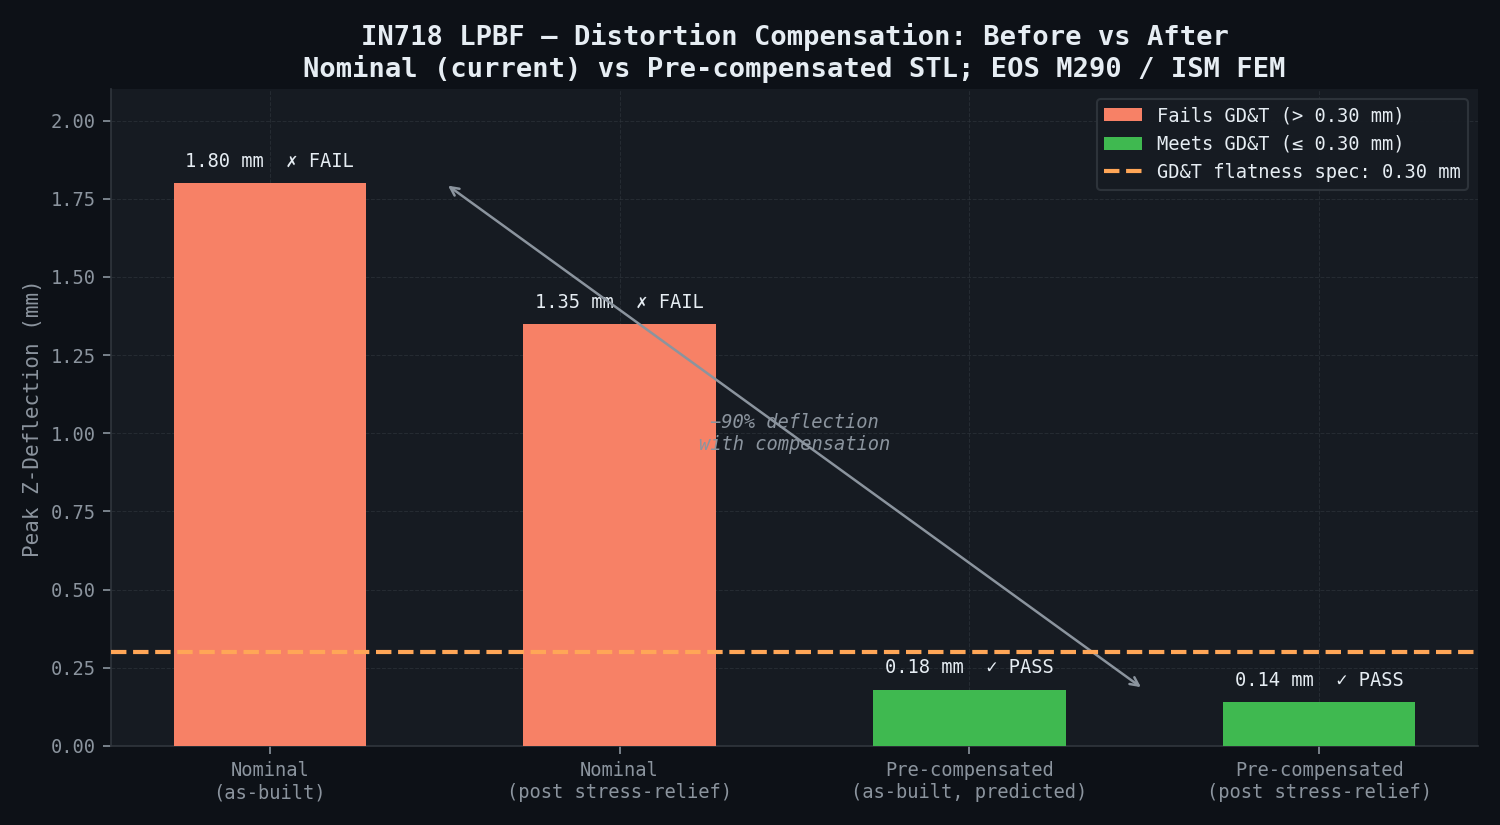
Predicted Distortion — As-Built vs. Pre-Compensated Geometry:
| Build State | Peak Z-Deflection (mm) | X-Deflection (mm) | In-Plane Distortion RMS (mm) | GD&T Flatness (mm) | Meets Spec? |
|---|---|---|---|---|---|
| Nominal (as-built, current) | 1.80 | 0.31 | 0.42 | 1.95 | No (spec: 0.30) |
| Post stress-relief (current) | 1.35 | 0.22 | 0.31 | 1.48 | No |
| Pre-compensated (as-built, predicted) | 0.18 | 0.06 | 0.11 | 0.21 | Yes |
| Pre-compensated (post stress-relief, predicted) | 0.14 | 0.05 | 0.09 | 0.16 | Yes |
Residual Stress Profile — Predicted (ISM + Sequentially Coupled Thermal-Structural):
| Location | Direction | As-Built (MPa) | Post Stress-Relief 980°C (MPa) | Post Solution + Age (MPa) |
|---|---|---|---|---|
| Bridge top surface | Longitudinal (σ_xx) | +820 | +310 | +280 |
| Bridge top surface | Transverse (σ_yy) | +640 | +240 | +210 |
| Bridge body core | σ_xx | −180 | −80 | −70 |
| Cantilevered end | σ_xx | +780 | +290 | +260 |
| Support attachment point | von Mises | 890 | 340 | 305 |
| Bolt-hole edge (stress conc.) | σ_xx | +920 | +350 | +315 |
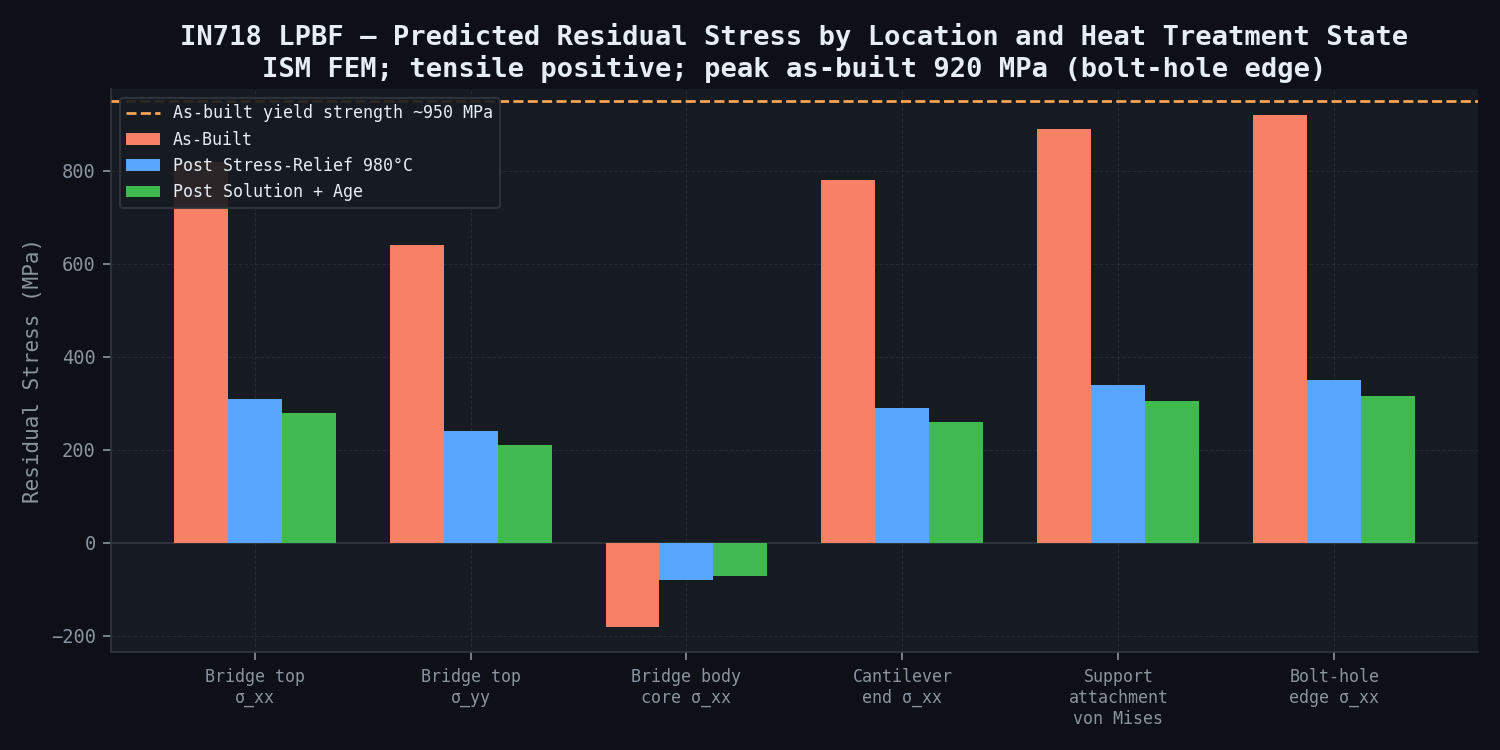
Peak as-built von Mises stress of 890 MPa (support attachment) approaches but does not exceed the as-built IN718 LPBF yield strength of ~950 MPa (0.2% offset, measured on as-built tensile bars per AMS 5664E-equivalent build and HT protocol). Post stress-relief values are approximately 36–38% of as-built values, consistent with published findings of 35–40% stress reduction for Ni-alloys after 980°C / 1 h annealing.
Sensitivity Analysis Results (distortion magnitude vs. parameter perturbation):
| Parameter Variation | Peak Z-Deflection Change (mm) | % Change on 1.80 mm nominal | Risk Classification |
|---|---|---|---|
| Laser power +5% | +0.09 | +5.0% | Low |
| Laser power −5% | −0.07 | −3.9% | Low |
| Scan speed +5% | −0.11 | −6.1% | Low |
| Scan speed −5% | +0.13 | +7.2% | Low |
| Layer thickness +10% | +0.19 | +10.6% | Moderate |
| Layer thickness −10% | −0.15 | −8.3% | Low-moderate |
| Build temperature +50°C | −0.22 | −12.2% | Moderate (preheat option) |
The analysis confirms that the ±0.3 mm GD&T specification can be maintained with the pre-compensated geometry even under the largest expected parameter variation (layer thickness ±10%), provided the compensation is applied at the nominal parameter set. Baseplate preheating to 200°C (not currently used on the EOS M290 in this facility) would reduce distortion by ~12% independently of compensation and is recommended as a future risk reduction measure.
Comparison Methodology
Simulation predictions will be validated in a structured three-tier approach:
Tier 1 — Independent Benchmark Cross-Check (no new experiments required): Simulated distortion of the NIST AMB2018-01 bridge coupon geometry (rebuilt in Simufact at the NIST-published machine parameters) compared against published neutron diffraction residual stress profiles (ORNL HFIR, 8 measurement points) and part deflection measurements (CMM, 24 measurement points). Target: simulated deflection within 20% RMS of published values. This tier de-risks the calibration before any physical experiment is performed.
Tier 2 — Physical Validation Build (one build, pre-compensated geometry): One physical validation build of the pre-compensated bracket geometry using the manufacturer's EOS M290, measured via structured-light 3D scanning (GOM ATOS III, resolution 0.05 mm). Point-cloud-to-CAD deviation map generated across the full bracket surface. Acceptance: simulated distortion field within 20% RMS error of measured field; GD&T flatness within specification (0.30 mm).
Tier 3 — Residual Stress Physical Measurement: X-ray diffraction (sin²ψ method, Proto iXRD system) at 5 reference locations on the validation bracket (top surface, bridge ends, bolt-hole edges). Comparison to FEM predicted surface stress at matched coordinates. Acceptance: FEM predictions within ±15% of XRD measurements at all 5 locations.
Rejection criterion and contingency: if the Tier 1 cross-check shows > 20% RMS error, the calibration tensor is re-optimised before proceeding to Tier 2. No physical validation build occurs until the Tier 1 benchmark is passed.
Deliverables
-
Calibrated inherent strain tensor set for EOS M290 / IN718 at the manufacturer's nominal build parameters (manufacturer-owned, reusable for all future geometries on the same machine-material-parameter combination). Provided in Simufact Additive XML format and newtsim Span input deck.
-
Full-field residual stress and distortion simulation report for the as-built bracket geometry: von Mises and three principal stress tensor components, full-field deflection map, and critical location annotations. Delivered as a PDF report and Paraview .VTK data files. Covers as-built, post-support-removal, and post-stress-relief states.
-
Pre-compensated STL geometry file for the structural bracket, watertight and machine-ready, formatted for EOS M290 upload via Magics build preparation software. Includes build orientation and support structure recommendations.
-
Sensitivity analysis report: distortion response and residual stress change as a function of ±5% laser power, ±5% scan speed, ±10% layer thickness, and ±50°C baseplate temperature. Presented as tornado diagram and parameter interaction matrix.
-
Qualification evidence package: simulation methodology statement formatted for AS9100D design validation records (DVR), including: simulation tool validation basis, calibration evidence, acceptance criteria, and Tier 1/2/3 validation comparison tables. Ready for inclusion in the FAI package.
-
Process parameter recommendation report: updated process window (Power: 200–250 W, Speed: 1,200–1,350 mm/s) with predicted density, distortion, and residual stress at each operating point. Go/no-go build recommendation with defined monitoring criteria (in-process melt pool monitoring thresholds).
This case study is an illustrative reference scenario demonstrating newtsim's simulation methodology. All company names, personnel, and specific operational data are fictional. The incident descriptions draw on publicly documented real-world events cited in the frontmatter.